2871
Robust frequency-dependent diffusional kurtosis computation using an efficient direction scheme, axisymmetric modelling and regularization1Centre for Functional and Metabolic Mapping (CFMM), Robarts Research Institute, Western University, London, ON, Canada, 2Department of Medical Biophysics, Schulich School of Medicine and Dentistry, Western University, London, ON, Canada, 3Translational Neuroscience Group, Robarts Research Institute, Western University, London, ON, Canada, 4Department of Anatomy & Cell Biology, Western University, London, ON, Canada, 5Department of Physiology and Pharmacology, Schulich School of Medicine and Dentistry, Western University, London, ON, Canada
Synopsis
Keywords: Diffusion Analysis & Visualization, Microstructure
Motivation: While diffusion MRI has proven to be valuable for studying tissue microstructure, there is a need to develop more sensitive and specific methods to detect microstructural changes at various spatial scales.
Goal(s): To develop an acquisition and analysis scheme that can robustly compute frequency-dependent diffusional kurtosis metrics.
Approach: Acquisition parameters such as a novel efficient direction scheme were presented along with an analysis pipeline that utilizes axisymmetric modelling, spatial regularization, and maximizes data usage.
Results: We demonstrate the advantage of using the efficient scheme over conventional methods, and the analysis pipeline improves diffusional kurtosis map quality compared to conventionally used methods.
Impact: We present an acquisition and analysis scheme that generates robust frequency-dependent diffusional kurtosis maps, which may offer increased sensitivity to cytoarchitectural changes that occur at various cellular spatial scales over the course of healthy aging, and due to pathological alterations.
Introduction
Frequency-dependent diffusion MRI (dMRI) using oscillating gradient encoding and diffusional kurtosis imaging (DKI) provide additional insight into tissue microstructure compared to conventional dMRI. While combining these techniques may allow for increased sensitivity and specificity to microstructural changes, the generation of large b-values required for DKI are challenging when encoding diffusion using oscillating gradients1,2, and DKI maps are often confounded by noise3. While efficient encoding schemes enable larger b-values by maximizing gradient usage, they do not have sufficient directions to fit directional kurtosis metrics. Accordingly, we present a DKI fitting algorithm that combines axisymmetric modelling4, takes advantages of degeneracy across oscillating gradient frequencies, and employs spatial regularization, which enables robust fitting of kurtosis parameters using an efficient 10-direction scheme that offers twice the efficiency of traditional schemes in generating b-value. This fitting algorithm is available at https://gitlab.com/cfmm/matlab/matmri5,6.Methods
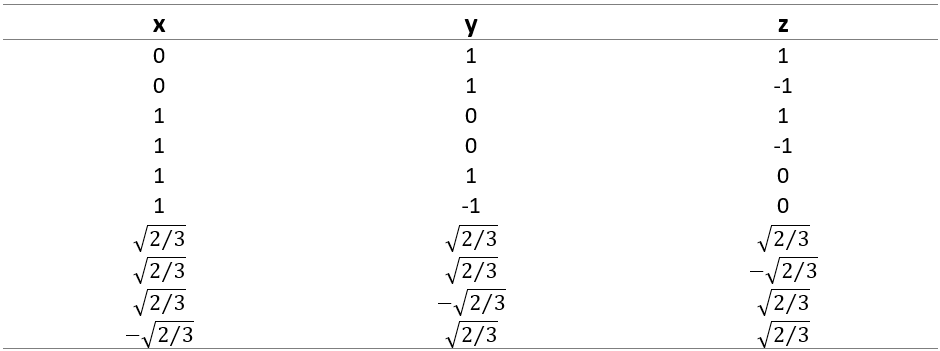
Data acquisition and pre-processing: dMRI data was acquired in 8 (4 males) healthy transgenic mice (JAX stock #030898) on a 9.4 T Bruker scanner with 1 T/m gradient strength. The protocol included oscillating frequencies of 0, 60, and 120 Hz, each with 2 b=0 images and b-value shells of 1,000 and 2,500 s/mm2 each with the 10-direction scheme (Figure 1). The protocol was acquired using single-shot EPI with parameters: 200x200x500 µm3 voxel size, TE/TR=35.5/15000 ms, 4 averages, scan time of 66 minutes. In one mouse, we also acquired a ‘conventional’ DKI protocol for comparison: 40-directions, 1 average, and TE=52 ms to account for the increased gradient duration to achieve the maximum b-value. Complex-valued averages underwent partial Fourier reconstruction, phase alignment, frequency/signal drift correction, and denoising7, then averages were combined. Data then underwent Gibbs ringing correction8 followed by EDDY9.Data fitting: To control noise amplification, we implement a regularization algorithm during the two steps of axisymmetric DKI fitting. First, we regularize diffusion tensor fitting (used to determine the axis of symmetry) in each voxel using isotropic total variation10, where $$$\gamma_{DT}$$$ controls the strength of regularization:
$$argmin\Vert{A_{DTI}x_{DT}-y}\Vert_2^2+\gamma_{DT}\Vert{T_{DT} x_{DT}}\Vert_2^2$$ The data consistency term is based on the diffusion tensor $$$x_{DT}$$$, the encoding matrix for the diffusion tensor representation $$$A_{DTI}$$$, and the log-transformed data $$$y$$$. The operator $$$T_{DT}$$$ performs a numerical derivative along each spatial dimension, for each diffusion tensor component. Next, the symmetric axis is used to fit parameters based on its relationship with the encoding direction4. We regularize parameter fitting using:
$$argmin\Vert{A_{DKI}x_{DK}-y}\Vert_2^2+\gamma_{DK}\Vert{T_{DK} x_{DK}}\Vert_2^2$$ where $$$x_{DK}$$$ are the diffusional kurtosis parameters, $$$A_{DKI}$$$ is the encoding matrix for the axisymmetric DKI model, and $$$\gamma_{DK}$$$ is the regularization weighting for this step.
Data Analysis: To compare kurtosis tensor vs axisymmetric DKI, DIPY11 was used for kurtosis tensor fitting. SNR was measured as the voxel-wise signal mean divided by the standard deviation across b=0 acquisitions, measured in the cortex. We examined map quality when using data from some/all b-values and separate/all oscillating frequencies to determine the symmetric axis. To quantitatively assess contrast and image quality, we calculated the contrast-to-standard-deviation ratio (CSR)12 using manually defined white and grey matter ROIs.
Results
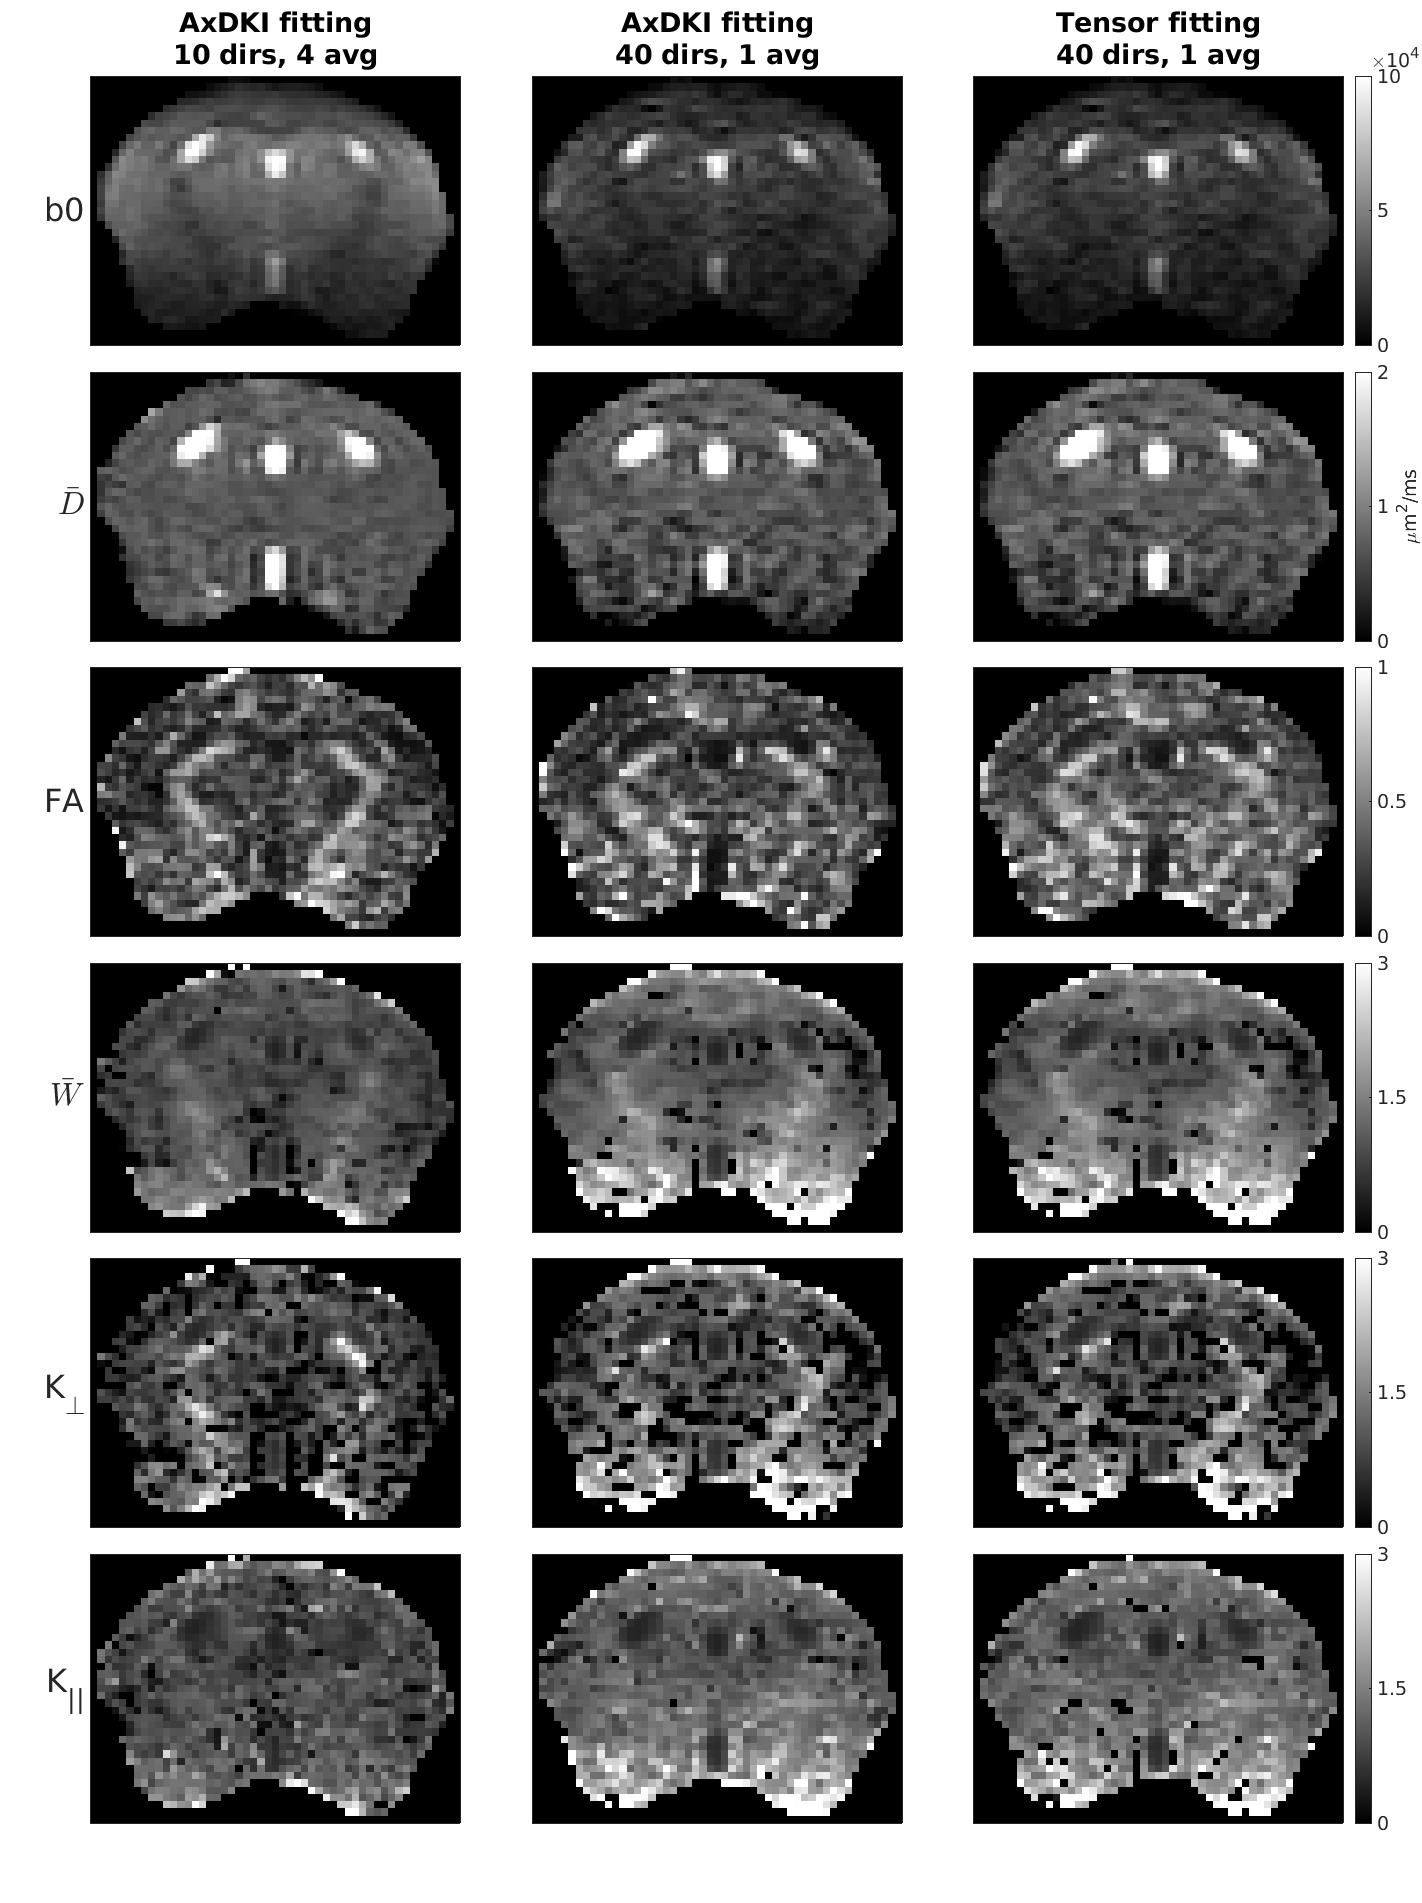
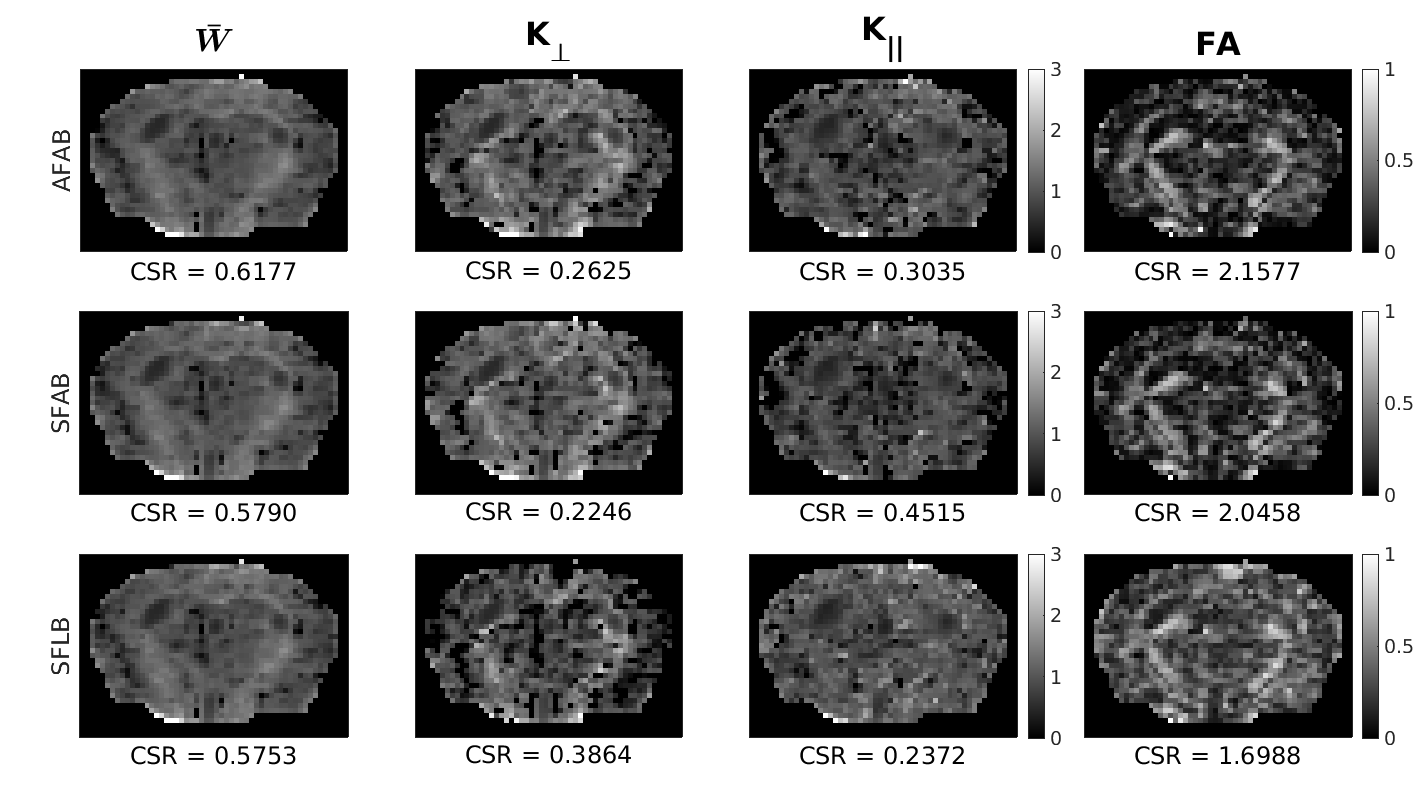
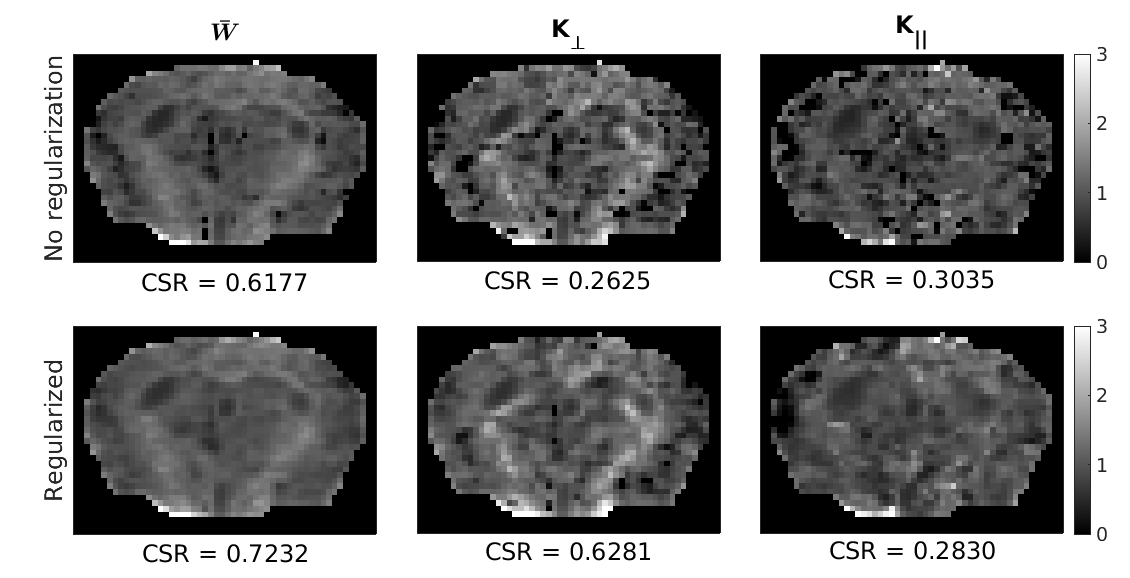
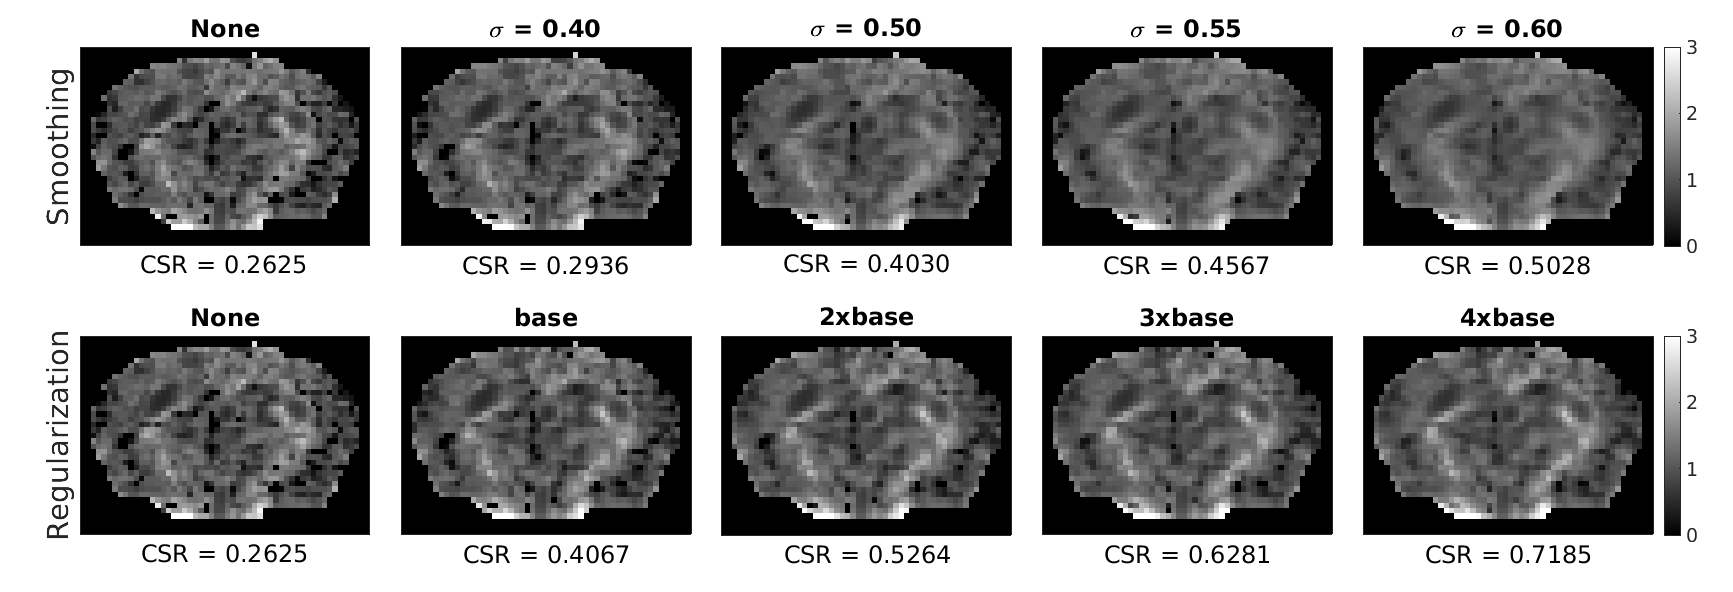
Figure 2 shows that kurtosis tensor and axisymmetric fitting generate qualitatively similar maps, and the efficient 10-direction scheme results in higher SNR (30.6 vs 11.4) and greatly improved map quality. Figure 3 demonstrates that using data from all b-values and frequencies to determine the symmetric axis improves map quality. Figure 4 shows that implementing spatial regularization during fitting helps reduce noise while preserving true contrast, and Figure 5 demonstrates its advantages over Gaussian smoothing in these respects.Discussion
In this work, we investigated a method to compute frequency-dependent DKI maps, which was used in combination with an efficient 10-direction scheme with twice the efficiency of traditional schemes in generating b-value. The use of the 10-direction scheme compared to a 40-direction scheme allowed for a large TE reduction, increasing SNR (~3x) and improving kurtosis estimation. In agreement with past studies4,13, axisymmetric DKI was shown to provide comparable map quality to tensor fitting, and the reduced dataset requirements allows fitting with only 10-directions, not possible with kurtosis tensor fitting. Given that the crucial step in this fitting method is determining the symmetric diffusion axis, we showed that using data from all b-values and frequencies for its estimation improves map quality. Our implementation of a two-step regularization algorithm proved to be an effective way to reduce noise amplification in kurtosis fitting while preserving contrast, and we show its advantageous over Gaussian smoothing, an oft-reported preprocessing step for DKI.Conclusion
The pipeline for acquiring and fitting frequency-dependent DKI data addresses key challenges when combining these techniques, and may facilitate enhanced interrogation of cytoarchitectural changes in various avenues.Acknowledgements
This research was supported by the Natural Sciences and Engineering Research Council of Canada: Canada Graduate Scholarships—Master’s Program (NSERC-CGS M), Canada Research Chairs (950-231993), Canada First Research Excellence Fund to BrainsCAN, and the US Department of Defense under congress-directed medical research program (CDMRP), Peer Reviewed Alzheimer’s Research Program (PRARP) by award# W81XWH-20-1-0323.References
1. Xu, J. Probing neural tissues at small scales: Recent progress of oscillating gradient spin echo (OGSE) neuroimaging in humans. J Neurosci Methods 349, 109024 (2021).
2. Aggarwal, M., Smith, M. D. & Calabresi, P. A. Diffusion‐time dependence of diffusional kurtosis in the mouse brain. Magn Reson Med 84, 1564–1578 (2020).
3. Tabesh, A., Jensen, J. H., Ardekani, B. A. & Helpern, J. A. Estimation of tensors and tensor-derived measures in diffusional kurtosis imaging. Magn Reson Med 65, 823–836 (2011).
4. Hansen, B., Shemesh, N. & Jespersen, S. N. Fast imaging of mean, axial and radial diffusion kurtosis. Neuroimage 142, 381–393 (2016).
5. Baron, C. A. MatMRI: A GPU enabled package for model based MRI image registration (0.1.00). Zenodo (2021).
6. Varela‐Mattatall, G. et al. Single‐shot spiral diffusion‐weighted imaging at 7T using expanded encoding with compressed sensing. Magn Reson Med 90, 615–623 (2023).
7. Veraart, J. et al. Denoising of diffusion MRI using random matrix theory. Neuroimage 142, 394–406 (2016).
8. Tournier, J.-D. et al. MRtrix3: A fast, flexible and open software framework for medical image processing and visualisation. Neuroimage 202, 116137 (2019).
9. Smith, S. M. et al. Advances in functional and structural MR image analysis and implementation as FSL. Neuroimage 23, S208–S219 (2004).
10. Rudin, L. I., Osher, S. & Fatemi, E. Nonlinear total variation based noise removal algorithms. Physica D 60, 259–268 (1992).
11. Henriques, R. N. et al. Diffusional Kurtosis Imaging in the Diffusion Imaging in Python Project. Front Hum Neurosci 15, (2021).
12. Kingsley, P. B. & Monahan, W. G. Contrast‐to‐noise ratios of diffusion anisotropy indices. Magn Reson Med 53, 911–918 (2005).
13. Nørhøj Jespersen, S. White matter biomarkers from diffusion MRI. Journal of Magnetic Resonance 291, 127–140 (2018).
Figures