2860
Short-term White Matter Microstructural Changes in Young Adults Infected with SARS-COV-2 Omicron Variant1Tanwei College, Tsinghua University, Beijing, China, 2Department of Biomedical Engineering, Tsinghua University, Beijing, China, 3Tsinghua Laboratory of Brain and Intelligence, Tsinghua University, Beijing, China
Synopsis
Keywords: DWI/DTI/DKI, COVID-19
Motivation: The prevalence of the SARS-CoV-2 Omicron variant poses a significant concern. It is important to investigate its potential repercussions on public health.
Goal(s): To evaluate the impacts of Omicron variant on white matter microstructure.
Approach: Diffusion MRI data were acquired on young adults tested positive for COVID-19 antigen or nucleic acid within two months and with non-hospitalized mild symptoms during infection. Tract-wise DTI metrics were used to quantify microstructural properties.
Results: SARS-CoV-2 infection leads to significant short-term microstructural changes in the white matter, which exhibit spatial and gender disparity.
Impact: This study provides evidence for short-term microstructural changes induced by SARS-COV-2 Omicron variant infection, which motivates further investigation to uncover the mechanisms by which viruses invade the nervous system.
Introduction
The SARS-CoV-2 pandemic especially nowadays Omicron variant has triggered a worldwide health crisis, increasing evidence suggests that SARS-CoV-2 may invade the central neural system1–3. Previous diffusion MRI studies have found that SARS-CoV-2 infection may induce changes in white matter, resulting in higher MD1,4 and lower volume fraction of intra-cellular water4–6.However, previous studies either focused on other strain rather than Omicron variant (e.g., Delta strain for Huang5,6) or based on the population without vaccination records4.Therefore, this study was proposed to investigate the short-term white matter microstructural changes in patients infected with SARS-COV-2 Omicron variant and with mild symptoms.
Methods
Study population. A total of 102 young adult patients (PTs) infected with SARS-COV-2 Omicron variant and 54 age and sex-matched asymptomatic controls (ACs) aging between 20 to 30 years old were recruited in January 2023 (patients: controls=2:1). Patients were tested positive for COVID-19 antigen or nucleic acid within two months and with non-hospitalized mild symptoms during infection. Subjects with incidental findings or contraindications to MRI examination were excluded.Data from 100 PTs (age: 25.4±2.5; male: 51 (51%)) and 50 ACs (age: 25.1±3.0.; male: 24 (48%)) were used in the study (Figure 1). 54 and 46 PTs were tested positive within 30 days and between 30 days and 60 days, respectively (referred to as PT30- and PT30+). The demographic and clinical information including the age, gender, body mass index (BMI), and saturation of peripheral oxygen (SpO2) were listed in Figure 1.
MRI protocol. All subjects underwent MRI examination with approval from Tsinghua IRB and written informed consent forms. Diffusion MRI data were acquired on a 3-Tesla scanner (Siemens, MAGNETOM Prisma) equipped with a 64-channel head coil using the product 2D-SMS-PGSE-EPI sequence: TR/TE=6600/66 ms, voxel size=1.5×1.5×1.5 mm3, SMS factor=2, GRAPPA factor=2, 32 and 64 uniform directions for b=1000 and 2500 s/mm2, respectively, partial Fourier factor=6/8, one b=0 image volume with reversed phase-encoding direction (posterior-to-anterior), acquisition time=12.5 min.
Data processing. Diffusion data were processed using FSL as follows: (1) gradient nonlinearity correction7 (in-house Matlab codes and “applywarp”); (2) brain masking (“bet2”8); (3) susceptibility and eddy current-induced distortion correction and co-registration (“topup”9,10 and “eddy”11), (4) diffusion tensor fitting using b=1000 mm2/s data to derive DTI metrics including fractional anisotropy (FA), axial/radial/mean diffusivity (AD, RD, MD) (“dtifit”12); (5) creating ROIs of 42 major white matter tracts in each subject’s native diffusion space by nonlinearly co-registering the FA map of each subject to the template FA map in FSL-provided HCP tractography atlas and reversing the transform ( “fsl_reg”); (6) computing the mean FA/AD/RD/MD value within each tract for each subject ( “fslstats”).
Statistical analysis.
Tract-wise values were compared between two groups (PT vs. AC) or three groups (PT30- vs. PT30+ vs. AC). Additionally, the same analysis was performed for each gender. Details are shown in Figure 2.
For 2-group comparison (PT vs. AC), independent t-test and Mann-Whitney test was used for normally and non-normally distributed data, respectively. Data with a p value smaller than 0.1 were subsequently corrected for the difference caused by age, sex, BMI and SpO2 using multivariate logistic regression.
For 3-group comparison (PT30- vs. PT30+ vs. AC), one-way ANOVA and Kruskal-Wallis test was used for normally and non-normally distributed data, respectively. For data showing significance in the comparison (p<0.05), independent t-test and Mann-Whitney test was used for normally and non-normally distributed data, respectively, to perform pairwise comparison. Results were adjusted using Bonferroni method.
Results
The clinical information showed a significant difference in SpO2 among three-group comparison, which indicates that the infection will lead to short-term lower SpO2.Significant differences were found for each type of comparison. The difference was mainly concentrated in the (1) left arcuate fasciculus, (2) left cingulum subsection: peri-genual, (3) right corticospinal tract, (4) right inferior longitudinal fasciculus, (5) right inferior longitudinal fasciculus I, (6) right inferior longitudinal fasciculus III, and (7) left vertical occipital fasciculus. The anatomical location of these fiber tracts are shown in Figure 3. The detailed comparison information is listed in Figure 4 and 5.Discussion and Conclusion
This study provides evidence that even young adults with mild symptoms experience short-term impacts on white matter microstructure from SARS-COV-2 Omicron variant infection. Moreover, the observed impacts exhibit spatial, hemispherical, and gender disparity, prompting further investigation into the virus's influence on the neural systems of different genders.Future work will use the b=2500mm2/s data for estimating microstructural properties using more sophisticated imaging methods such as DKI13 and NODDI14, as well as tract-specific analysis methods such as TBSS15 and automated fiber quantification (AFQ)16 for increased sensitivity to microstructural changes.
Acknowledgements
Funding was provided by the Tsinghua University Startup Fund.References
1. Douaud G, Lee S, Alfaro-Almagro F, et al. SARS-CoV-2 is associated with changes in brain structure in UK Biobank. Nature. 2022;604(7907):697-707. doi:10.1038/s41586-022-04569-5
2. Mao L, Jin H, Wang M, et al. Neurologic Manifestations of Hospitalized Patients With Coronavirus Disease 2019 in Wuhan, China. JAMA Neurol. 2020;77(6):683. doi:10.1001/jamaneurol.2020.1127
3. Nalbandian A, Sehgal K, Gupta A, et al. Post-acute COVID-19 syndrome. Nat Med. 2021;27(4):601-615. doi:10.1038/s41591-021-01283-z
4. Marvin P, Nägele FL, Mayer C, et al. Brain imaging and neuropsychological assessment of individuals recovered from a mild to moderate SARS- CoV-2 infection.
5. Huang S, Zhou Z, Yang D, et al. Persistent white matter changes in recovered COVID-19 patients at the 1-year follow-up. Brain. 2022;145(5):1830-1838. doi:10.1093/brain/awab435
6. Huang S, Zhou X, Zhao W, et al. Dynamic white matter changes in recovered COVID-19 patients: a two-year follow-up study. Theranostics. 2023;13(2):724-735. doi:10.7150/thno.79902
7. Reuter M, Fischl B. Avoiding asymmetry-induced bias in longitudinal image processing. Neuroimage. 2011;57(1):19-21. doi:10.1016/j.neuroimage.2011.02.076
8. Jenkinson M, Pechaud M, Smith S. BET2: MR-based estimation of brain, skull and scalp surfaces. In: Eleventh Annual Meeting of the Organization for Human Brain Mapping, 2005.
9. Andersson JLR, Skare S, Ashburner J. How to correct susceptibility distortions in spin-echo echo-planar images: application to diffusion tensor imaging. Neuroimage. 2003;20(2):870-888. doi:10.1016/S1053-8119(03)00336-7
10. Smith SM, Jenkinson M, Woolrich MW, et al. Advances in functional and structural MR image analysis and implementation as FSL. Neuroimage. 2004;23 Suppl 1:S208-219. doi:10.1016/j.neuroimage.2004.07.051
11. Andersson JLR, Sotiropoulos SN. An integrated approach to correction for off-resonance effects and subject movement in diffusion MR imaging. Neuroimage. 2016;125:1063-1078. doi:10.1016/j.neuroimage.2015.10.019
12. Le Bihan D, Mangin JF, Poupon C, et al. Diffusion tensor imaging: concepts and applications. J Magn Reson Imaging. 2001;13(4):534-546. doi:10.1002/jmri.1076
13. Jensen JH, Helpern JA, Ramani A, Lu H, Kaczynski K. Diffusional kurtosis imaging: the quantification of non-gaussian water diffusion by means of magnetic resonance imaging. Magn Reson Med. 2005;53(6):1432-1440. doi:10.1002/mrm.20508
14. Zhang H, Schneider T, Wheeler-Kingshott CA, Alexander DC. NODDI: practical in vivo neurite orientation dispersion and density imaging of the human brain. Neuroimage. 2012;61(4):1000-1016. doi:10.1016/j.neuroimage.2012.03.072
15. Smith SM, Jenkinson M, Johansen-Berg H, et al. Tract-based spatial statistics: voxelwise analysis of multi-subject diffusion data. Neuroimage. 2006;31(4):1487-1505. doi:10.1016/j.neuroimage.2006.02.024
16. Yeatman JD, Dougherty RF, Myall NJ, Wandell BA, Feldman HM. Tract Profiles of White Matter Properties: Automating Fiber-Tract Quantification. Beaulieu C, ed. PLoS ONE. 2012;7(11):e49790. doi:10.1371/journal.pone.0049790
Figures

Figure 1. Demographic and clinical characteristics of the study samples. a two-group comparison (PT vs. AC), independent t test and U test for normally and non-normally distributed data respectively, and chi-square test for sex ratio; b three-group comparison (PT30- vs. PT30+ vs. AC), oneway ANOVA and H test for normally and non-normally distributed data respectively, and chi-square test for sex ratio; c the comparison between PT30- and AC; d the comparison between PT30+ and AC; e the comparison between PT30- and PT30+. Each two-group comparison was adjusted using Bonferroni method.
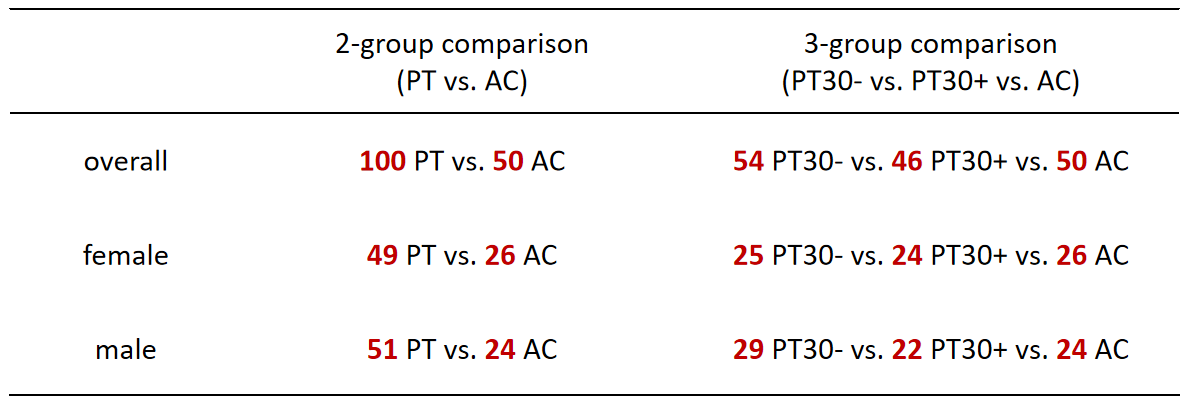
Figure 2. A total of 100 young adult patients (PTs) and 50 asymptomatic controls (ACs) were included in the statistical analysis. Subjects were categorized into 2-group (PT vs. AC) or 3-group (PT30- vs. PT30+ vs. AC). Additionally, the same analysis was performed for each gender.
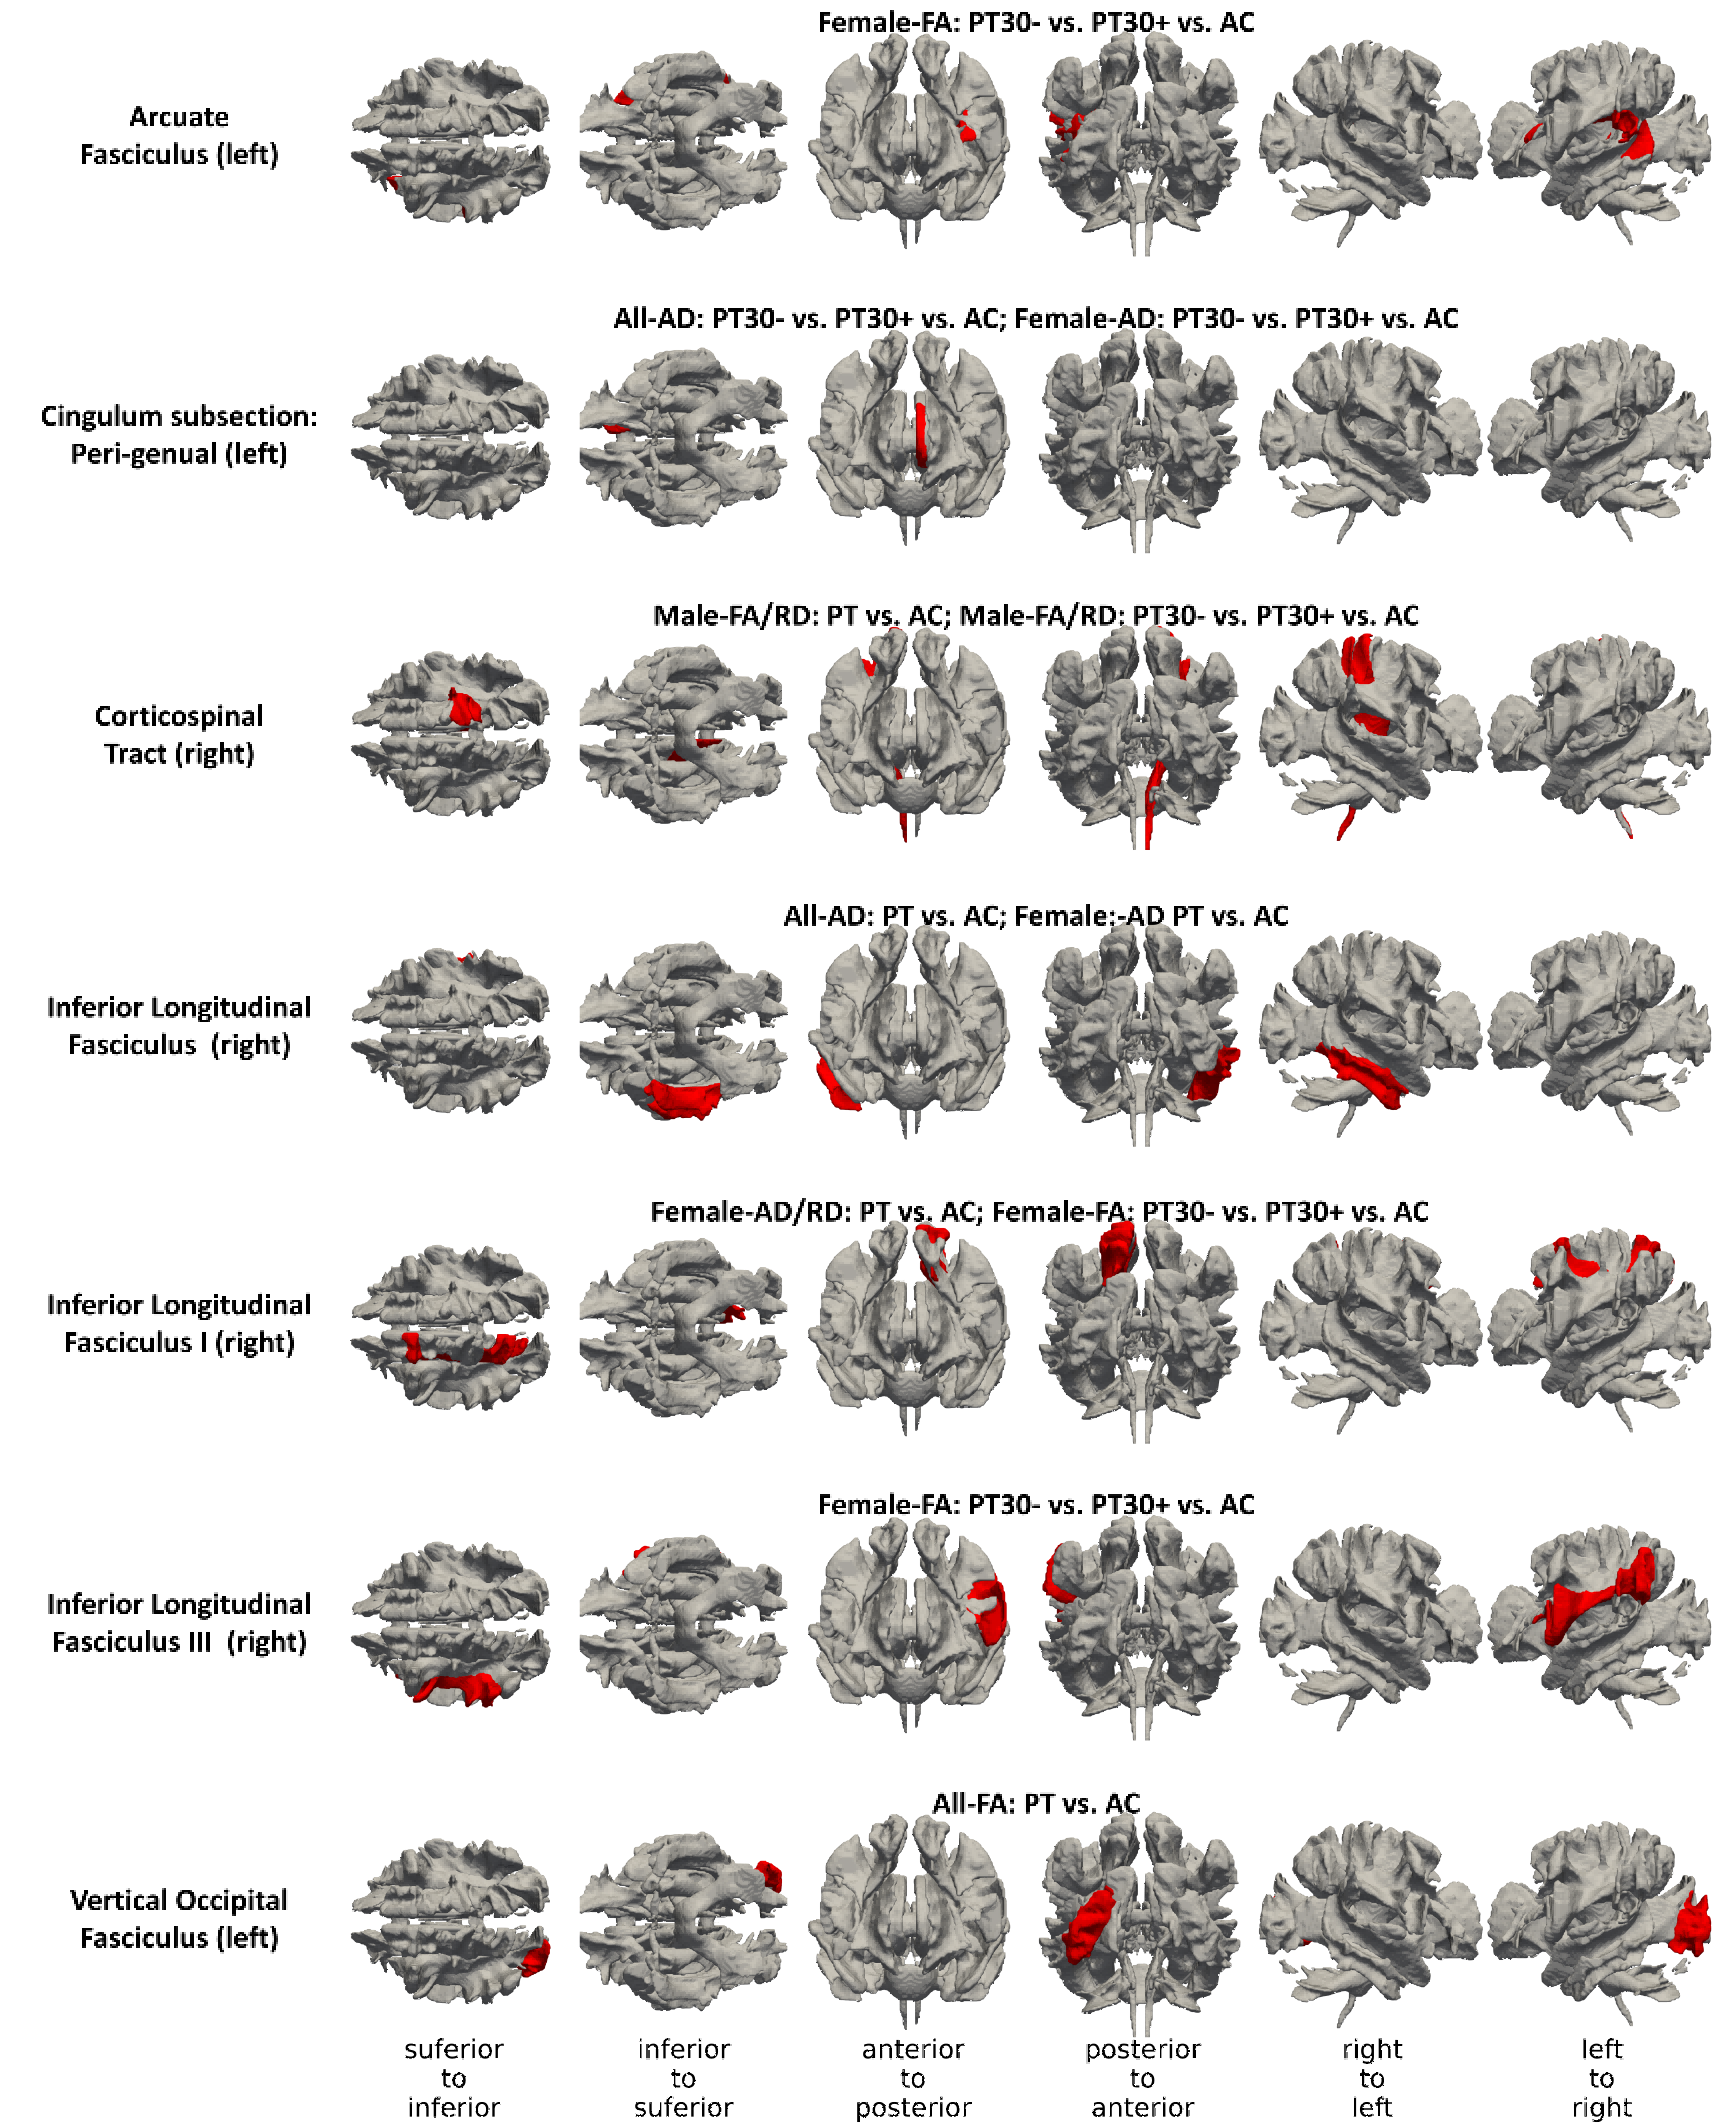
Figure 3. Anatomical location of fiber tracts (red color) showing significant difference in group comparison is displayed. Every row displays different views of the brain. The annotation above every tract lists the group and microstructural property for which significant difference exists.


Figure 5. 42 major fiber tracts from FSL-provided HCP tractography atlas were compared and the tracts that display significant difference between 3 groups are shown. a The comparison among three groups, one-way ANOVA for normally distributed data and Kruskal-Wallis tests for non-normally distributed data; b the comparison between PT30- and AC; c the comparison between PT30+ and AC; d the comparison between PT30- and PT30+. Bonferroni method was used to adjust for each two-group comparison.