2852
Investigation of Optimal Readout Frequency for the Non-Uniform B0 (NuBo) Field Cycling (FC) Scanner1Department of Radiology and Biomedical Imaging, Yale School of Medicine, New Haven, CT, United States, 2Department of Biomedical Engineering, Yale University, New Haven, CT, United States
Synopsis
Keywords: Low-Field MRI, Low-Field MRI
Motivation: The field cycling (FC) scanner introduces an extra degree of freedom for adjusting the B0 field strength during both polarization and readout. However, the ideal readout Larmor frequency remains unexplored.
Goal(s): To investigate the optimal readout Larmor frequency for the non-uniform B0 (NuBo) scanner regarding SNR, T2*, and T2 dephasing.
Approach: Controlled experiments at two Larmor frequencies, 1MHz and 2MHz, were conducted. Echo trains at these two frequencies were acquired.
Results: Results show that readout at a lower Larmor frequency could benefit from a longer echo train, and longer T2*, but with the penalty of a smaller initial signal amplitude.
Impact: This research conducted a comparison of the trade-off between SNR, T2* and T2 decay across various readout Larmor frequencies, potentially offering insights for researchers in the field of field cycling in the future.
INTRODUCTION
Field cycling MRI (FC-MRI) offers a distinct advantage in that it allows a single MRI system to generate a high B0 field for spin polarization, while simultaneously providing a low B0 field for readout, effectively minimizing field inhomogeneity [1]. To optimize signal intensity, the polarization B0 field is typically set to the system's maximum capacity. The field strength during the readout, however, has not been extensively explored. Reducing the readout field strength can lessen the spin-dephasing effects of an inhomogeneous field, which is a feature of the NuB0 scanner. It also decreases RF transmit power requirements and specific absorption rate (SAR). However, lower operating frequency leads to lower signal due to the nature of Faraday law [2]. In this work, two different readout Larmor frequencies of 1MHz and 2MHz were tested on the non-uniform B0 (NuBo) scanner, and results are compared to show the trade-off between SNR, T2*, and T2 dephasing at the different Larmor frequencies.METHOD
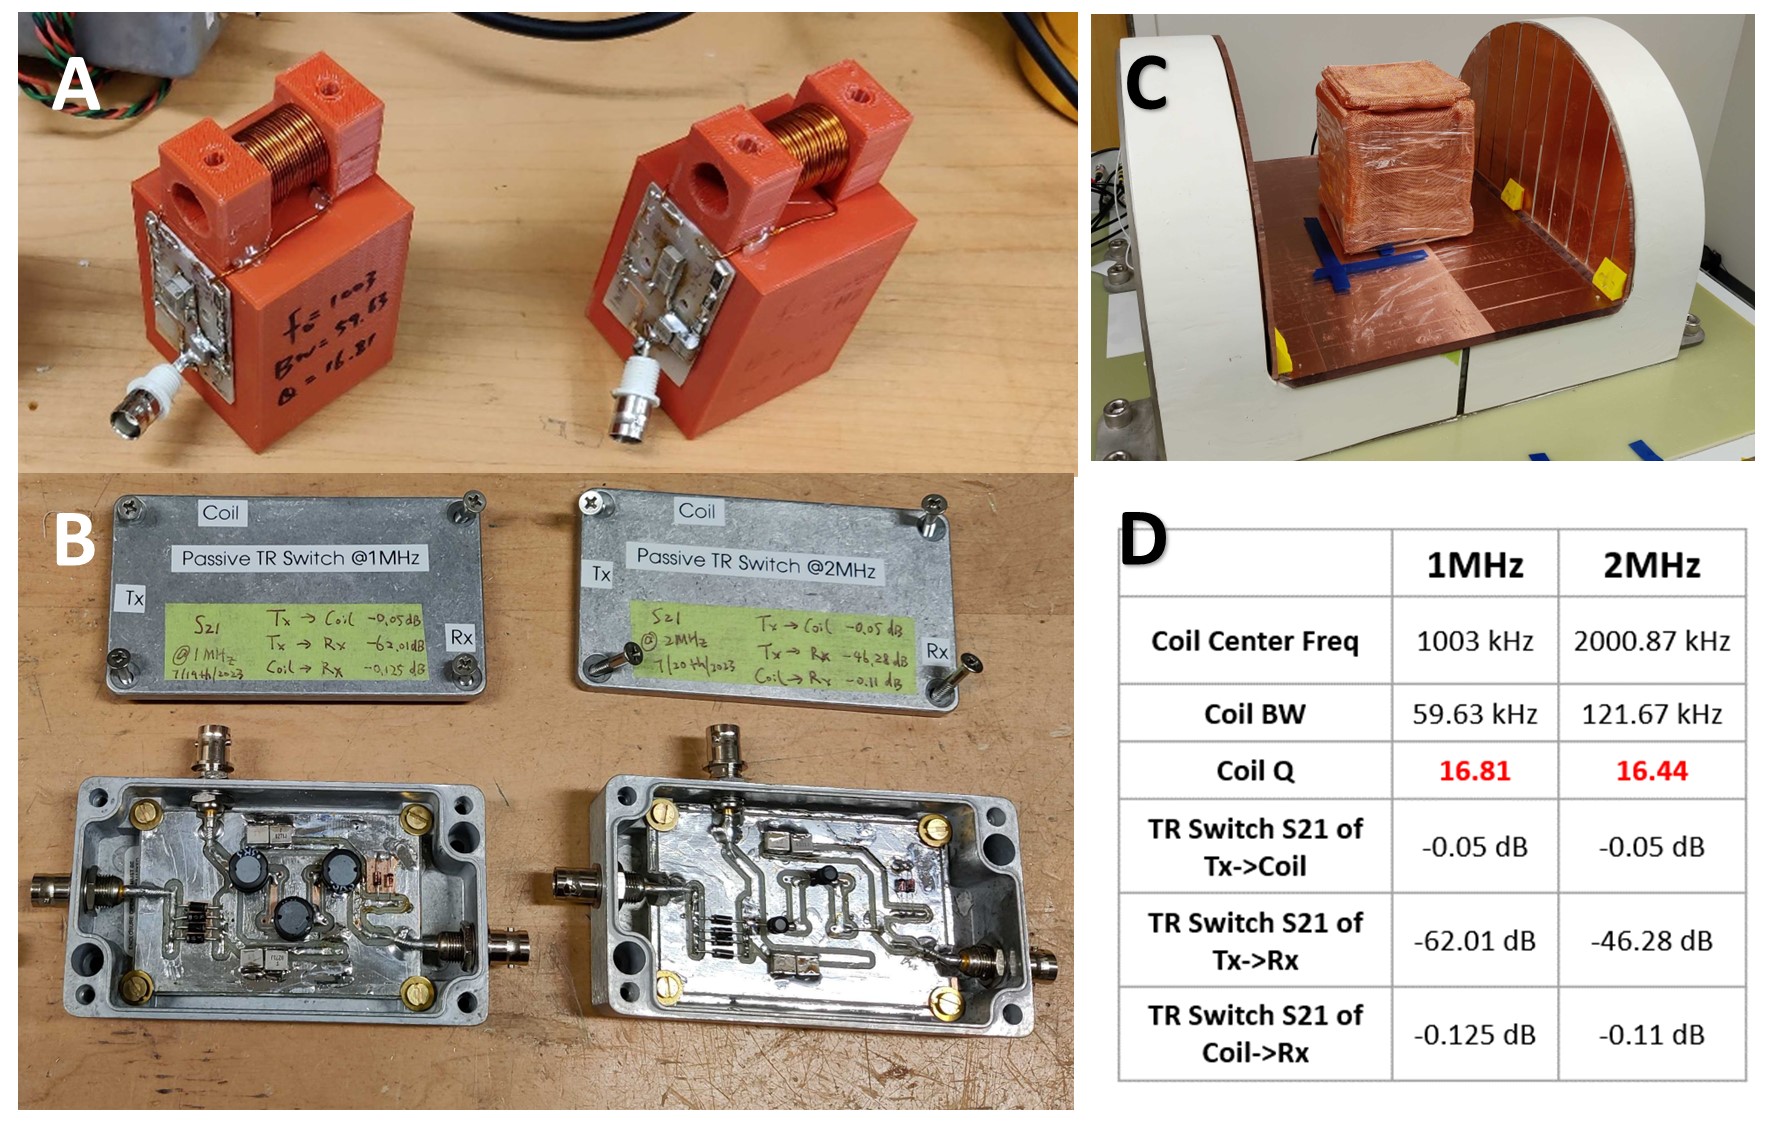
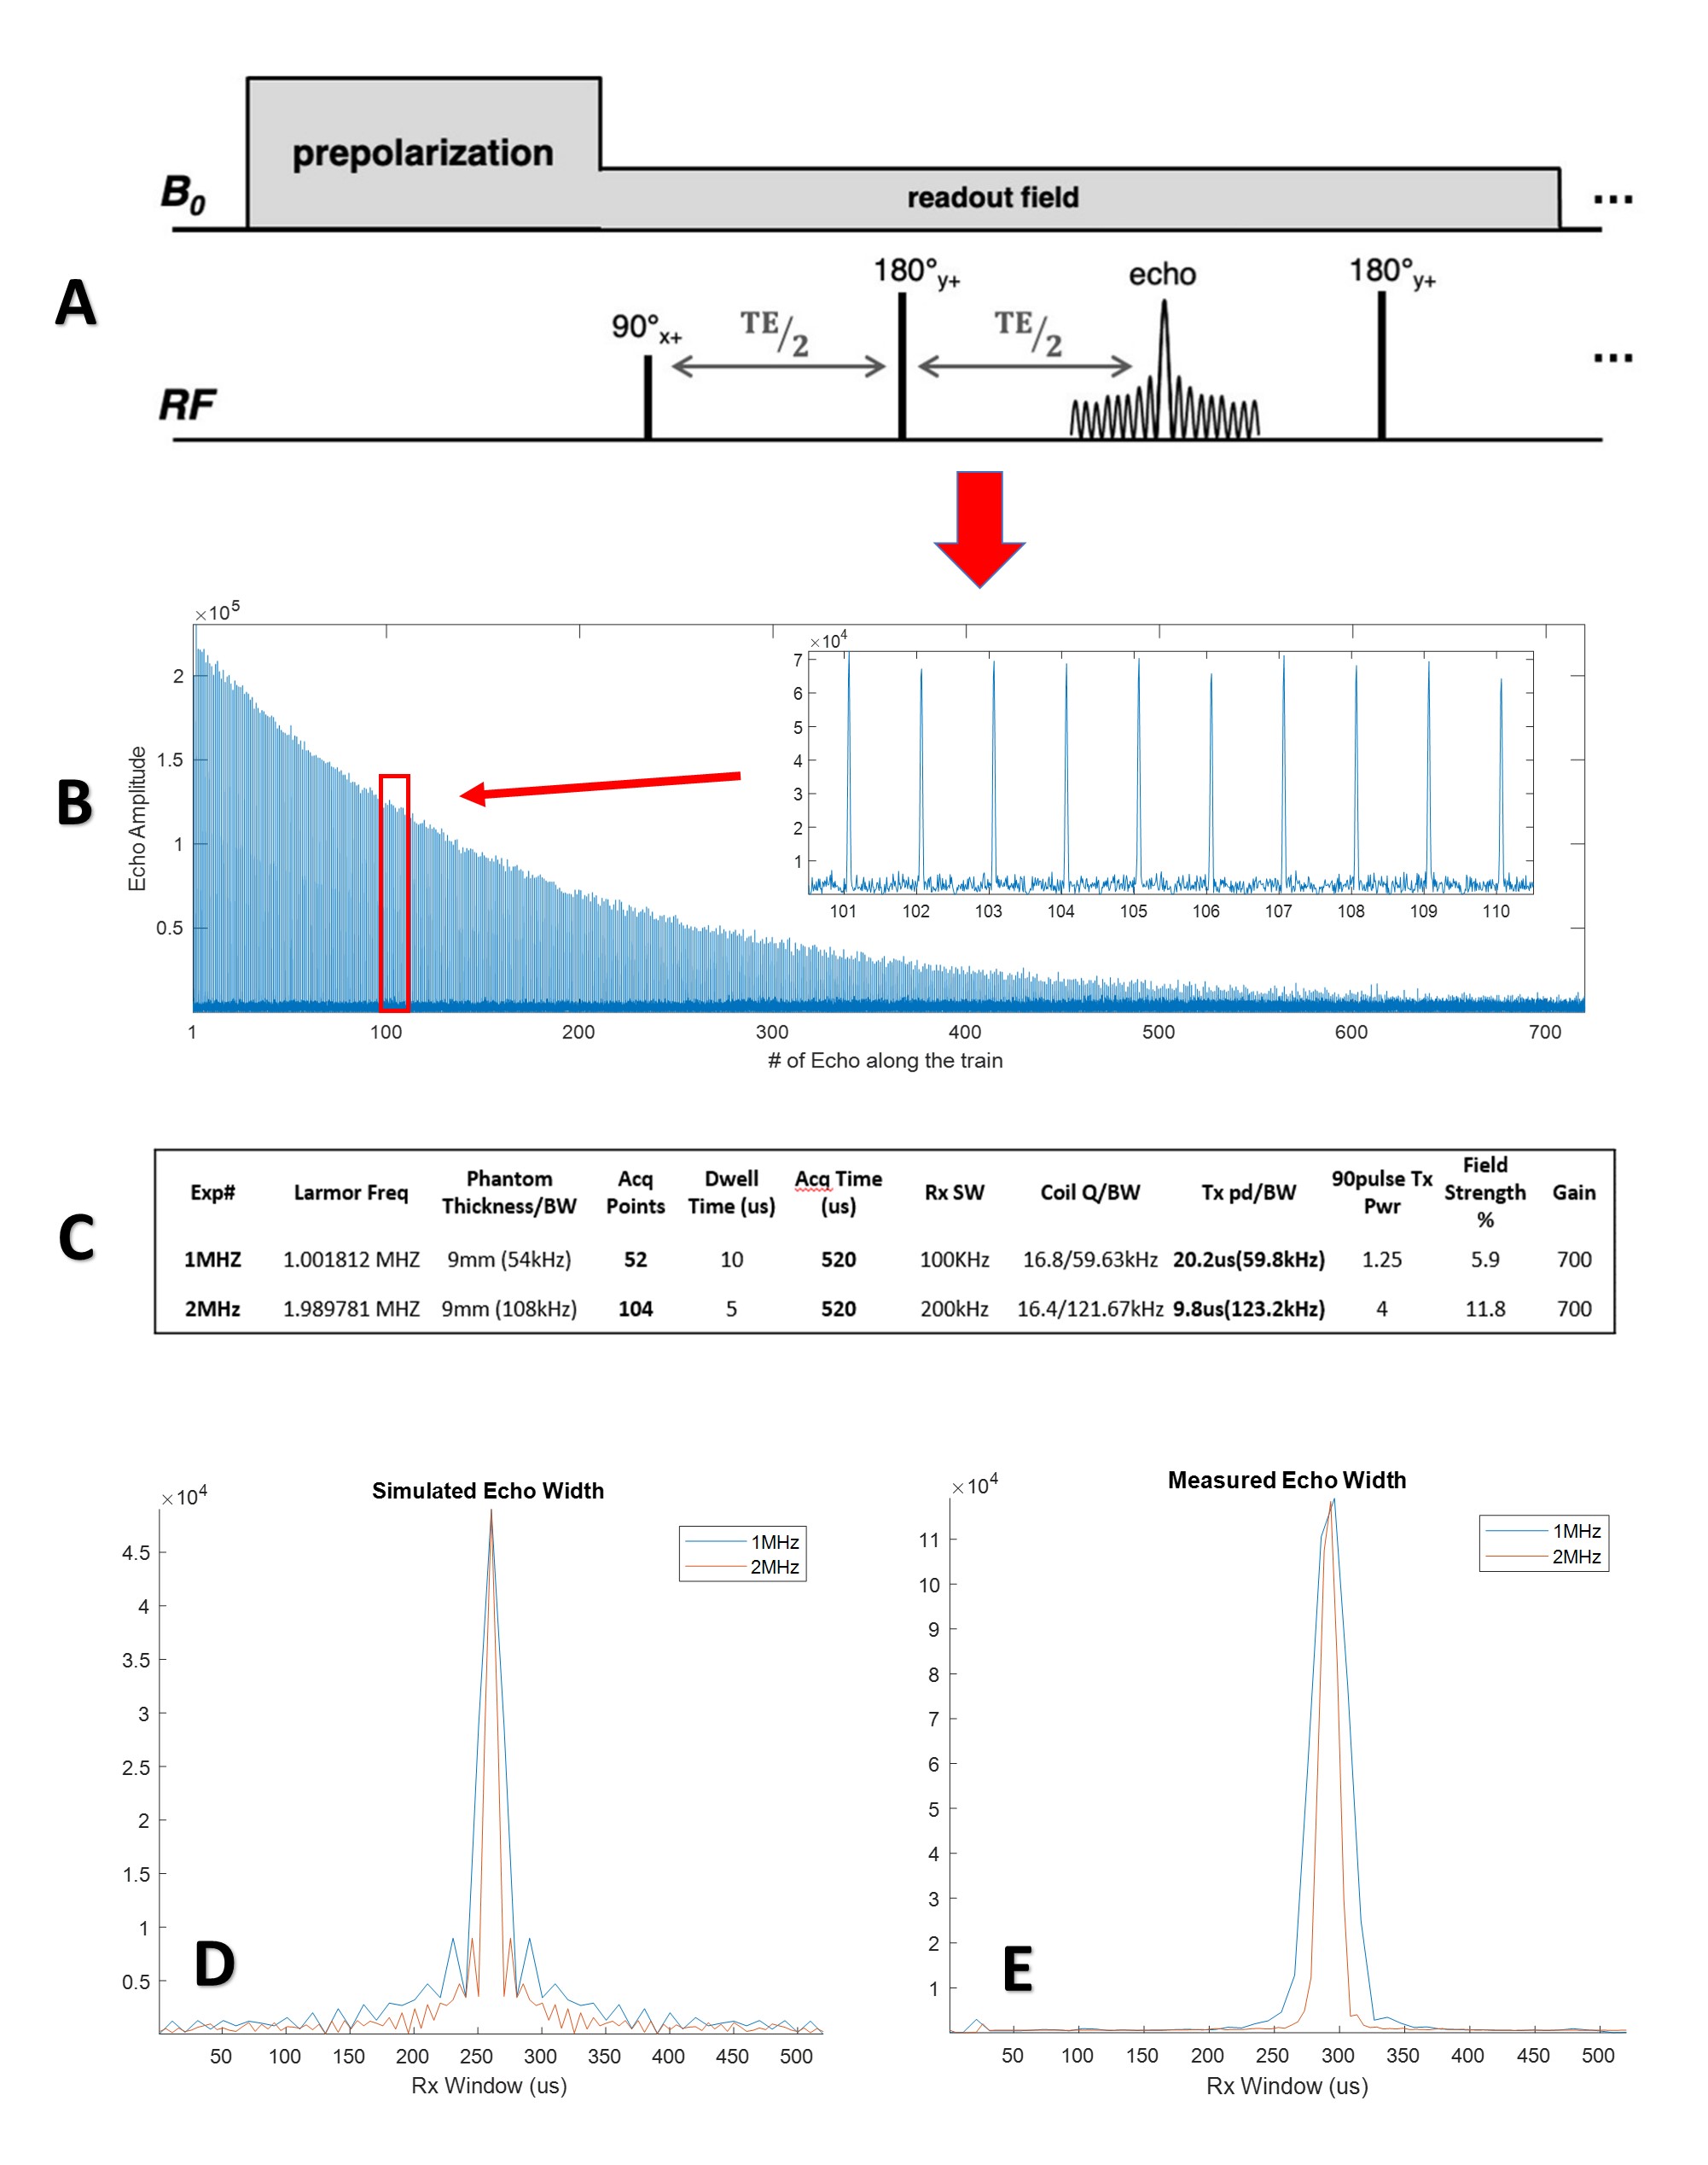
Two solenoid coils (20 turns of 20AWG copper wire, diameter of 18mm) shown in Fig1 A, were matched and tuned at 1MHz and 2MHz, separately. Resistors were applied on these two coils in order to maintain same coil Q. Two passive TR switches shown in Fig1 B, were built at two Larmor frequency to interface with the coil. A simple 9mm diameter tube of tap water is used as the testing phantom. All the experiments were conducted on the non-uniform B0 (NuBo) field cycling scanner and with the help of a house-built faraday cage, shown in Fig1 C. The details of the sequence used in this work is shown in Fig 2. A simple turbo spin echo sequence, with TE-1.5ms, echo train length – 720, TR of 6.08s (5s of prepolarization, and 1.08s of echo train). At the Larmor frequency of 1MHz and 2MHz, the testing phantom is about 54KHz and 108KHz wide with the readout field strength. The receive BW (FOV) at 1MHz and 2MHz were then set to approximately twice that the object in presence of B0, which also provides a slice selection gradient. Simple square Tx pulse were used with Tx BW about 60kHz and 123kHz, approximately identical to the coil BW at the different Larmor frequency. Tx RF power was calibrated at both frequencies to ensure 90/180 degrees flip angles. Long spin echo trains at the two different Larmor frequencies were acquired to compare the SNR, T2* and T2 dephasing.RESULTS
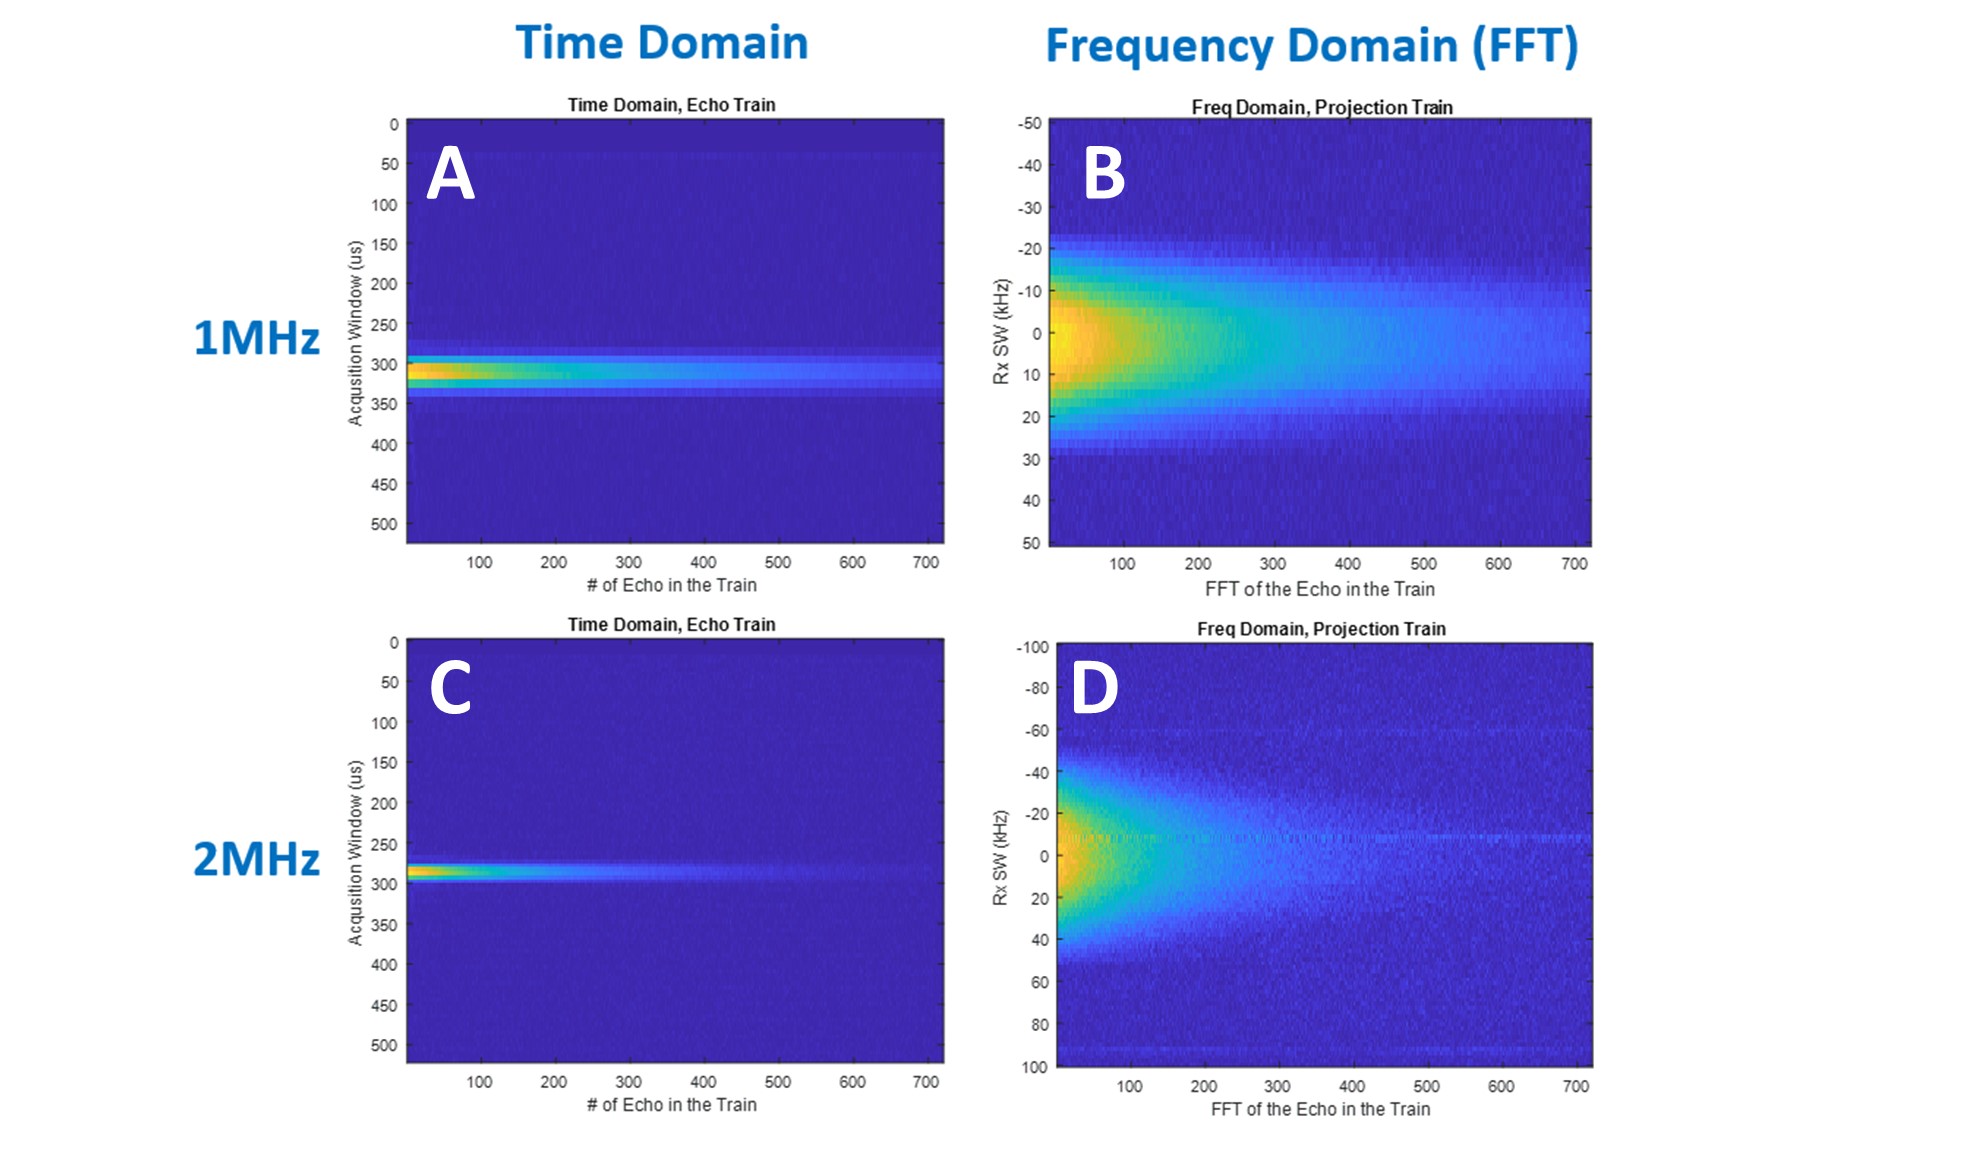
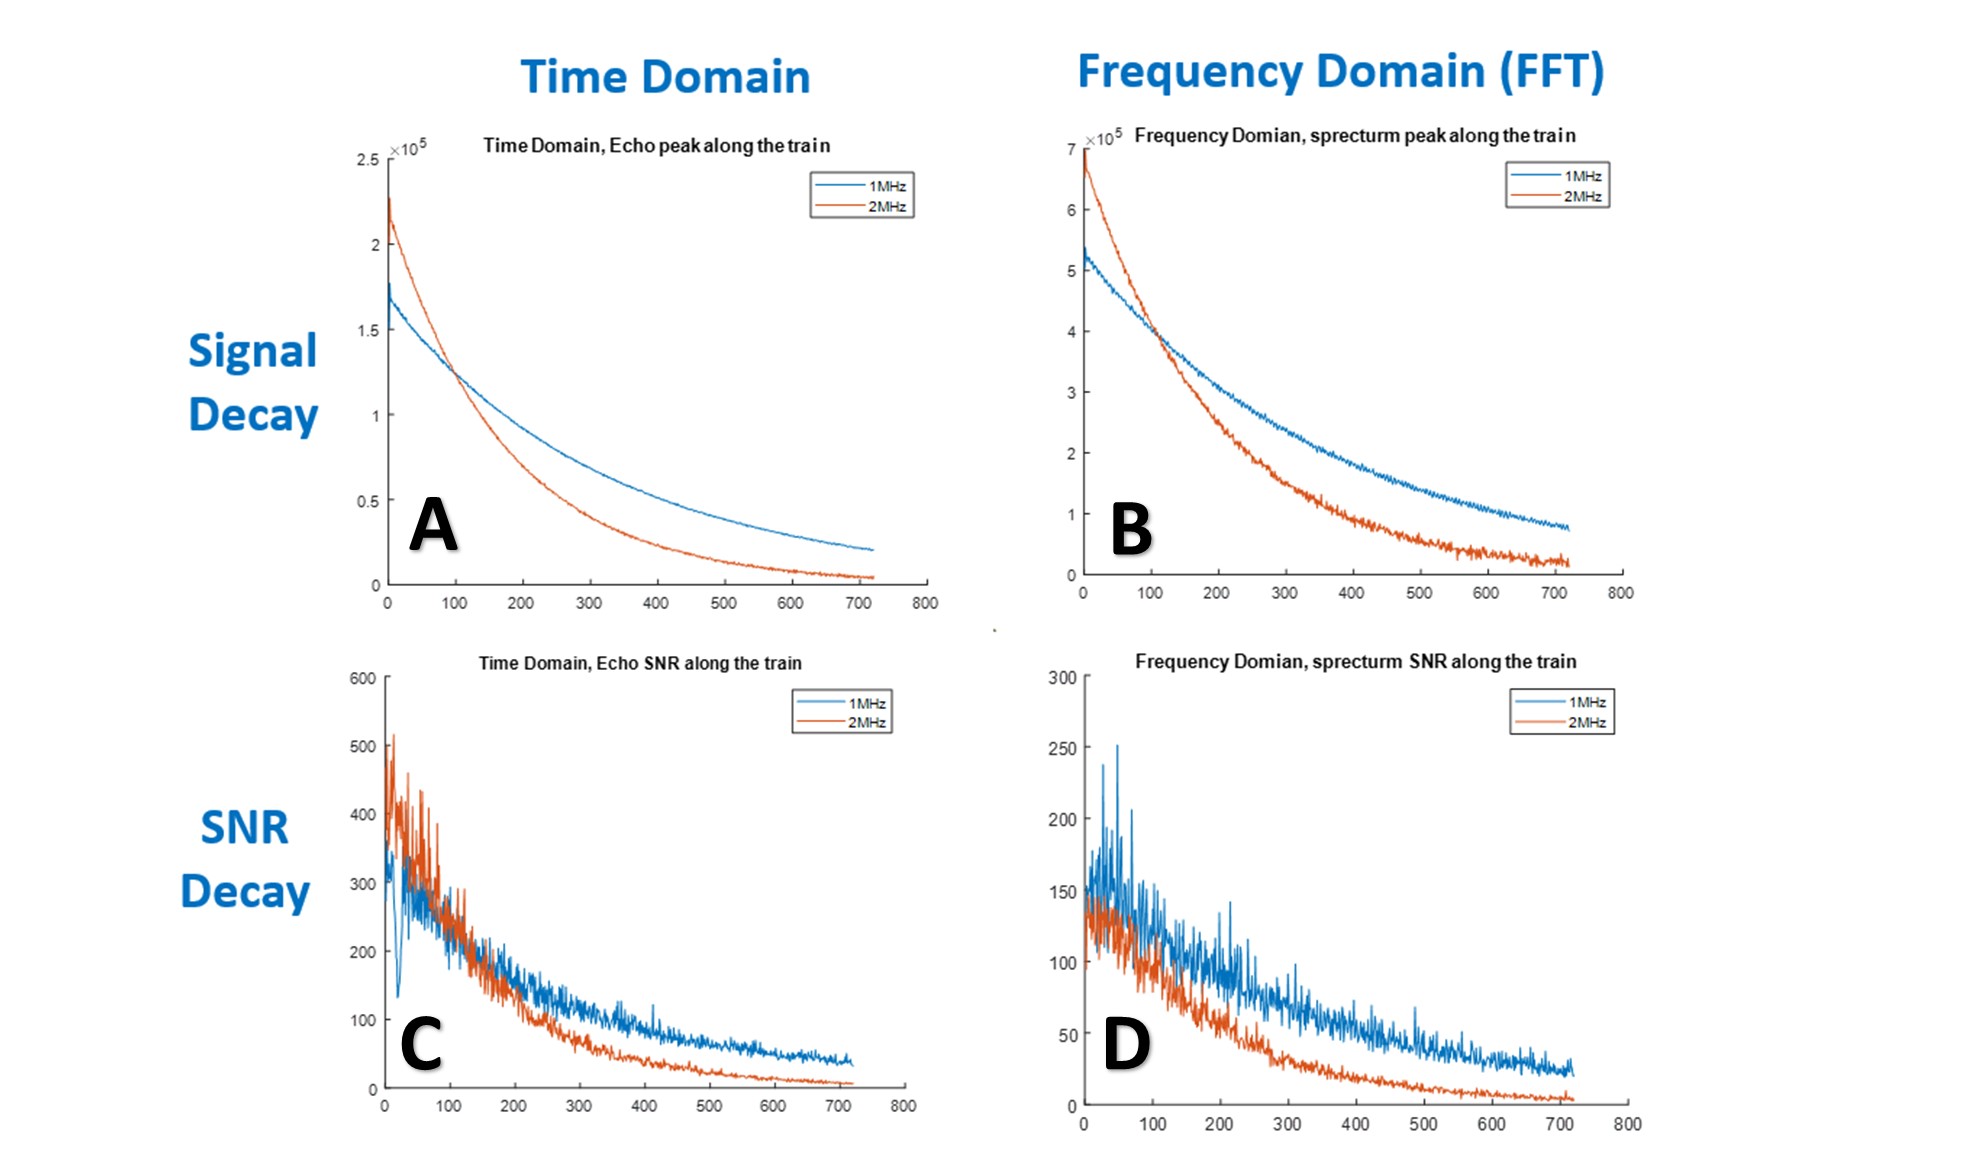
The simulated and measured echo width (reflecting T2*) at both 1MHz and 2MHz are shown in Fig 2 DE. In both simulation and measurement, the echo at lower Larmor frequency of 1MHz is wider than at the higher frequency 2MHz’s, indicating a lower impact of slice-homogeneity and thus less T2* decay. The acquired echo trains in time domain, and the FFT of the echo train (in frequency domain, projection train) were both shown in Fig 3. With the controlled acquisition parameters, data acquired at 2MHz shows faster decay than at 1MHz, potentially because of the heavier through-slice dephasing. The echo width acquired at 2MHz, similarly, is narrower than at 1MHz. The amplitude decay of the echo peak along the echo train, and the amplitude decay of the spectrum peak along the projection train were shown in Fig 4. Both the echo and spectrum signal amplitude acquired at 2MHz start higher at the beginning of the echo train, but also decay much faster than at 1MHz. Vice versa, the acquired signal of 1MHz give slightly lower signal at the beginning but maintain longer than the 2MHz data, potentially because of the relatively less field inhomogeneity. The time domain SNR follows the trend of signal decay, showing stronger SNR for 2MHz in the beginning but faster decay. However, the frequency domain SNR demonstrates that the lower Larmor frequency data at 1MHz provided superior performance across the entire echo train.DISCUSSION AND CONCLUSIONS
In this work, two readout Larmor frequencies, 1MHz and 2MHz, were tested and compared on the NuBo scanner. The lower frequency data shows less T2 decay affect with a longer echo train, and the lower gradient does yield a wider echo, as expected. The higher Larmor frequency data shows a stronger signal amplitude in the beginning of the echo train, but T2* and T2 are shorter. The spectrum SNR curve suggests that the lower Larmor frequency gives an overall better SNR performance, potentially due to the narrower required Rx bandwidth at the lower field strength. Future work will acquire more data curves at other Larmor frequencies.Acknowledgements
No acknowledgement found.References
1. Selvaganesan K, Wan Y, Ha Y, et al. Magnetic resonance imaging using a nonuniform Bo (NuBo) field-cycling magnet. PLoS One. 2023;18(6):e0287344.
2. Marques JP, Simonis FFJ, Webb AG. Low-field MRI: An MR physics perspective. J Magn Reson Imaging. 2019;49(6):1528-1542.8-1542.
Figures