2850
Longitudinal Relaxivities of MRI Contrast Agents on an Ultra Low Field, Point-of-Care MRI System1Hyperfine, Inc, Guilford, CT, United States, 2National Institute of Neurological Disorders and Stroke, National Institutes of Health, Bethesda, MD, United States
Synopsis
Keywords: Low-Field MRI, Contrast Agent, Low-Field MRI
Motivation: Point-of-care MRI systems have the potential to increase access to imaging. Contrast agents could enhance tissue differentiation at the ultra-low fields of these devices.
Goal(s): To characterize the performance of Gadolinium contrast agents on an FDA cleared, point-of-care MRI system to inform sequence optimization for in vivo imaging.
Approach: Longitudinal relaxivities of six FDA approved gadolinium contrast agents were characterized at 64 mT on a point-of-care MRI device and used to optimize T1 imaging of white matter and CSF.
Results: Longitudinal relaxivities increased at 64 mT compared to their 3 T values. Simulations showed enhancement could be well visualized within feasible sequence parameters.
Impact: Point-of-care MRI systems have the potential to impact patient care by increasing access to imaging. This work explores the feasibility of contrast-enhanced imaging with FDA-approved agents at ultra-low field on a point-of-care MRI.
Introduction
Point-of-care MRI systems have the potential to impact patient care by increasing access to imaging, particularly for patients who are otherwise contraindicated for MRI [1]. Use of contrast agents with MRI allows clinicians to detect blood-brain barrier disruption associated with pathologies such as tumors, stroke, and inflammation [2]. With the faster longitudinal relaxation at low field [3], it can be particularly challenging to obtain sufficient contrast between tissues. Contrast agents could enhance tissue differentiation; however the behavior of commonly used agents has not been explored at the ultra-low fields (ULF) used in point-of-care MRI systems. This work seeks to characterize the performance of FDA approved contrast agents on an FDA cleared, point-of-care MRI system to inform imaging optimization for in vivo contrast-enhanced imaging at ULF.Methods
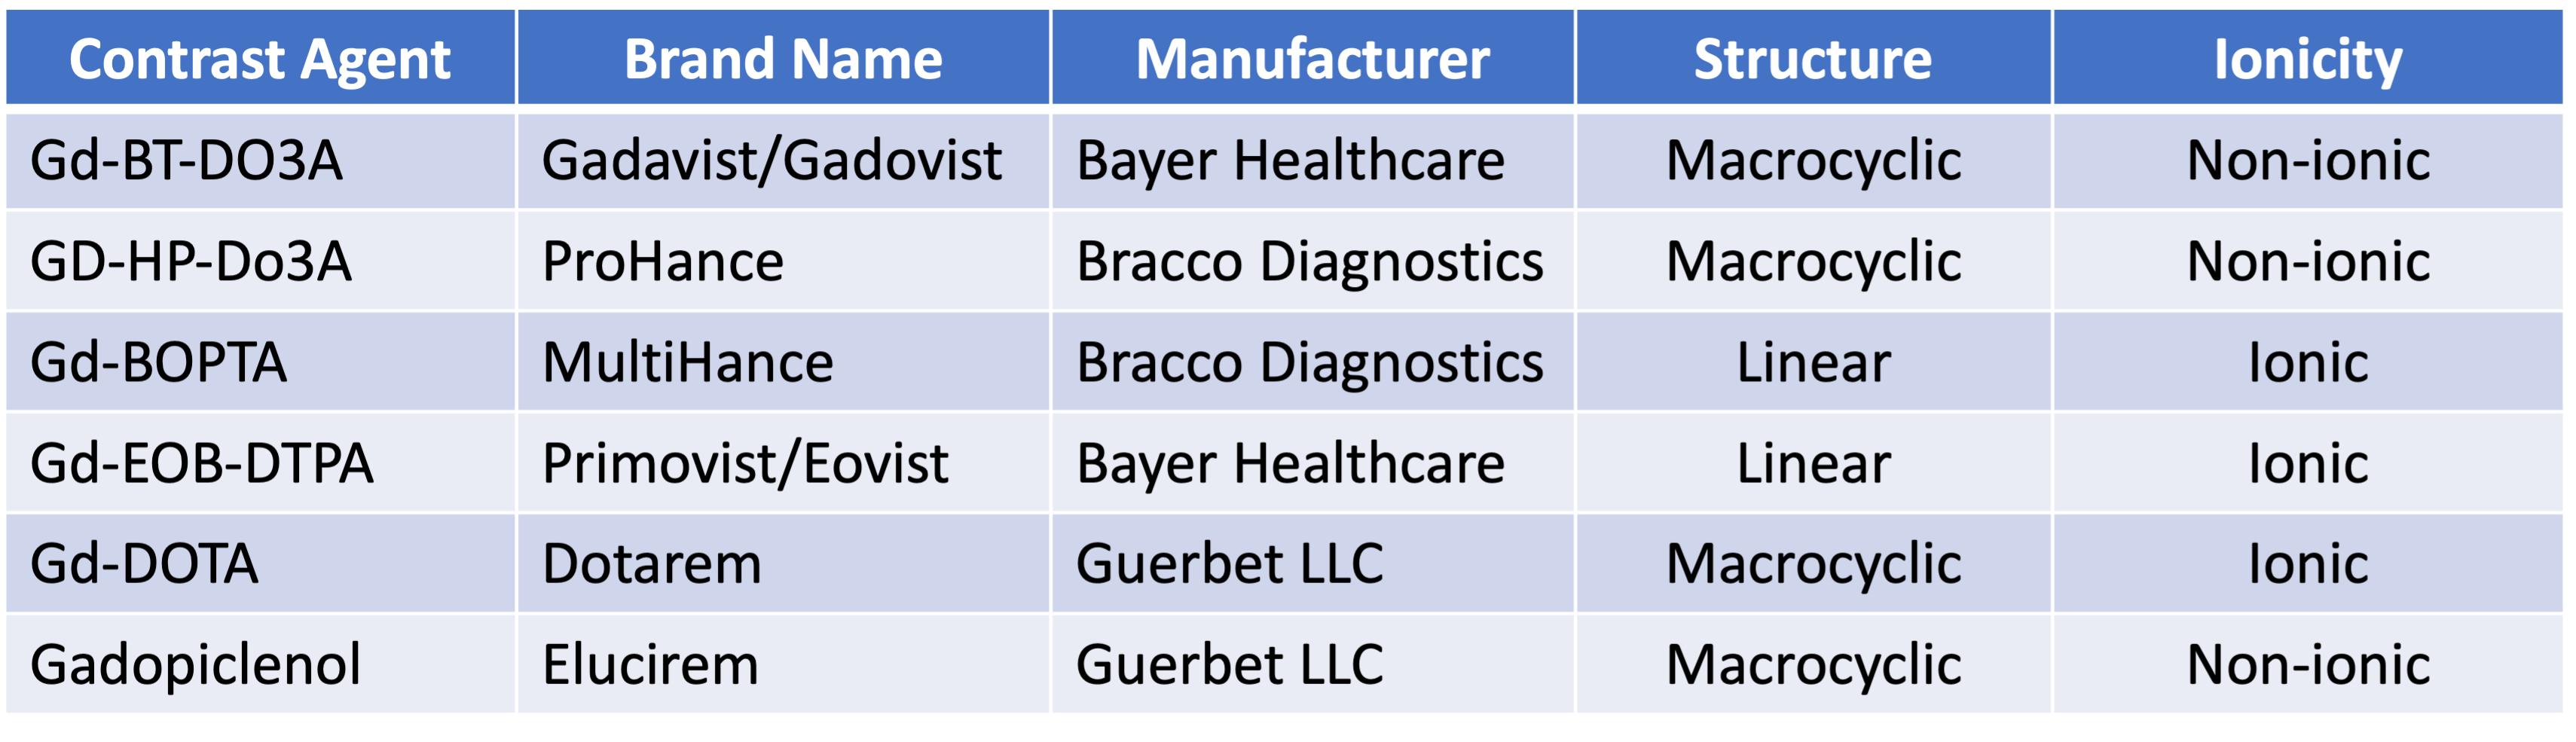
Phantom Preparation:Six FDA approved, gadolinium-based contrast agents were obtained for use in this study. The agents were chosen to span the range of agent characteristics and potential relaxivities: non-ionic to ionic, linear to macrocyclic. Details of the agents chosen can be seen in Table 1. Each agent was diluted in PBS to create titrations with concentrations mimicking the range expected in vivo. Three sets of titrations were created per agent to allow repeat measurements.
Relaxivity Measurement:
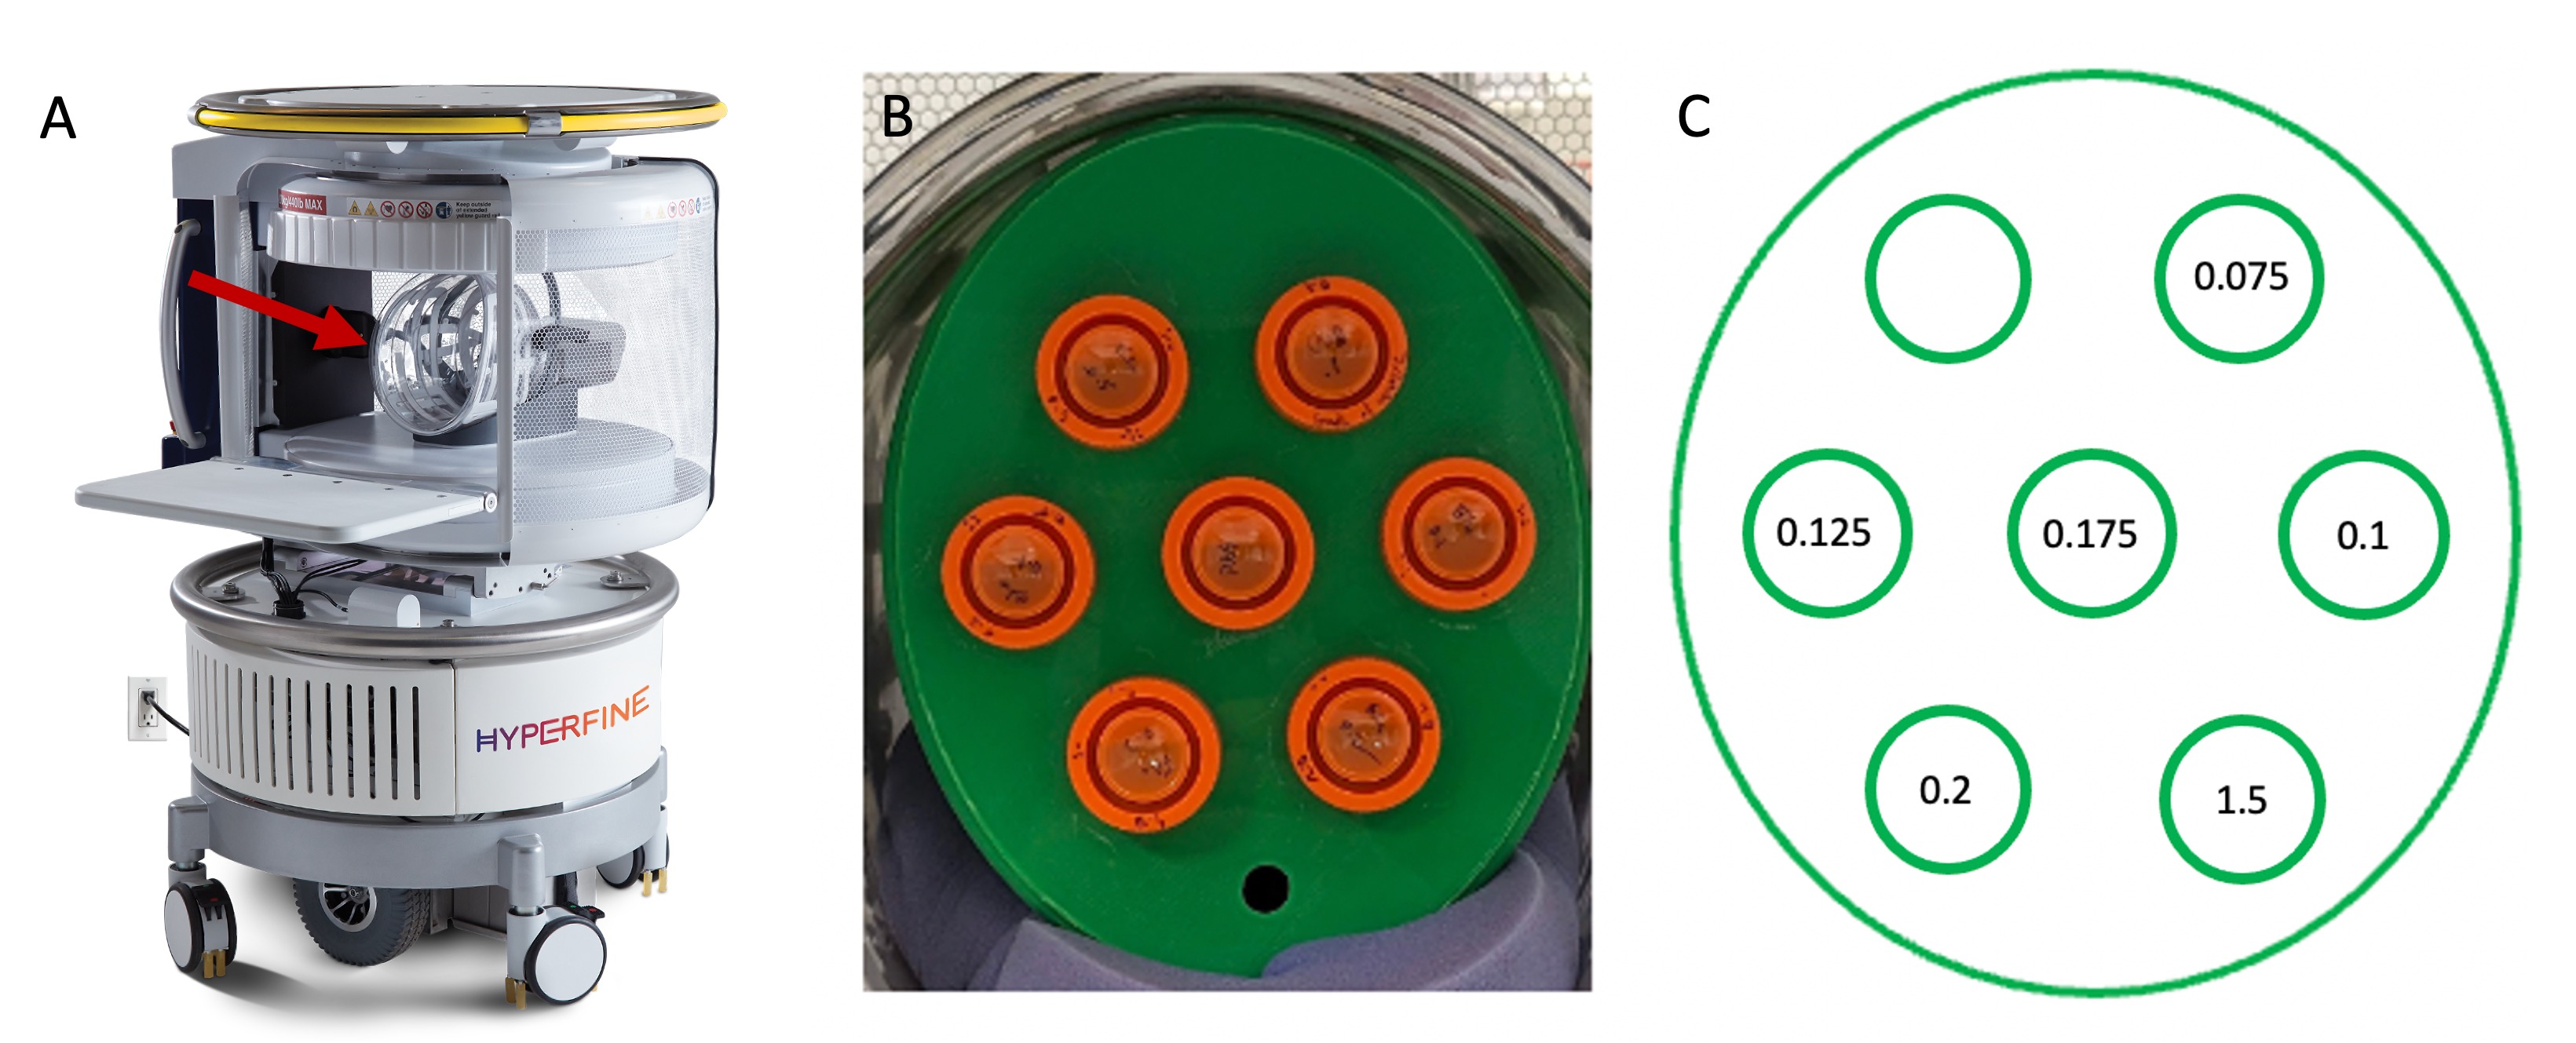
Imaging was performed on an FDA cleared 64 mT point-of-care MRI system (Swoop, Hyperfine, Inc, mk 1.6, 8.5 and 8.6 Software). Each set of titrations was arranged in a Tx/Rx head coil using a 3D printed phantom holder and imaged at room temperature (Figure 1). Inversion recovery T1 mapping was performed with an IR-TSE sequence (TR = 4 s, TE = 5.9 ms, TI = [100, 200, 250, 300, 350, 400, 450, 500, 550, 600, 800] ms, voxels = 1.56 x 1.56 x 5.0 mm3). Each inversion time took 15 min 36 seconds with a 20 second wait period to minimize thermal drift. T1 maps were obtained by fitting the signal intensity from each vial across inversion times to the inversion recovery signal equation using non-linear least squares curve fit [4,5]. Maps were obtained using the average value from each value and a voxel-wise fit was performed for quality assurance. The derived relaxivity was plotted against vial concentration to obtain a measurement for each agent.
Sequence Optimization:
The estimated relaxivity for each agent was used to simulate white matter and CSF signal at physiologically relevant concentrations of each agent using the equation: 1/T1e=1/T1 + r1[Gd3+] where r1 is the CA relaxivity and [Gd3+] is the concentration of the agent. T1e was used with the IR-TSE signal equation at different inversion times. TR was held constant and chosen to mimic protocols used on the system clinically (White Matter TR = 1500 ms, CSF TR = 4000 ms).
Results
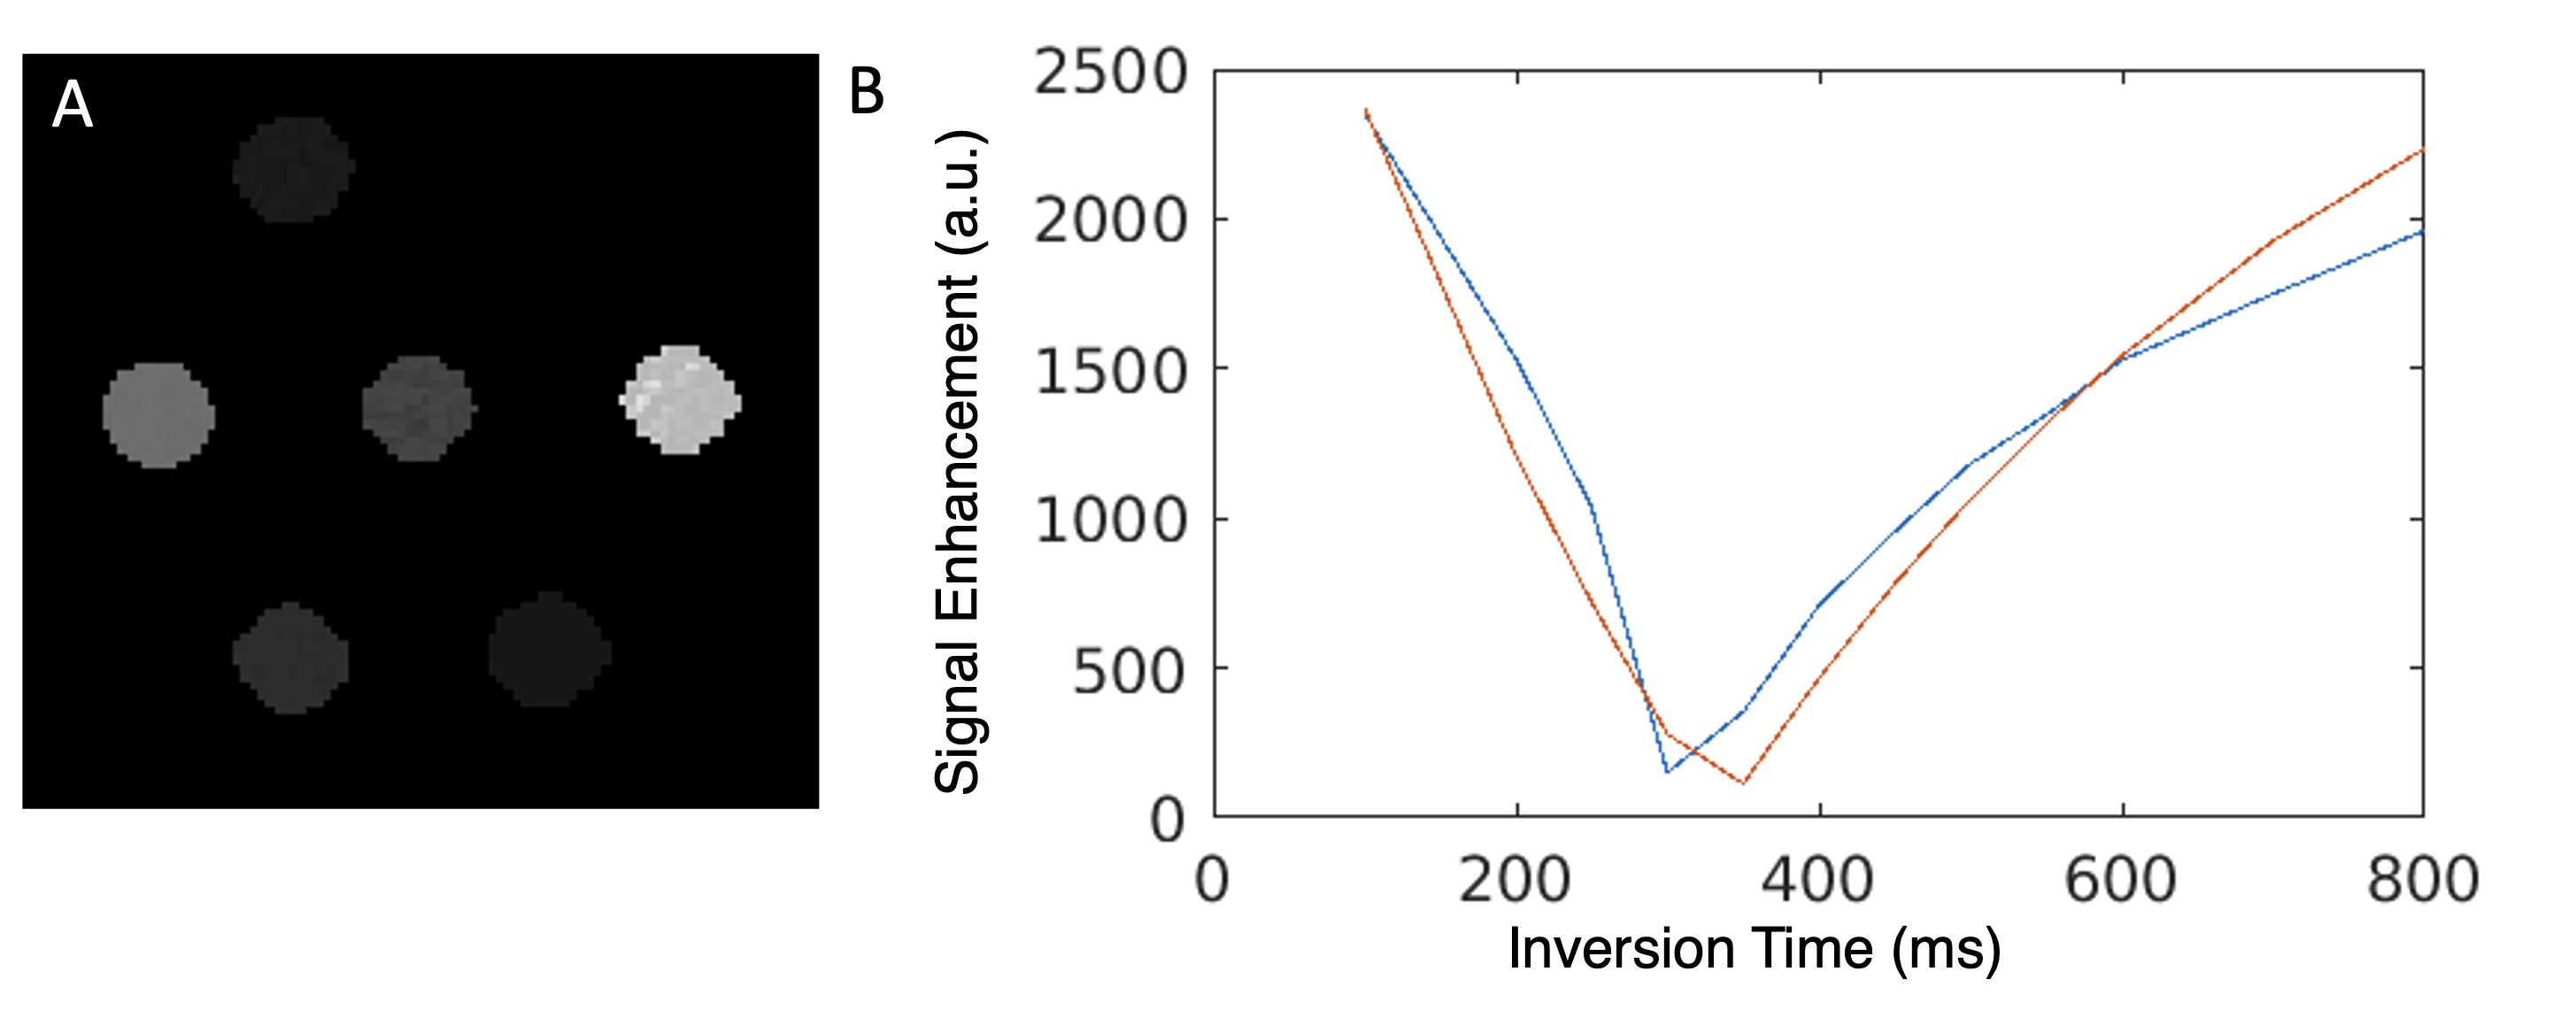
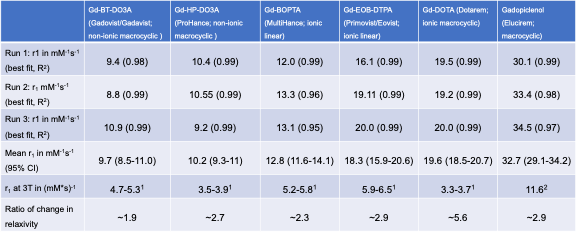
Relaxivity Measurement:A representative T1 map and signal decay with T1 fit for Gadovist can be seen in Figure 2. The relaxivities measured from each agent across each titration can be seen in Table 2 compared to 3 T relaxivities obtained from literature [6,7]. Gadavist and ProHance had the lowest relaxivities at ULF of 9.7 mM-1s-1 and 10.2 mM-1s-1, followed by MultiHance at 12.8 mM-1s-1, Eovist at 18.3 mM-1s-1, and Dotarem at 19.6 mM-1s-1. Elucirem had the highest relaxivity at 32.7 mM-1s-1. All contrast agents showed an increase of relaxivity at 64 mT compared to 3 T.
Sequence Optimization:
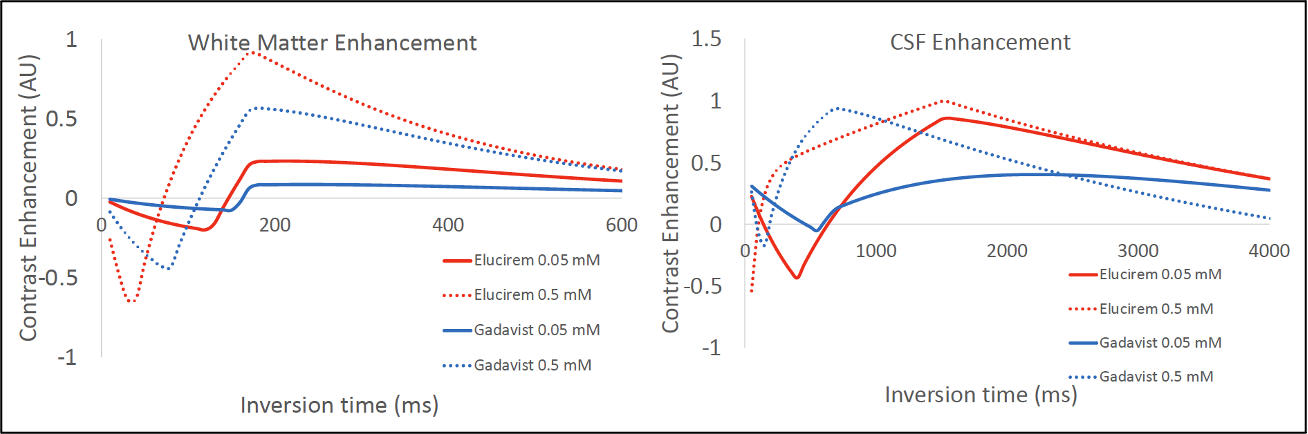
Simulated contrast-enhanced signal in white matter and CSF across inversion times for Gadovist and Elucerim can be seen in Figure 3. In white matter an inversion time of 170 ms was projected to give peak enhancement with both agents. In this scenario Elucerim was projected to give 3.5x more enhancement than Gadovist. In CSF the peak enhancement was projected to be between 1500 ms and 2800 ms depending on the relaxivity of the contrast agent used.
Discussion and Conclusions
This work explores feasibility of using FDA approved contrast agents at ULF with a point-of-care MRI device. The measured relaxivities of all contrast agents were higher at 64 mT when compared to 3 T with the relative increase for each contrast agent being dependent on molecular structure. The simulation results imply that optimal enhancement can be visualized in the brain within feasible pulse sequence parameters. The increased enhancement offered by higher relaxivity agents could be particularly beneficial in increasing pathology conspicuity in lower SNR or lower resolution scenarios at ULF [8,9]. Further studies are needed to validate these findings in vivo at physiologically relevant temperatures, and to fully explore the relationship between contrast agent relativity and clinical utility.Acknowledgements
This study was made possible by the Intramural Research Program of NINDS and a Research Collaboration Agreement between NINDS and Hyperfine, Inc. The Elucerim used in the study was provided by Guerbet. We acknowledge the aid of Daniel S. Reich and Smita Sharma of NINDS; Ryan C. Nieuwendaal and Katy Keenan of NIST; and staff of the NIH NMR Center.References
[1] Arnold et al. JMRI 2023
[2] Golec et al. Neurologia i Neurochirurgia Polska 2020
[3] Jordanova et al. MAGMA 2023
[4] Li et al. MRM 2010
[5] Nitz et al Eur Radiol 1999
[6] Rohrer et al. Invest Radiol 2005
[7] Robic et al. Invest Radiol 2019
[8] Koenig et al. MRM 1984
[9] Arnold et al. Neuroimage Clin 2022
Figures