2845
An Optimized Multi-Component Imaging Method on a Homebuilt 0.5 T MRI System: Combing Intra- and Inter-Voxel Constraints1Southeast University, NanJing, China
Synopsis
Keywords: Data Processing, Low-Field MRI
Motivation: Applying the component imaging method to low-field MRI systems will face a main problem: low-SNR image data.
Goal(s): An optimized inversion method is proposed, aiming to give better results for image data with low SNR.
Approach: This paper proposes an optimized inversion method with the formula of the optimization problem combining intra- and inter-voxel constraints.
Results: The optimized method shows a better convergence rate avoiding the fragmentation of component images and the appearance of pseudo peaks in the spectrum.
Impact: This multi-component imaging approach can provide sub-voxel characterization and be applied to numerous applications of popular portable low-field MRI systems.
INTRODUCTION
Assuming negligible intercompartmental exchange, it is generally considered that the NMR relaxation or diffusion signal observed in the complex sample is the sum of multiple exponential decay curves, which indicates that the sample has multiple relaxation and diffusion components. How to obtain the amount of these components is always a multi-exponential estimation problem. Component imaging methods in 3 T MRI systems have been studied in some research [1]. The motivation of our work is to enable the component imaging method to be applied to low-field MRI systems. Low-field MRI systems have become popular, but applying the component imaging method to low-field MRI systems will face a main problem: low-SNR image data. The inversion method should be optimized to better deal with the low-SNR image data. The existing inversion methods can be divided into two types: the regularization of the spectrum from each voxel [2], [3], [4], and spatial regularization [5], [6], [7]. Faced with low-SNR image data, the first type of inversion method, although it has a fast convergence rate, will fragment the images of components. The second type of inversion method, although it can avoid the fragmentation of the component images, can produce pseudo peaks in the spectrum. In this paper, an optimized inversion method is proposed, aiming to give better results for image data with low SNR.METHODS
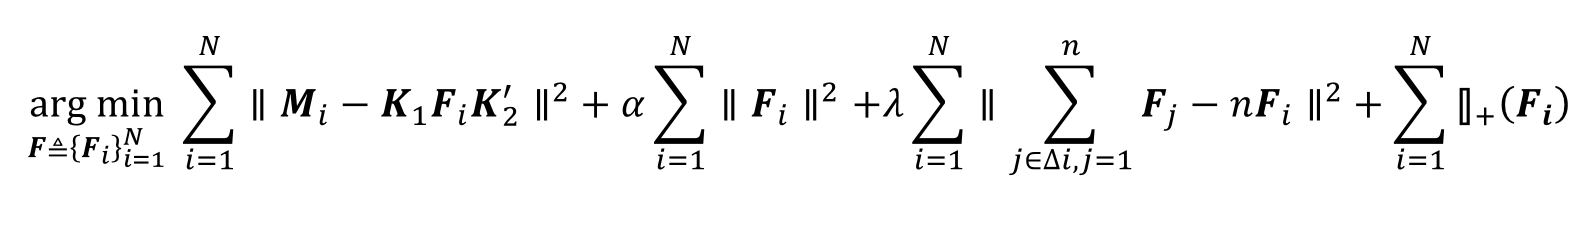
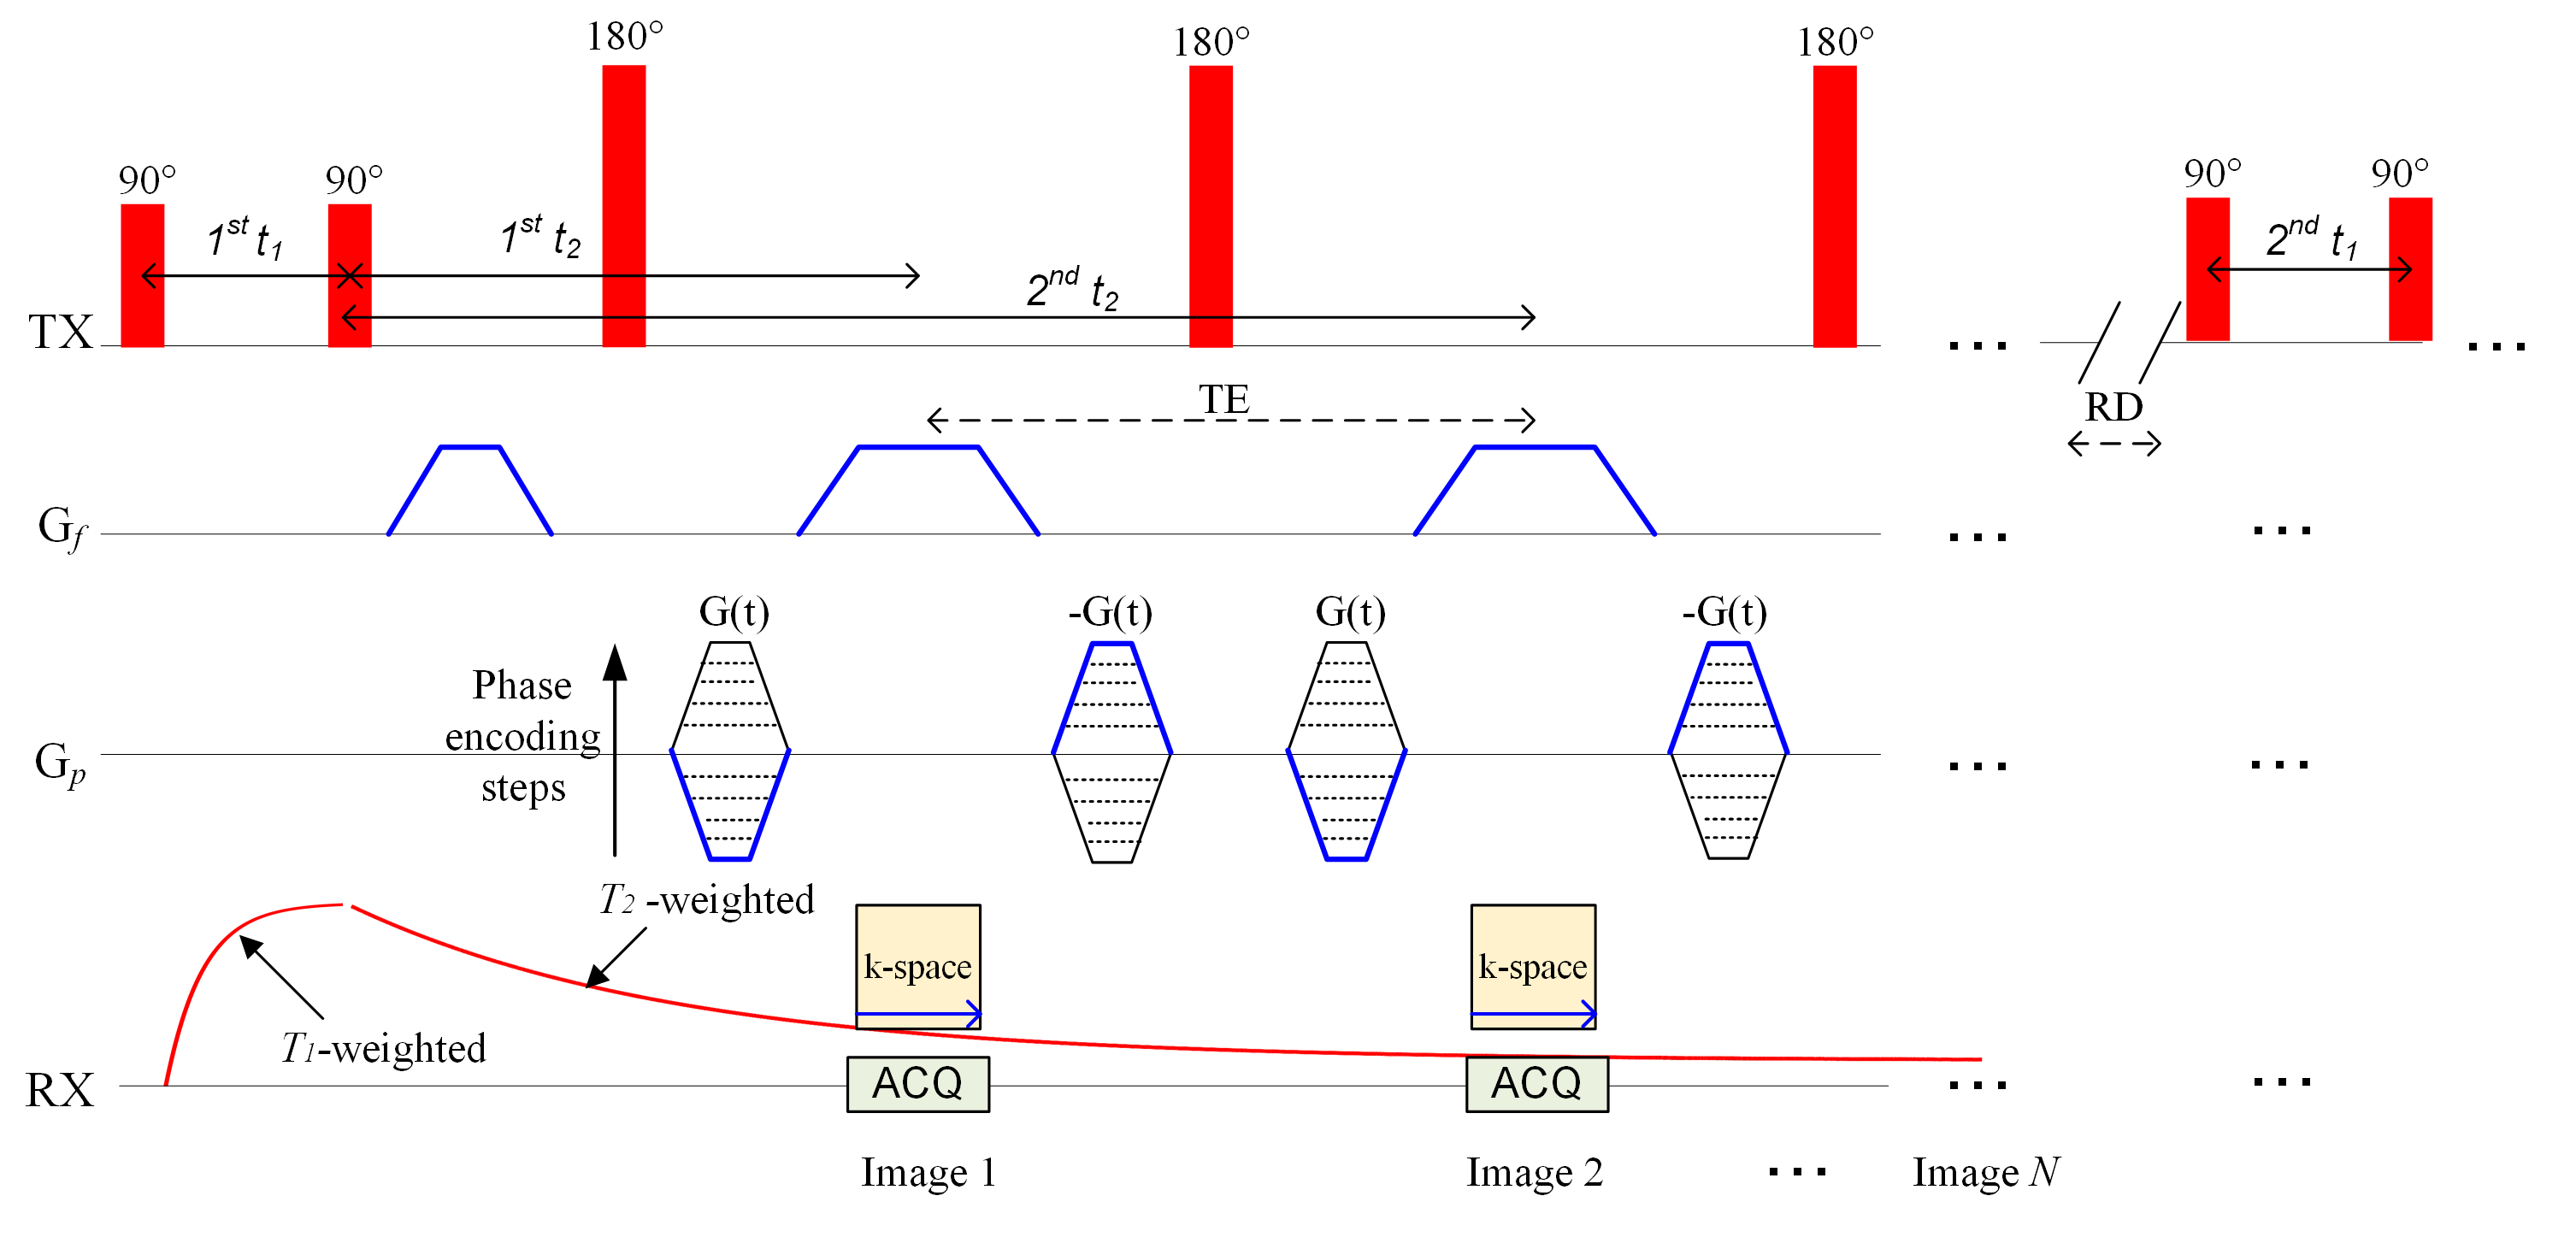
The formula of the optimization problem combining intra- (zeroth-order regularization) and inter-voxel (spatial regularization) constraints is shown in Fig. 1. This idea is motivated by the simultaneous utilization of the regularization within each voxel and the spatial regularization across the voxels. It can ensure the desired continuity of the component distribution both within each voxel and across voxels, aiming to further reduce the ill condition in the estimation process and avoid the fragmentation of component images and the appearance of pseudo peaks in the spectrum. To solve the optimization problem, we propose an efficient algorithm based on the alternating direction method of multipliers (ADMM) [8] and a method [9] to transform the optimization problem with the nonnegativity constraints into the unconstrained. MRI experiments were carried out in a homebuilt 0.5 T MRI system equipped with a permanent magnet. A T1-T2 MRI data acquisition sequence to obtain 2D contrast-encoded MRI data for this MRI system is shown in Fig. 2.RESULTS & DISCUSSION
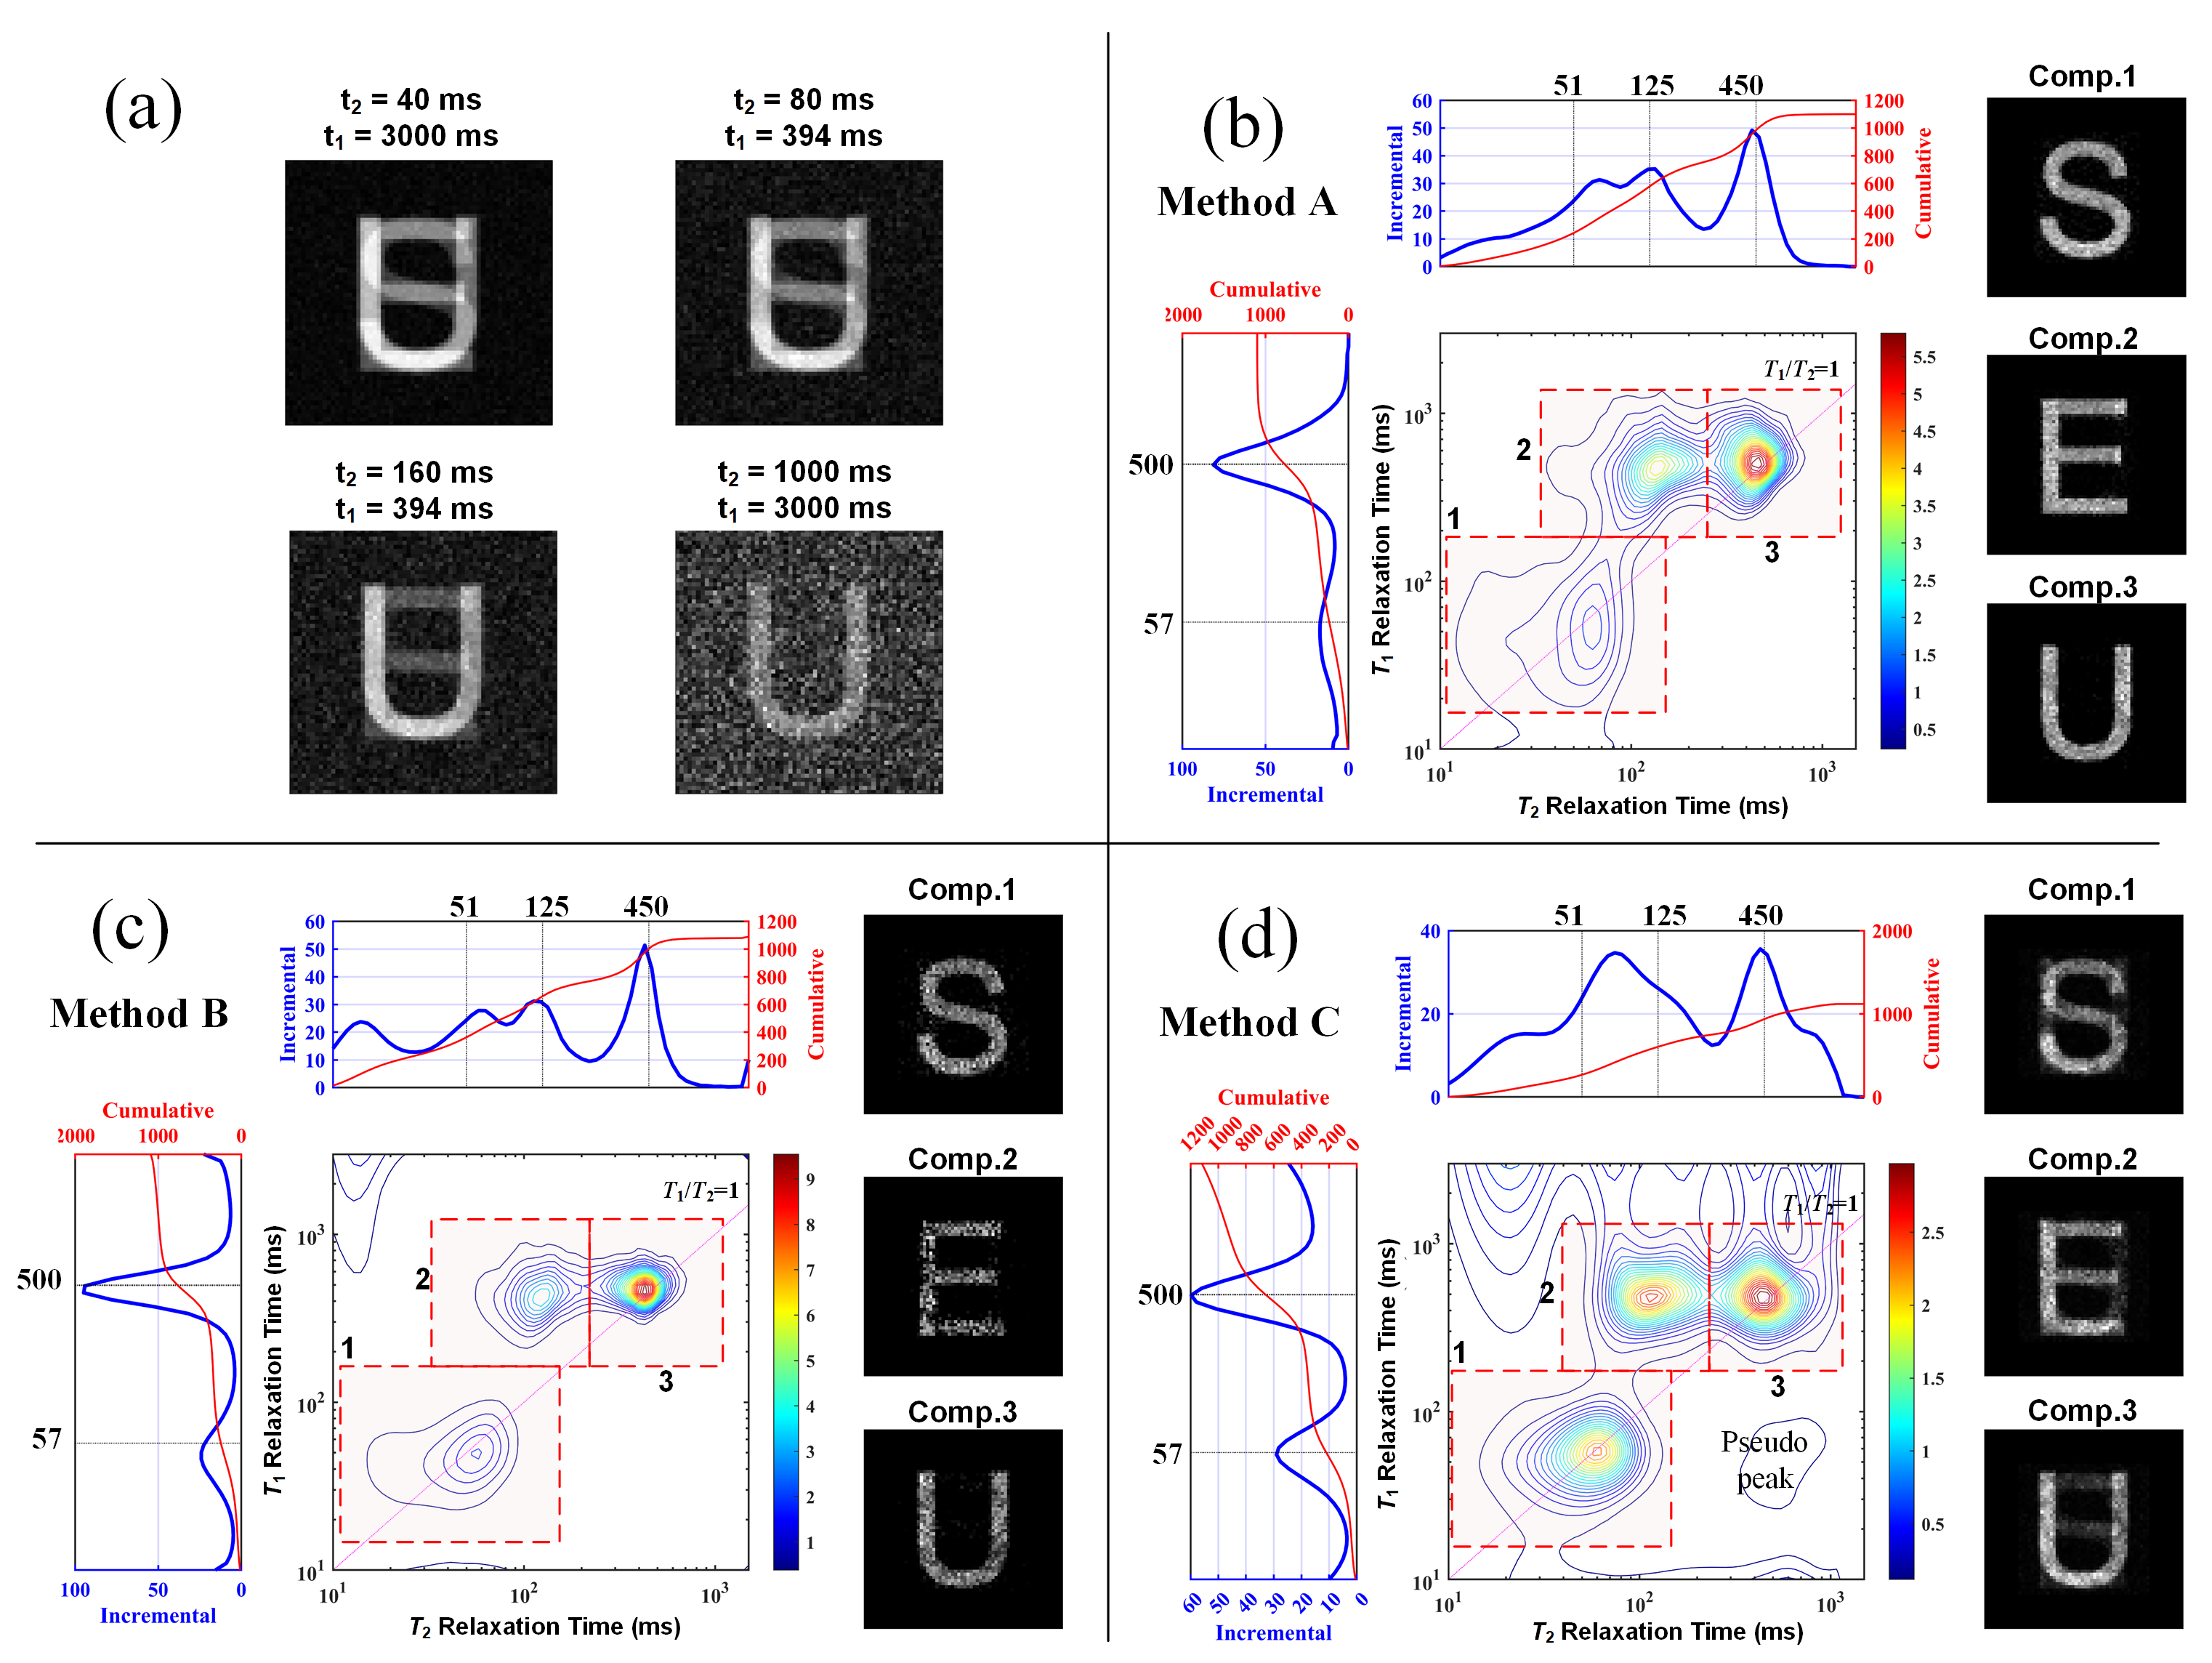
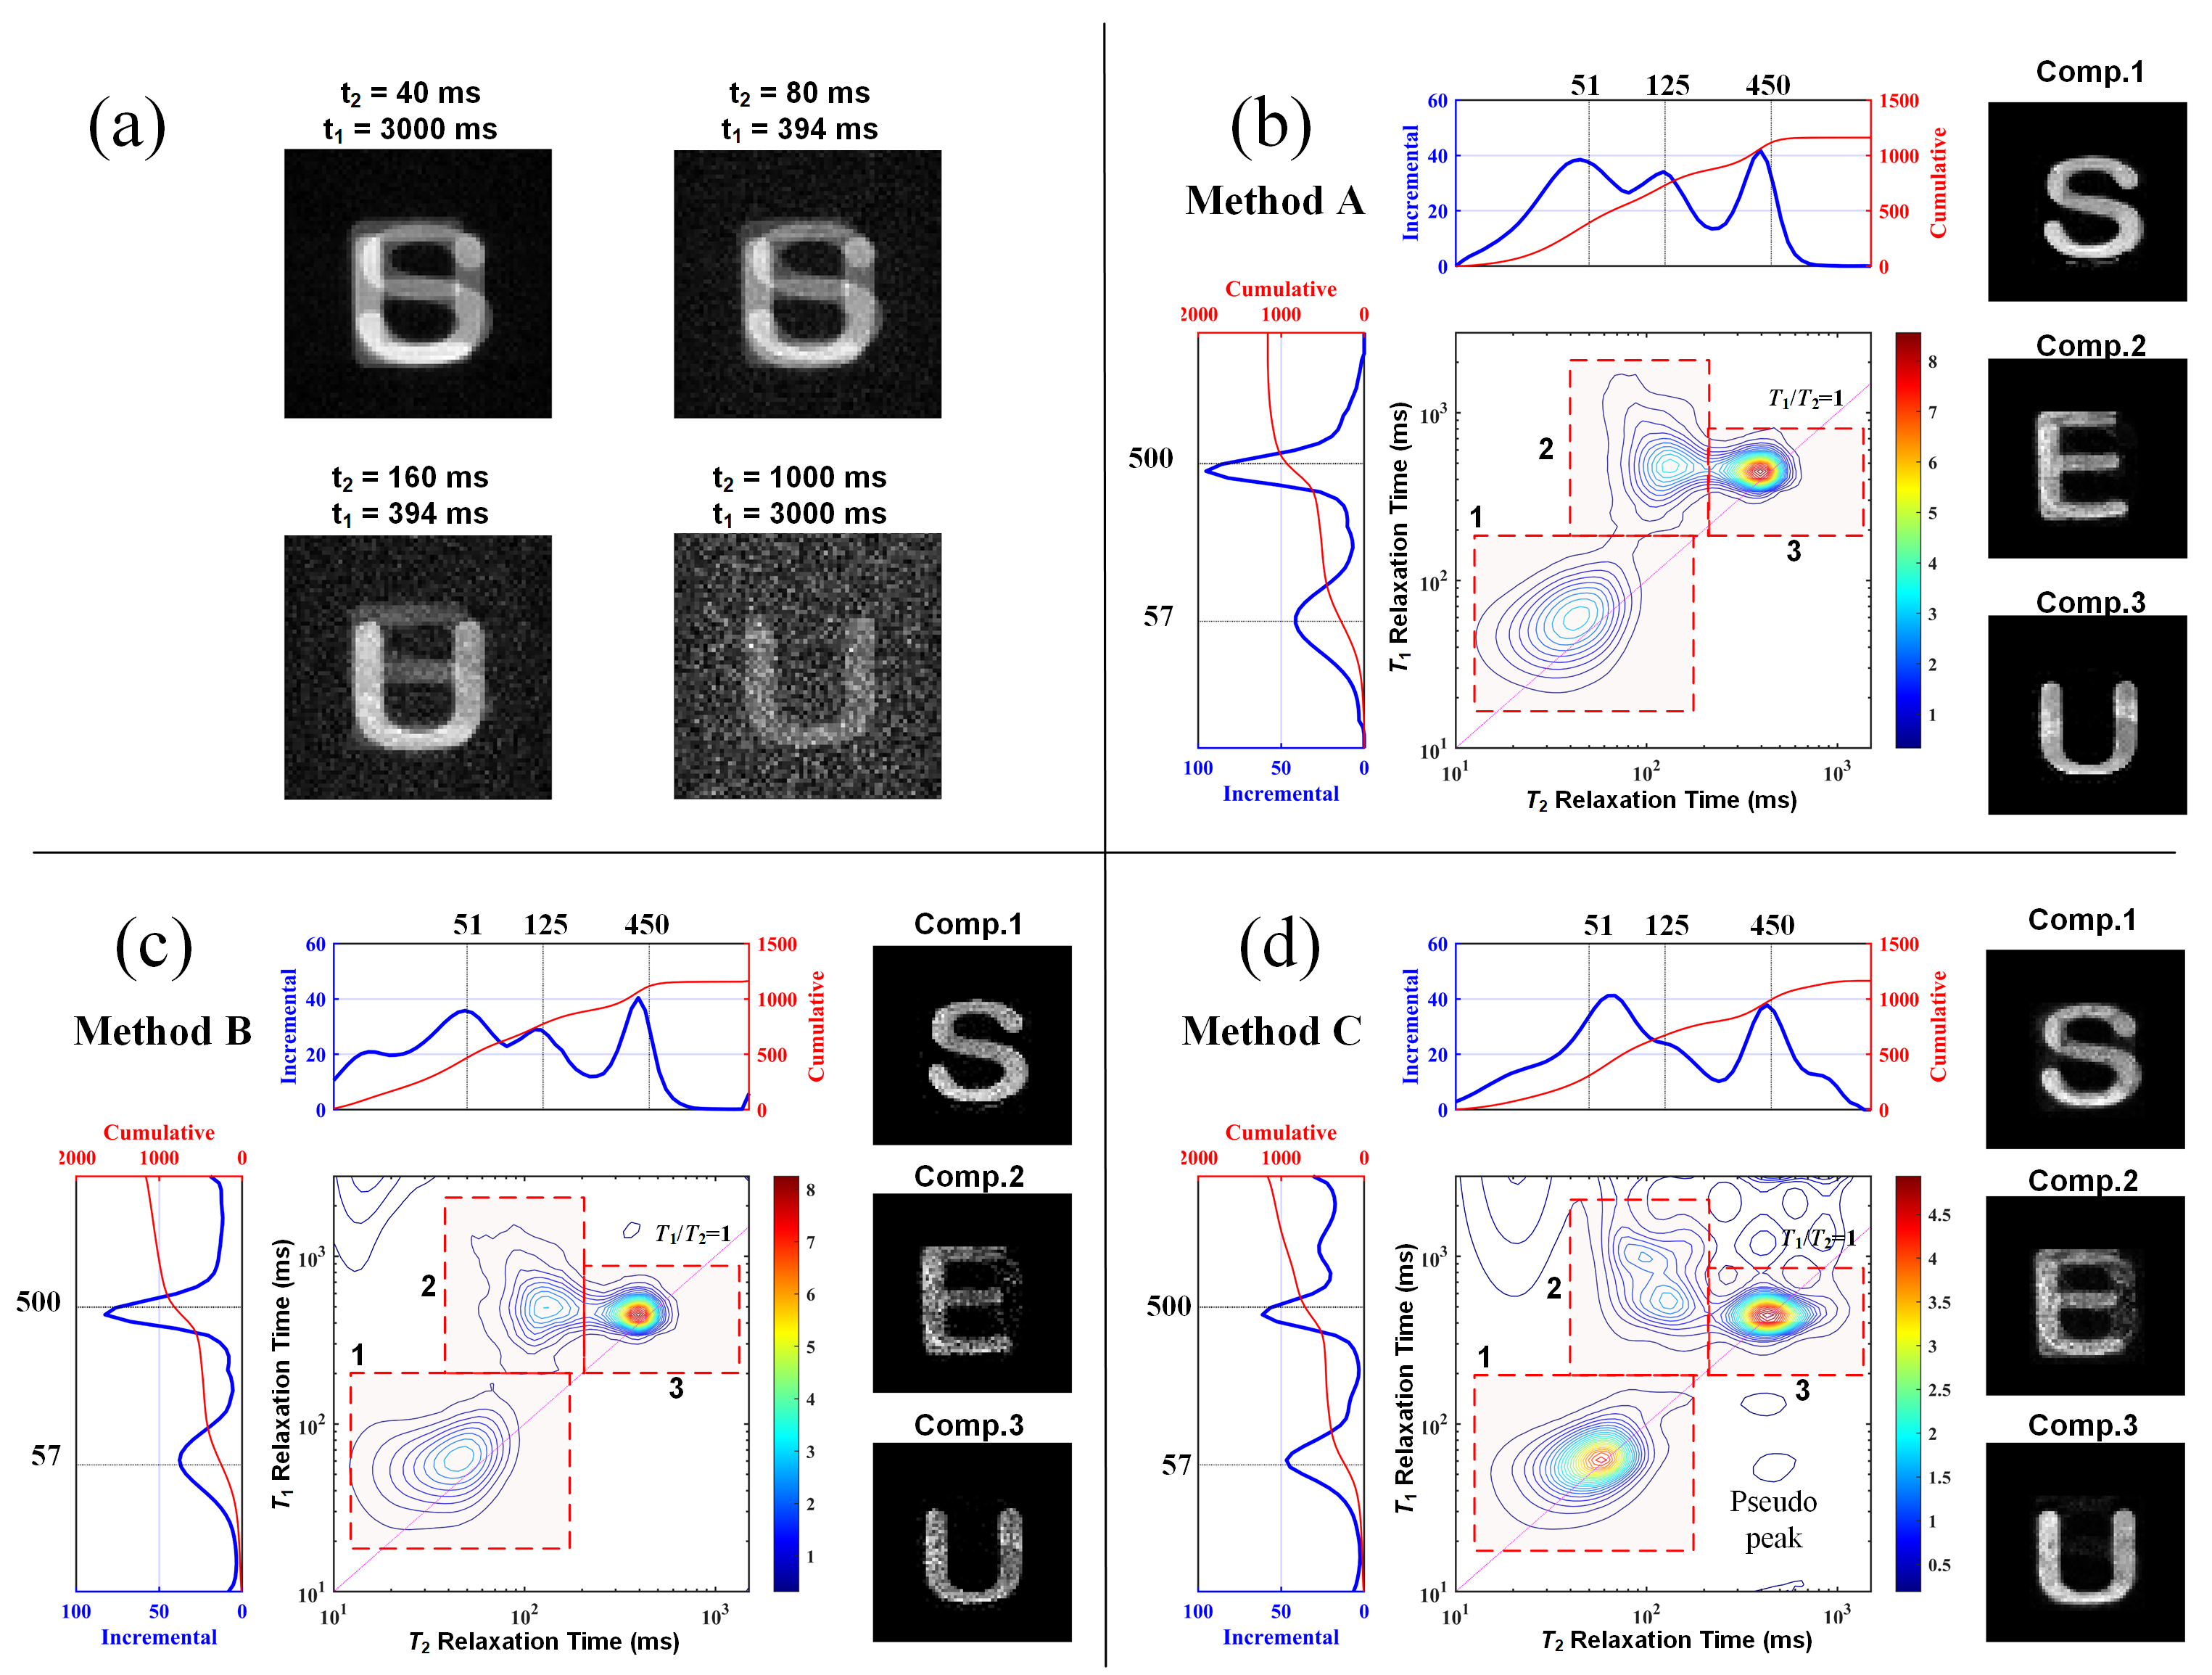
The performances of the proposed inversion method and other typical inversion methods were compared both in the simulation and MRI experiments to verify the advantages of the proposed inversion method. The results of simulation and phantom data are shown in Fig. 3 and Fig. 4. Facing MRI data of low SNR (the SNR value of the highest-SNR image in MRI data was about 25), the optimized method shows a better convergence rate, smaller optimization error, especially avoiding the fragmentation of component images and the appearance of pseudo peaks in the spectrum. The proposed multi-component imaging method was also applied to natural plant samples, as shown in Fig. 5. Results of plant samples show detailed features revealing inner water molecular states.CONCLUSION
This paper proposes a multi-component MRI method including an optimized inversion method to overcome the low SNR. Unlike structural imaging of MRI, multi-component estimation in individual voxels is an analysis of image information along a component dimension, which can decompose the components superimposed on each voxel to obtain difficult-to-observe microstructural information. At this stage, this approach still requires a rather long scan time. However, it can potentially combine with other rapid quantitative MRI methods such as MRF (MR fingerprint). We look forward to extending the further optimized method to the application of popular low-field or ultra-low-field portable MRI systems.Acknowledgements
This project is supported by the National Natural Science Foundation of China (Grant No. 51605089, Grant No. 51627808). We thank labs' partners for their all support and help in NMR experiments.References
[1] P. J. Slator, M. Palombo, K. L. Miller, C. F. Westin, F. Laun, D. Kim, J. P. Haldar, D. Benjamini, G. Lemberskiy, J. P. de Almeida Martins, and J. Hutter, “Combined diffusion-relaxometry microstructure imaging: Current status and future prospects,” Magn Reson Med, vol. 86, no. 6, pp. 2987-3011, Dec, 2021.
[2] L. Venkataramanan, S. Yi-Qiao, and M. D. Hurlimann, “Solving Fredholm integrals of the first kind with tensor product structure in 2 and 2.5 dimensions,” IEEE Transactions on Signal Processing, vol. 50, no. 5, pp. 1017-1026, May, 2002.
[3] R. Lu, C. Bao, L. Chen, Q. Yu, Y. Wu, X. Jiang, Z. Wu, Z. Ni, and H. Yi, “A novel inversion method of 2D TD-NMR signals based on realizing unconstrained maximization of objective function,” J Magn Reson, vol. 337, pp. 107168, Apr, 2022.
[4] P. J. Slator, J. Hutter, M. Palombo, L. H. Jackson, A. Ho, E. Panagiotaki, L. C. Chappell, M. A. Rutherford, J. V. Hajnal, and D. C. Alexander, “Combined diffusion-relaxometry MRI to identify dysfunction in the human placenta,” Magn Reson Med, vol. 82, no. 1, pp. 95-106, Jul, 2019.
[5] Y. Lin, J. P. Haldar, Q. Li, P. S. Conti, and R. M. Leahy, “Sparsity Constrained Mixture Modeling for the Estimation of Kinetic Parameters in Dynamic PET,” IEEE Trans Med Imaging, vol. 33, no. 1, pp. 173-85, Jan, 2014.
[6] D. Kim, J. L. Wisnowski, C. T. Nguyen, and J. P. Haldar, “Multidimensional correlation spectroscopic imaging of exponential decays: From theoretical principles to in vivo human applications,” NMR Biomed, vol. 33, no. 12, pp. e4244, Dec, 2020.
[7] D. Kim, E. K. Doyle, J. L. Wisnowski, J. H. Kim, and J. P. Haldar, “Diffusion-relaxation correlation spectroscopic imaging: A multidimensional approach for probing microstructure,” Magn Reson Med, vol. 78, no. 6, pp. 2236-2249, Dec, 2017.
[8] M. V. Afonso, J. M. Bioucas-Dias, and M. A. Figueiredo, “An augmented Lagrangian approach to the constrained optimization formulation of imaging inverse problems,” IEEE Trans Image Process, vol. 20, no. 3, pp. 681-95, Mar, 2011.
[9] J. P. Butler, J. A. Reeds, and S. V. Dawson, “Estimating Solutions of First Kind Integral Equations with Nonnegative Constraints and Optimal Smoothing,” SIAM Journal on Numerical Analysis, vol. 18, no. 3, pp. 381-397, June, 1981.
Figures