2841
Improvements in R1 mapping at ultra-low field using denoised and motion corrected field-cycling MRI in brain and head1Aberdeen Biomedical Imaging Centre, University of Aberdeen, Aberdeen, United Kingdom, 2Aberdeen Centre for Health Data Science, University of Aberdeen, Aberdeen, United Kingdom, 3Institute of Medical Sciences, University of Aberdeen, Aberdeen, United Kingdom, 4AMT Centre, University of Aberdeen, Aberdeen, United Kingdom
Synopsis
Keywords: Low-Field MRI, Brain, Small vessel disease
Motivation: Field-cycling MRI makes it possible to characterise the clinical potential of endogenous spin-lattice R1 image contrast that arises at ultra-low-magnetic field strengths.
Goal(s): Our goal was to examine the extent translated motion correction and denoising approaches improve the utility of R1 mapping performed at ultra-low field.
Approach: : Improvements in sensitivity to differences in R1 between tissue types and fitting accuracy were determined across brain and head tissues.
Results: Improvements in sensitivity and goodness of fit were observed. Significant difference in R1 values between regions of white matter and confluent small vessel disease were observed between 0.2 - 200 mT.
Impact: The improvement in sensitivity of R1 mapping using translated motion correction and denoising approaches provides new opportunities to assess the clinical potential of new endogenous image contrast mechanism at ultra-low field strengths.
Introduction
The continued drive across the MRI community to develop low-field MRI technologies offers a unique opportunity to make brain imaging clinically viable for an increased number of patients and treatment pathways1. Field-cycling MRI, a non-invasive imaging technology pioneered at the University of Aberdeen2, can be used to acquire images at multiple low magnetic field strengths between 0.2 mT and 200 mT. This field-cycling imaging (FCI) approach is now making it possible to evaluate new endogenous contrast mechanisms that arise from variations in spin-lattice relaxation (R1) with magnetic field, not visible at the higher field strengths used in conventional MRI systems. Initial investigations using FCI have demonstrated its ability to detect contrast between acute stroke and healthy brain tissue3. However, whilst the underpinning imaging technology continues to advance, new work is required to improve the sensitivity and model fitting accuracy of R1 mapping approaches, so that its clinical potential to differentiate and quantify tissues can be effectively examined.The objective of this work was therefore to examine whether translated motion correction and denoising approaches improve the sensitivity and accuracy of R1 mapping performed in head, brain, and confluent small vessel disease (SVD).
Methods
The analyses were performed on the first 13 participants with clinically determined moderate and severe small vessel disease recruited to an ethically approved on-going study (PUFFINS study; Proving the Utility of Fast Field Cycling MRI in stroke and SVD). Participants attended a 3T MRI (Philips 3T dStream) and FCI scan at the same visit. FCI images were acquired across four evolution magnetic field strengths of 0.2, 2, 20 and 200 mT and 5 logarithmically spaced evolution times. These 20 FCI images were acquired for a single image slice, with an echo time of 16 ms, matrix size of 90x90, in plane resolution of 3.1x3.1 mm2, slice thickness of 10 mm, and total scan time of 30 minutes.Voxel based R1 maps were generated for each evolution field using a multi-field fitting approach on data acquired from all evolution fields and evolution times simultaneously. The multi-field fitting approach was applied following three different image pre-processing approaches (Fig.1). First, motion correction was performed using a rigid-body spatial transformation to the mean FCI image using SPM12 (A1). Then images were denoised using either a pretrained denoising convolutional neural network approach (dnCNN) contained within MATLAB (MathWorks, USA) or block-matching and 3D filtering approach (BM3D, Tampere University, Finland) (A2 and 3).
Regions-of-interest for scalp tissue were generated from the mean FCI image using an in-house automated threshold approach. Tissue label maps of white matter (WM), grey matter (GM) and white matter hyperintensity (WMH) associated with small vessel disease, were generated from the T1W, and FLAIR images obtained at 3T MRI using standard automated approaches and co-registered to images obtained from FCI. Sensitivity was quantified as effect size, a measure of degree of separation between R1 histogram distributions extracted from regions of WM and WMH. Differences in sensitivity and goodness of fit (R2) between the pre-processing approaches were examined for each tissue type (Fig.2).
Results
Goodness of fit was improved with use of motion correction and denoising approaches across all tissue types (Fig.3). The greatest improvement in R2 from motion correction alone was observed in scalp with 3.8 % improvement compared to the original fitting result. Greatest overall improvement in R2 was observed from the addition of the dnCNN denoising approach, with mean (range) 8.5 (6.0 – 10.1) % percentage improvement from all tissue types. The effect size between WM and WMH SVD regions was improved with addition of both denoising approaches (Fig.4), and greatest improvement in effect size (62.5, 43.6 - 78.2 %) was observed with addition of the dnCNN denoising approach. Finally, utilising the combined motion correction and dnCNN approach (Fig. 5), a significant difference (P < 0.001) in R1 values between WM and WMH SVD was observed by paired sample t-test at 0.2, 2, 20 and 200 mT.Discussion
The results obtained from this study demonstrate improved sensitivity and fitting accuracy of R1 mapping using motion correction and denoising approaches. R1 maps generated across all magnetic field strengths were shown to yield sufficient effect size to differentiate WMH SVD and WM tissue. Future work is now required to tailor new image acquisition and analysis approaches to investigate the primary source of R1 contrast across different brain pathologies at ultra-low field.Conclusion
Use of motion correction and denoising approaches improves the sensitivity and fitting accuracy of R1 mapping performed at ultra-low magnetic field strengths using field-cycling MRI.Acknowledgements
We would like to thank the participants who volunteered to take part in this study.Study funding was received from Scotland Chief Scientist Office, UK.
Nicholas Senn salary funding was received from University of Aberdeen Development Trust, UK.
References
1. Kimberly WT, et al. Brain imaging with portable low-field MRI. Nat Rev Bioeng. 2023;1(9):617-630
2. Broche LM, et al. A whole-body Fast Field-Cycling scanner for clinical molecular imaging studies. Sci Rep 2019;9,10402.
et al. Joint multi-field T1 quantification for fast field-cycling MRI. Magn Reson Med. 2021; 86:2049–2063.Figures
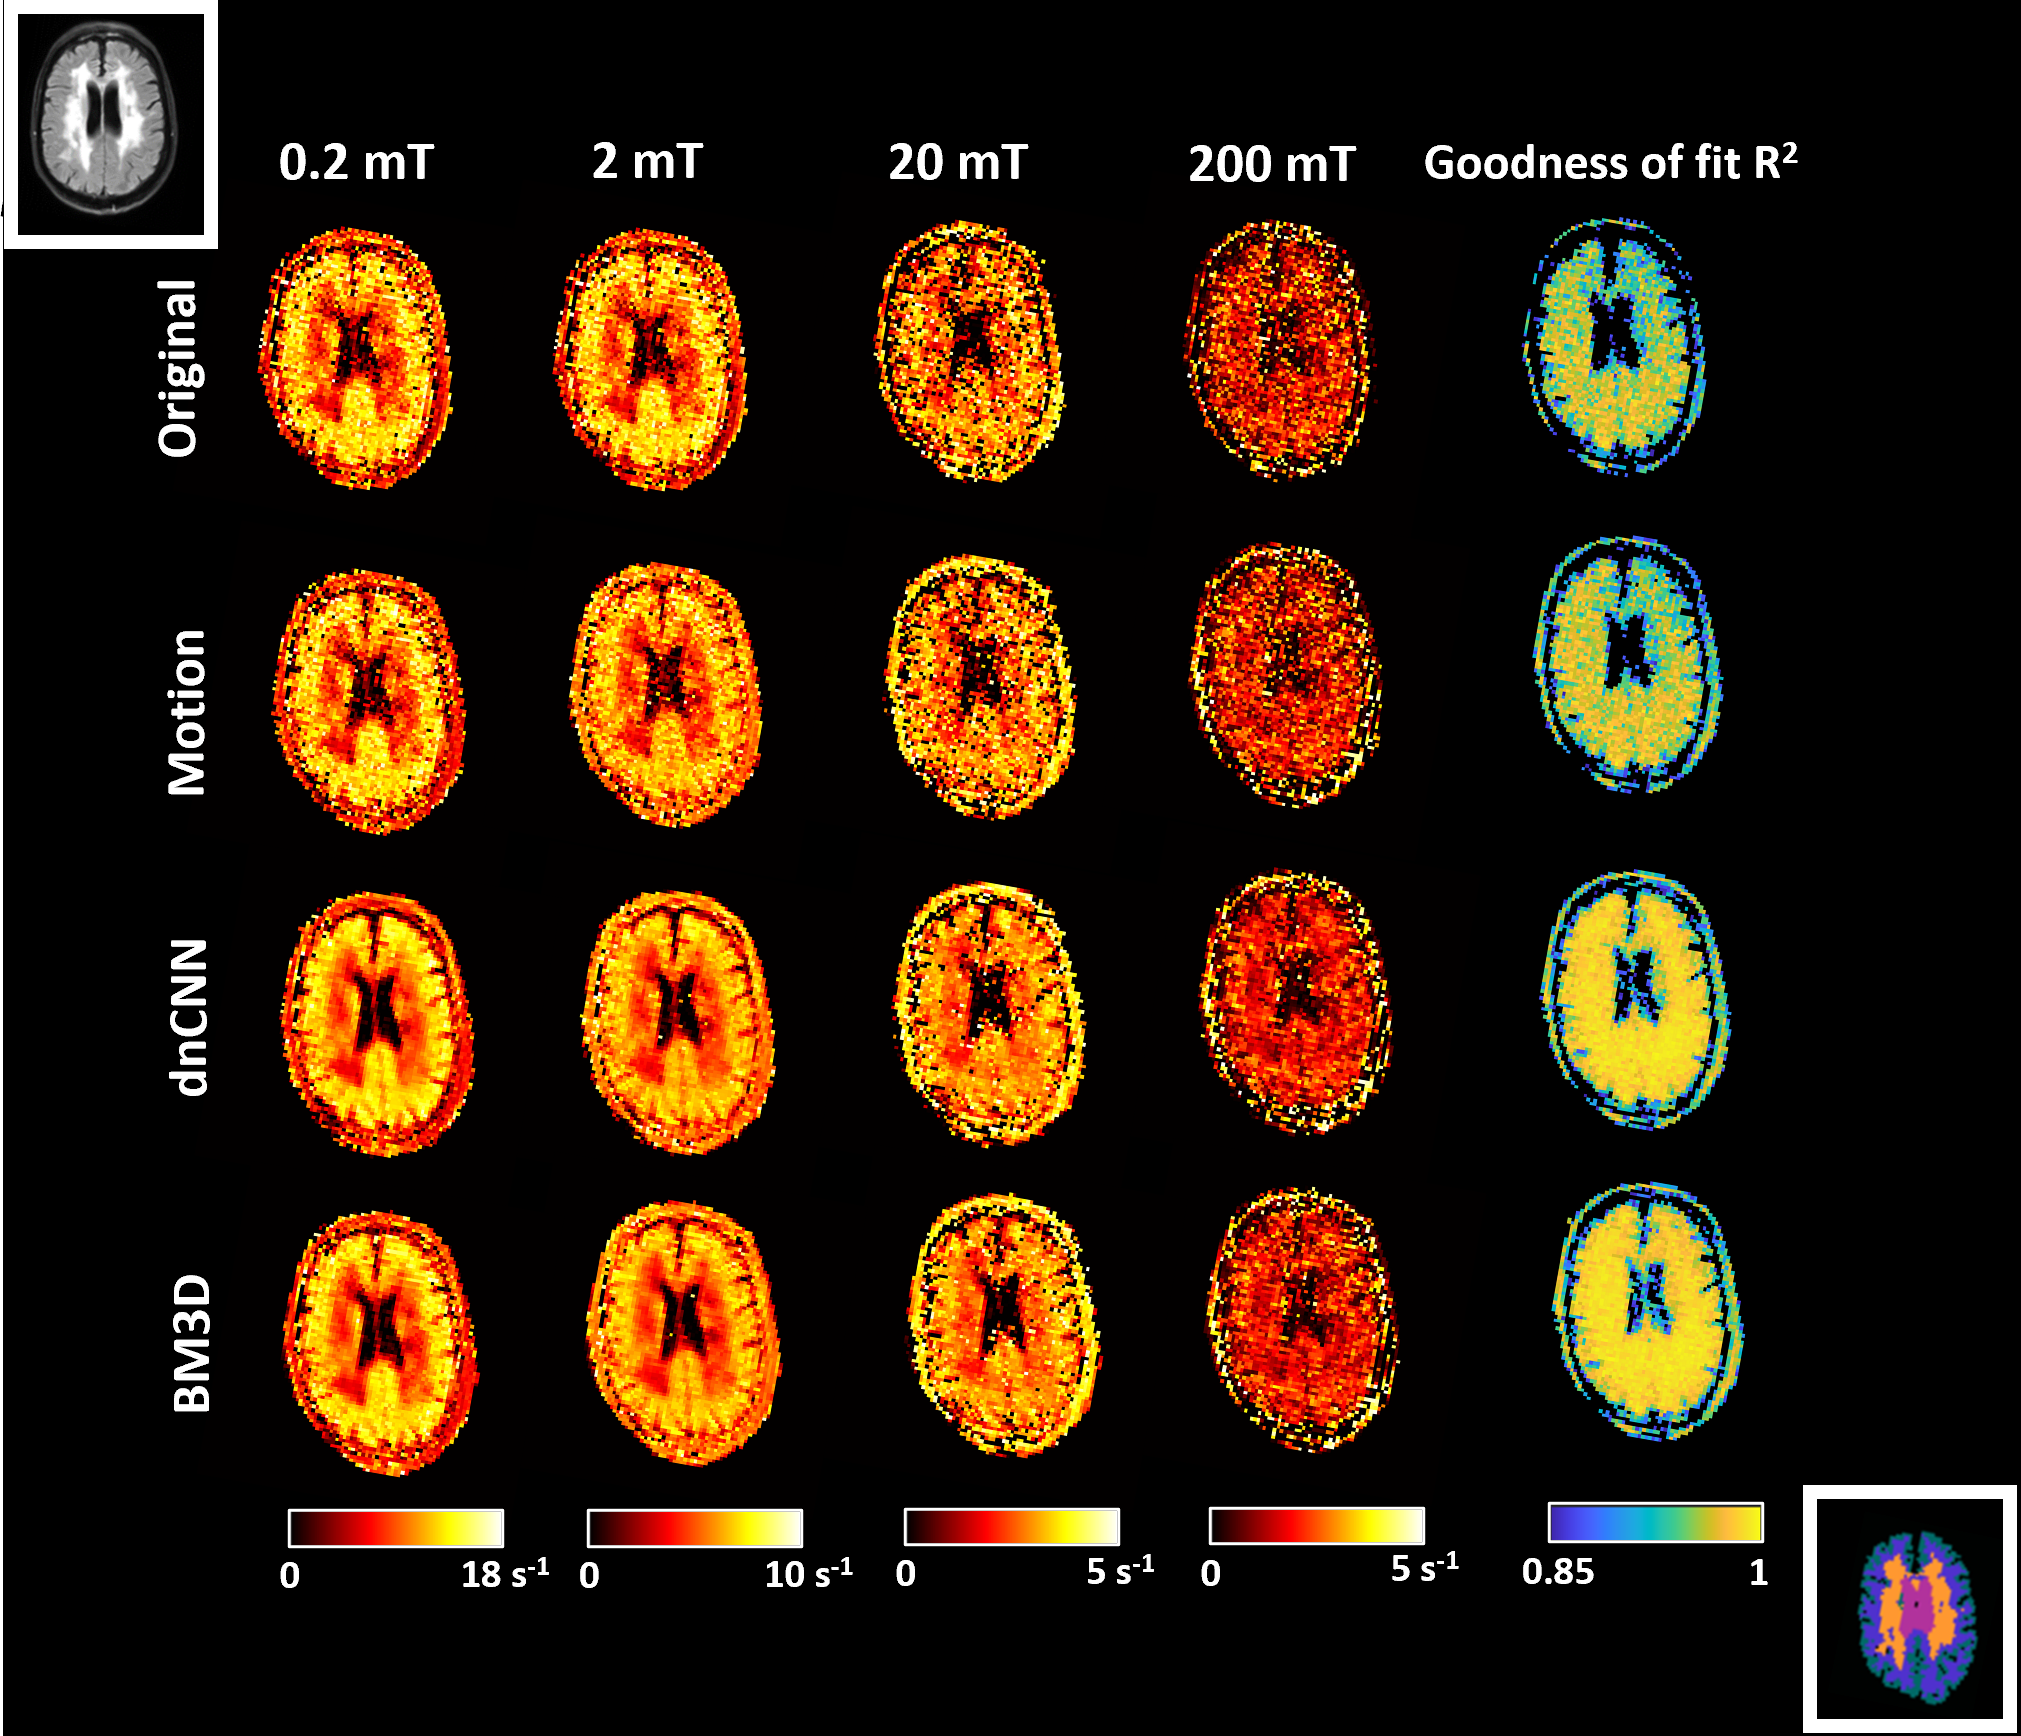
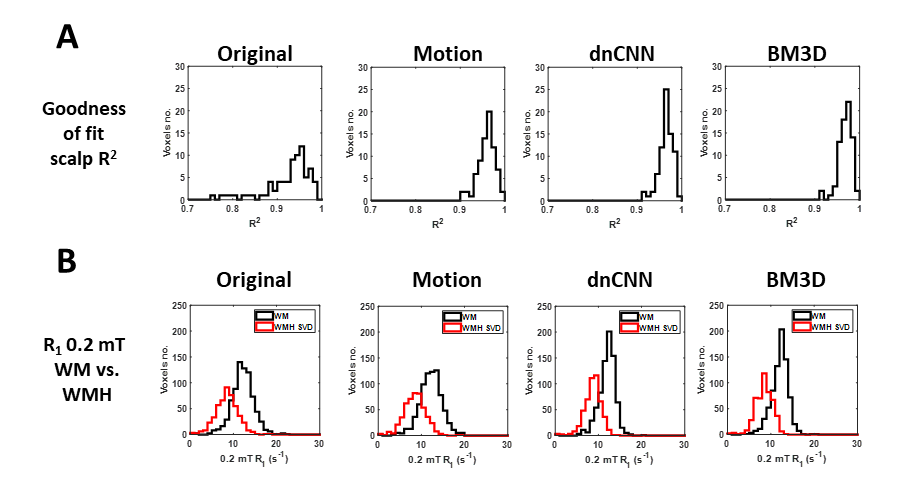
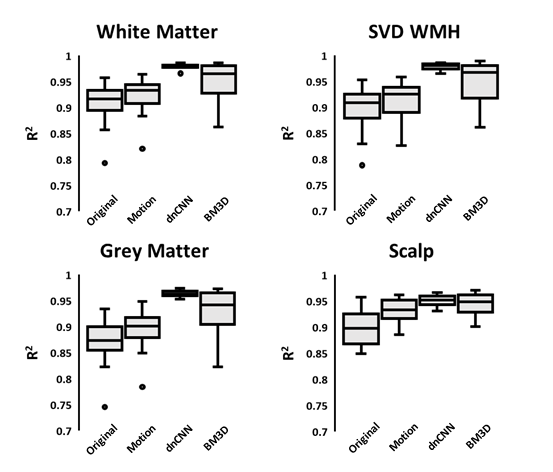
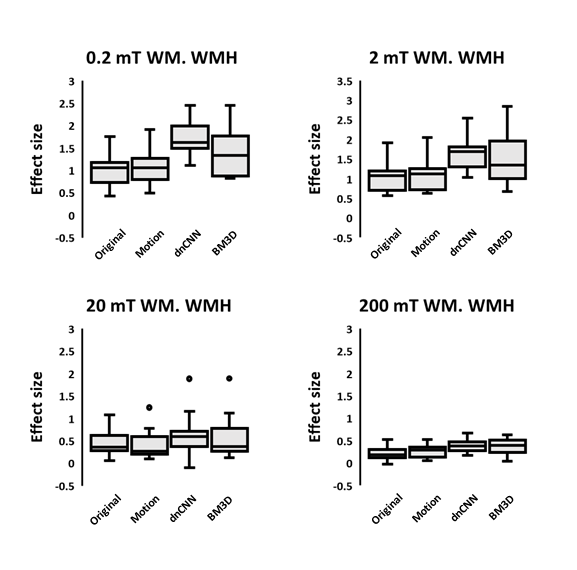
Figure 4. Improvements in effect size. For each magnetic field strength, box and whisker plots depict differences in effect size calculated between histogram distributions of white matter and white matter hyperintense small vessel disease regions (WMH SVD). Cohort box and whisker plot represent: Original, no correction applied; Motion, motion correction applied; dnCNN, motion correction and denoising convolutional neural network approach applied; BM3D, motion correction and BM3D noise correction applied.
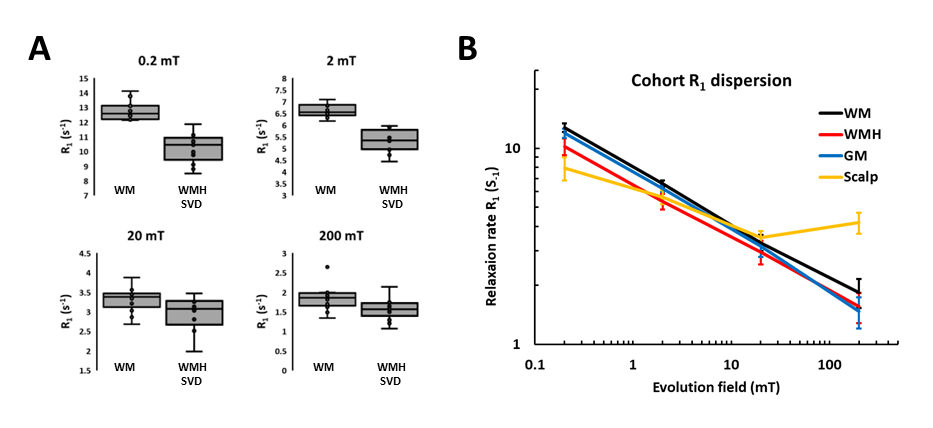
Figure 5. Differences in R1 between tissue types. Figure 5A, for each magnetic field strength, box and whisker plots depict differences in R1 values calculated between white matter (WM) and white matter hyperintense small vessel disease (WMH SVD) regions. A significant difference (P < 0.001) was obtained for each comparison. Figure 5B, depiction of the dispersion of R1 values with magnetic field strength for each tissue region, representing cohort mean ± standard deviation. GM, Grey matter.