2840
Instrument Power Monitoring Analysis of Commercial Point-of-Care MR in Resource-Constrained Healthcare Settings: Initial Feasibility1Biomedical Engineering, Illinois Institute of Technology, Chicago, IL, United States, 2Computer Science, Illinois Institute of Technology, Chicago, IL, United States, 3Hyperfine Inc., Guilford, CT, United States
Synopsis
Keywords: Low-Field MRI, Low-Field MRI
Motivation: The 64mT Hyperfine Swoop (Hyperfine Inc. Guilford CT) is a first-of-kind point-of-care (POC) commercial system to allow ‘patient-to-scanner’ imaging.
Goal(s): We report an independent technical benchmark analysis of this system’s power consumption in this study (pass-through measures of W, kWh, and A).
Approach: Performance benchmarks of MR systems power consumption was measured per-pulse sequence using consumer-grade instrumentation under continuous monitoring. Custom acquisition protocol using two portable 120VAC NEMA-standard power banks were examined.
Results: A look-up benchmark table of empirical surge current draw (with 120VAC), its implicit advisory, and a potentially viable protocol run example without 'wall' i.e. via stand-alone power supply are reported.
Impact: POC-MR Instrumentation power benchmark considerations on a per-pulse-sequence power consumption basis provide key insights into protocol deployment, scheduling, and optimal scan resource management considerations in resource-limited settings. Successful pulse sequence protocol implementation with under resource-limited setting was also demonstrated.
Introduction
Among distinct advantages of point-of-care (POC) MR systems lie in their enabling technologies to bring image acquisition directly to patients. As such, POC-MR has unique and distinct deployment scenarios in ambulatory settings, the developing world, and in war-affected zones where predicated clinical infrastructure may not always be readily accessible. In this study, we examine the electric power consumption benchmarks of the Hyperfine 64mT Swoop system on a per-pulse-sequence and per-exam basis while simulating such real-world-use setup. We employ specific instrumentation to record, monitor, and benchmark key power consumption performance metrics to provide insights and practical protocol guidance for scenarios in which reliable supply of steady electric power source is absent.Methods
Instrumentation Setup: The POC System was set up in the engineering laboratory setting with: a: direct US NEMA 120VAC 5-15A ‘wall’ connection, b-1,2: a pass-through with wall-connected power storage units: [b-1] 1.11kWH and 1200W/2600W peak power storage unit, and [b-2] 0.288kWh unit graded 600W/1200W peak surge; and c-1,2: the power storage units b-1 and b-2 without ‘wall’ access. All devices were further linked with one of two consumer-level (2x class 1.0) and one class 0.5 grade pass-through NEMA 120-240VAC 5-15A power usage monitors with: maximum 2% [for class 1.0] and 1% [for class 0.5] error measures for both V and A, and <1.0W for meter’s power dissipation. Figure 1 shows the experimental setup.Hardware Considerations from Available Documentation: The Hyperfine Swoop System (Guilford, CT) examined in this study [1] employs a 900WDC graded power supply unit (PSU, no efficiency rating available) which may thereby draw above 900W/120VAC(NEMA)=7.5A at peak rate during runtime, and also equipped with an onboard motherboard, CPU, RAM, GPU, ethernet connectivity, for processing beyond waveform generation including: hardware control, wireless operator interfacing, stand-alone image reconstruction, and data transfer on Linux-Mac-based operating systems [2].
Initial and Iterated Assumptions: Observed power draw through the pass-through devices yielded the instrument-limited instantaneous current draw (in A), which was used to delineate the approximate power consumption considerations (Fig 2-top-left showing 1st scan only); from a set of preliminary data, our assumption was further refined as follows: Revised and iterated assumption: broadly speaking, each pulse sequence has its own 'acquisition' and 'progressive reconstruction' signature temporal windows that affect both intra- and inter-sequence current draw (See Fig 2-top-right with concurrent recon of previous scan).
Data Acquisition Experimentation: Power consumption monitoring was performed using a set of two pass-through monitoring on the full clinical product sequences: T1w, T2w, and FLAIR (in AXL, SAG and COR orientations), and DWI at b=0 and b=900s/mm2 with ADC post-processing: this full protocol performed in sequence required a 71-minute exam time. Six sets of acquisition experiments were performed in a test-retest manner and its passthrough monitors were recorded via video capture. Based on video-derived measurements, several key inferences with real-world use considerations are further drawn out. Lastly, we demonstrate a candidate 'lean' protocol in ambulatory or other limited electric power resource settings.
Results
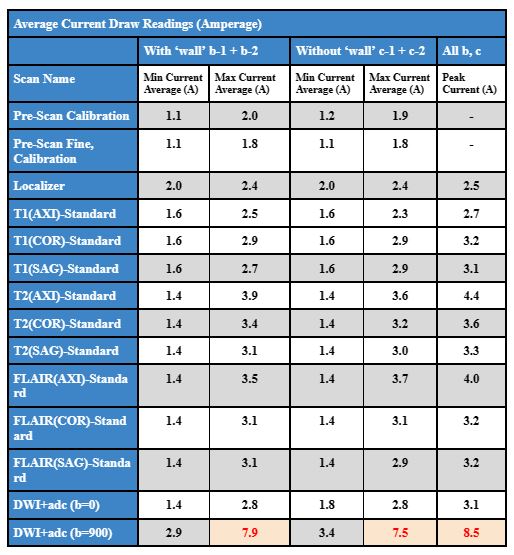
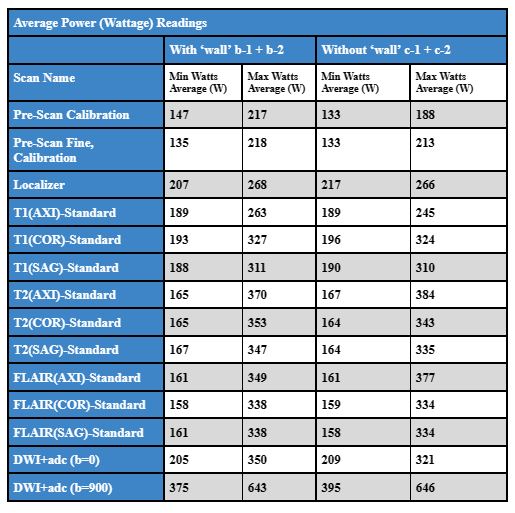
The maximal instantaneous current draw recorded by all examined pass-through monitoring was 8.5A at 120VAC (during DWI b-value=900s/mm2 acquisition with concurrent b=0 ADC processing) - whose surge draw condition exceeded the peak 900WDC PSU draw to yield an observed peak efficiency rating of approximately 15%. No other examined pulse sequence operation or idle conditions yielded above 4.1A for 500W power draw. All pass-through instrumentation checked out in terms of the aggregate energy consumption in yielded kWH. The mean peak, minimum, and extremal peak current and power draws from all examined pulse sequences are reported in Tables 3 and 4. Of note, extremal min peak current draw was observed during first T1w Axial scan (~2.6A: no recon). Subsequent acquisitions drew power additional resources for both previous and current scan reconstructions. The selection and ordering of pulse sequences warrant attention under limited resource conditions.A set of lean protocols can be prepared using our reported tables - upon accounting for adequate time for patient setup, calibration, acquisition-reconstruction within benchmarked limits. Feasibility of exams using the c-2 small portable 0.288kWH - 1200W peak surge output rating conditions (e.g. [T1w with/without T2w] or FLAIR for suspected intracranial bleeding in ambulatory settings, or high-throughput enhanced legion assessments - both in under 10-15 mins) were successful upon careful protocol design in this initial feasibility study.
Discussion
Feasibility of a commercial Point-of-Care 64mT systems use under resource limited condition was examined in this study using electric current and power benchmarks. A reference current draw and power consumption look-up table, and insights to acquisition-recon exam sequencing are provided. Future works include viability assessment in real-world deployments and benchmarking beyond one system.Acknowledgements
This project was supported by NIH K25 HL141634 (Kawaji), the IIT-Pritzker Chair (Georgiadis), and the IIT-Pritzker Center for Biomedical Sciences RES-Match Program (Crosby, Kawaji).References
[1] - Sofka, M.; Siddiqui, K.; Siegel, E. Hyperfine Deep Learning Image Reconstruction. Hyperfine Inc.: [White Paper], 2022.
[2] - Hyperfine MR system specifications [website]. https://hyperfine.io/swoop/details-and-specifications
Figures
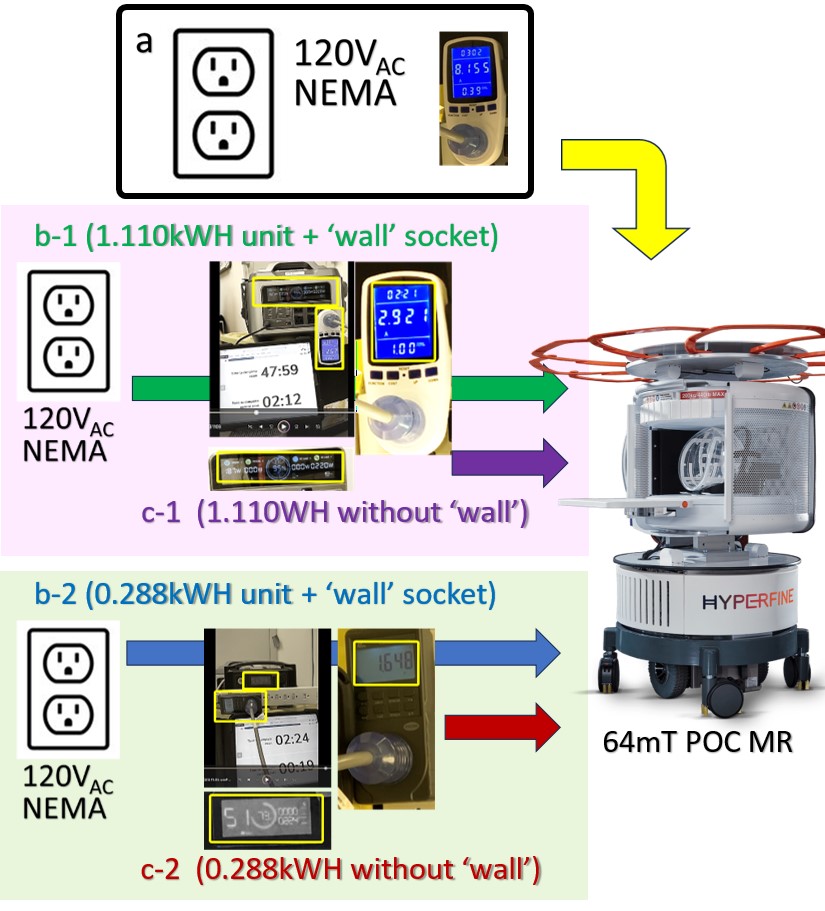
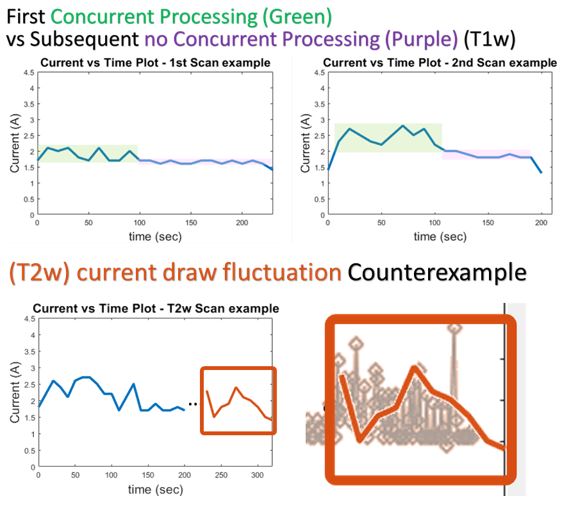
Fig 2. Representative Current vs Time plots (Consecutive T1w scans) that illustrate Assumptions of Waveform Generation only (top left) vs performed with concurrent previous scan reconstruction (top right). These inferences were adapted into our benchmarking assumptions. Subsequent pulse sequences with increased progressive reconstruction that repeats with partially acquired k-space data yielded no discernable current pattern due to notable drawn fluctuation (bottom row - orange); hence, we only report extremal current draws and power on a per-pulse sequence basis.