2832
Reproducibility of quantitative MRI measures at Ultra-Low Field1University of British Columbia, Vancouver, BC, Canada, 2Hyperfine Inc, Guilford, CT, United States, 3King's College London, London, United Kingdom, 4MNCH D&T, Bill and Melinda Gates Foundation, Seattle, WA, United States, 5Lund University, Lund, Sweden
Synopsis
Keywords: Low-Field MRI, Low-Field MRI
Motivation: Ultra-low field scanners can vastly improve access to neuroimaging, and implementing MRI techniques to quantify microstructure allows monitoring of both neurodegenerative diseases as well as myelination trajectories during development.
Goal(s): To assess the reliability of microstructure-sensitive methods at ultra-low field before large-scale deployment.
Approach: The reliability of recently developed magnetization transfer (MT) imaging and T2 mapping sequences at 64mT was assessed in 5 healthy subjects through histograms, difference maps and correlation analysis in white matter.
Results: Both MT ratios and T2 values were highly reproducible in the test cohort.
Impact: Techniques to measure microstructure, even semi-quantitatively, can be useful for tracking myelination/demyelination. Here we demonstrate the reproducibility of two such methods: magnetization transfer imaging and T2 mapping, in a small cohort of healthy adults at ultra-low field (64mT).
Introduction
Tools to noninvasively quantify brain microstructure are important for monitoring healthy development as well as changes with neurological disease. Both the T2 relaxation time and the magnetization transfer (MT) ratio (MTR) can provide surrogates for microstructural changes including myelination and demyelination in the central nervous system, and are relatively easy to acquire and calculate. Ultra-low field scanners such as Hyperfine Inc’s (Guilford, CT) Swoop 64mT system improve access to such imaging techniques. Before wide deployment of these sequences, however, it is necessary to assess their reliability. In this study we quantify the reproducibility of previously developed sequences for MT imaging1 and T2 mapping2 at ultra-low field in 5 healthy volunteers.Methods
AcquisitionFive healthy adults at underwent MR imaging at 64mT (Swoop software version rc8.7 Beta 1) using the following sequences:
- T2w for white matter segmentation, 1.6x1.6x5 mm3, ~3 min
- MT imaging1,3: two PSIF sequences, ɑMToff/ɑMTon=60°/300°, TR/τRF=10.5 ms/180 µs, 3x3x5 mm3, 4.5 min total
- T2 mapping2: Non-cartesian multi-echo spin echo sequence, 80 echoes, ΔTE/TR=3.93/800 ms, 3x3x5 mm3, 7.5 min
Subjects were then removed completely from the scanner, repositioned, and rescanned with the same protocol.
Processing
All images (except the T2w) were reconstructed offline using BART4. MT images were denoised with ANTs’ non-local means with a Gaussian noise model5, and MTR maps were calculated as MTR=(MToff-MTon)/(MToff). T2 mapping images were reconstructed using the CALIPR framework6 and T2 was estimated using a mono-exponential fit.
Analysis
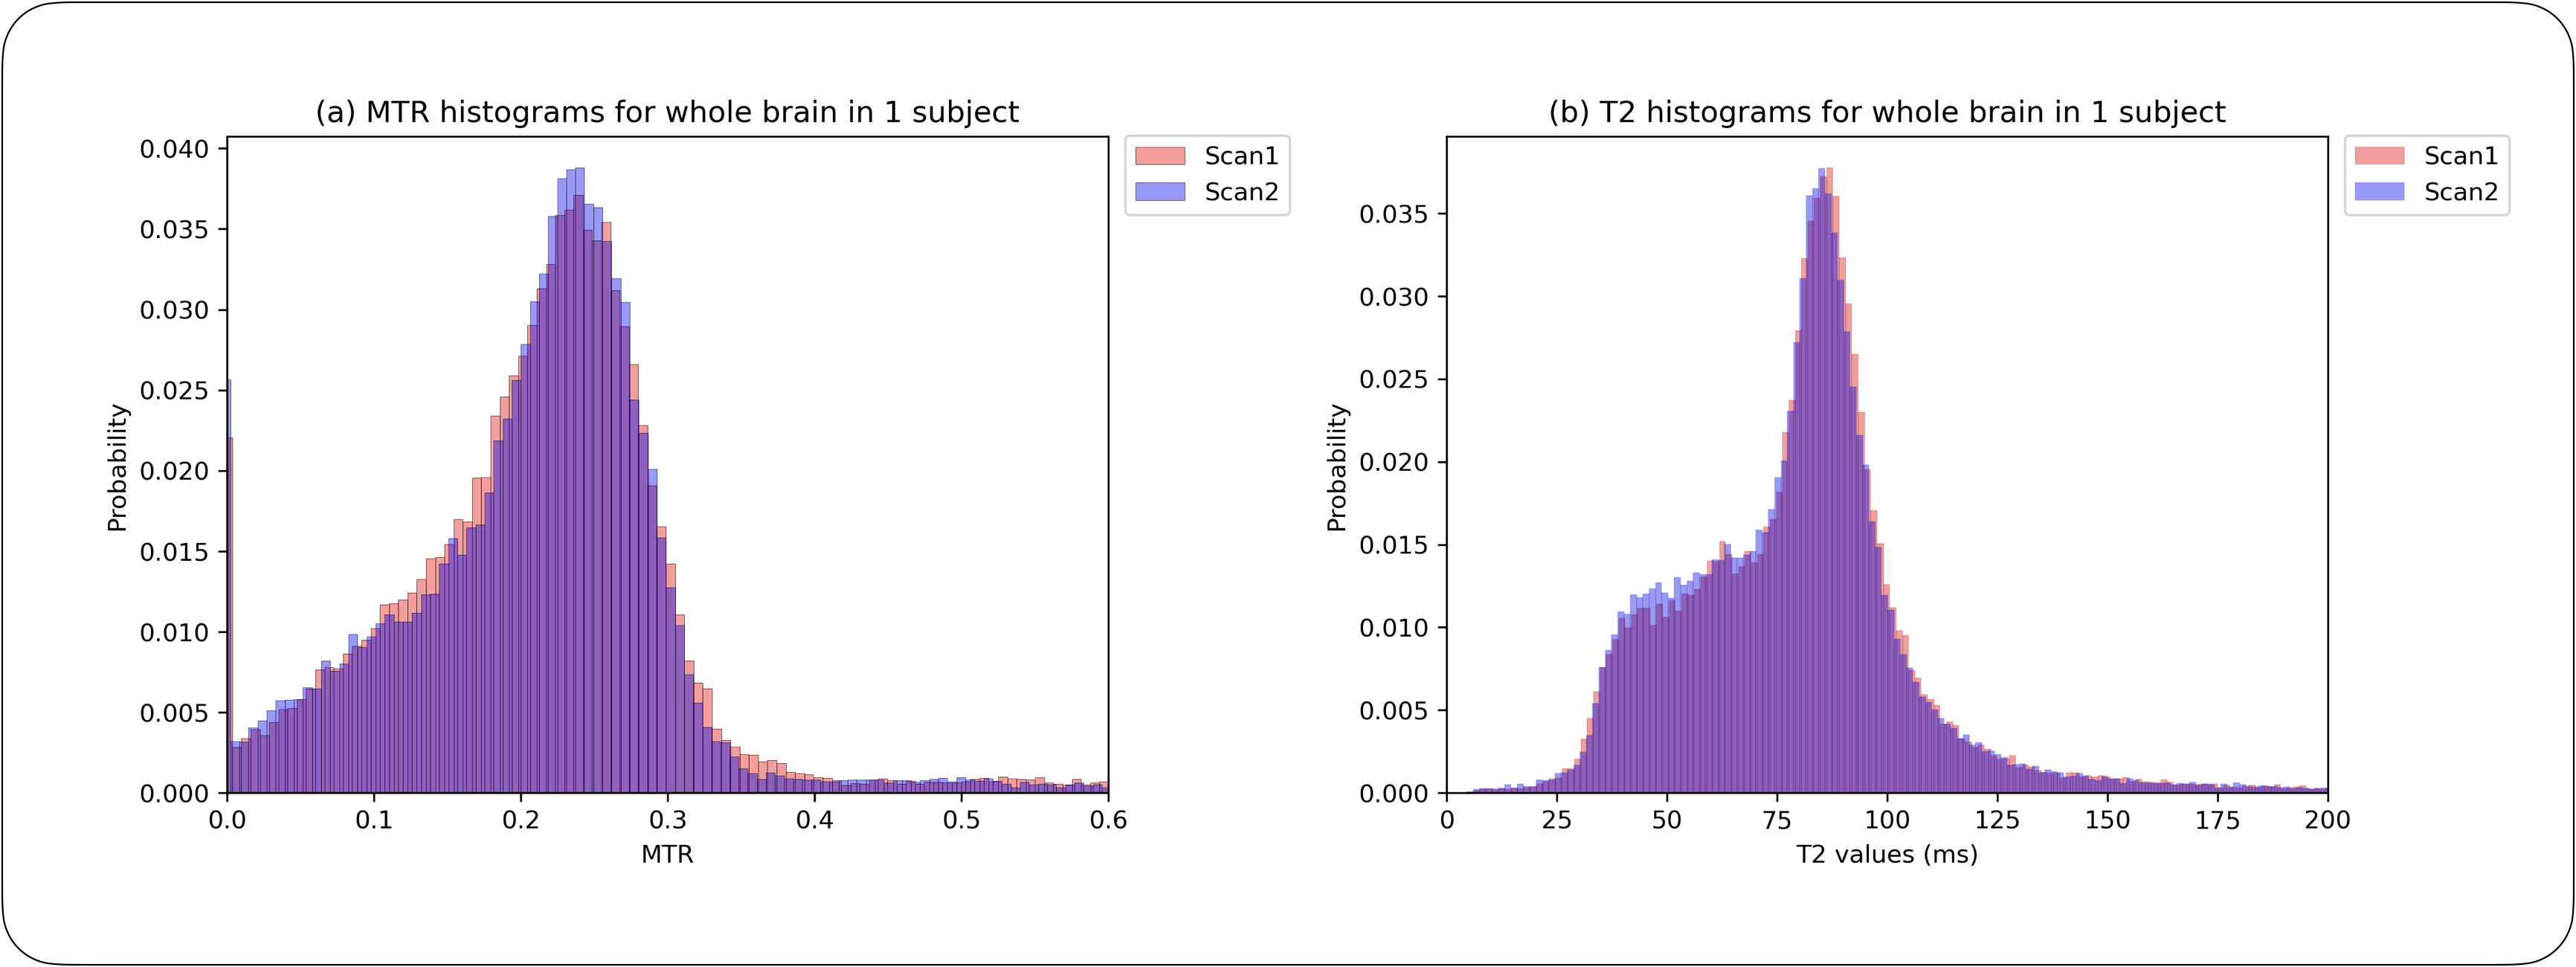
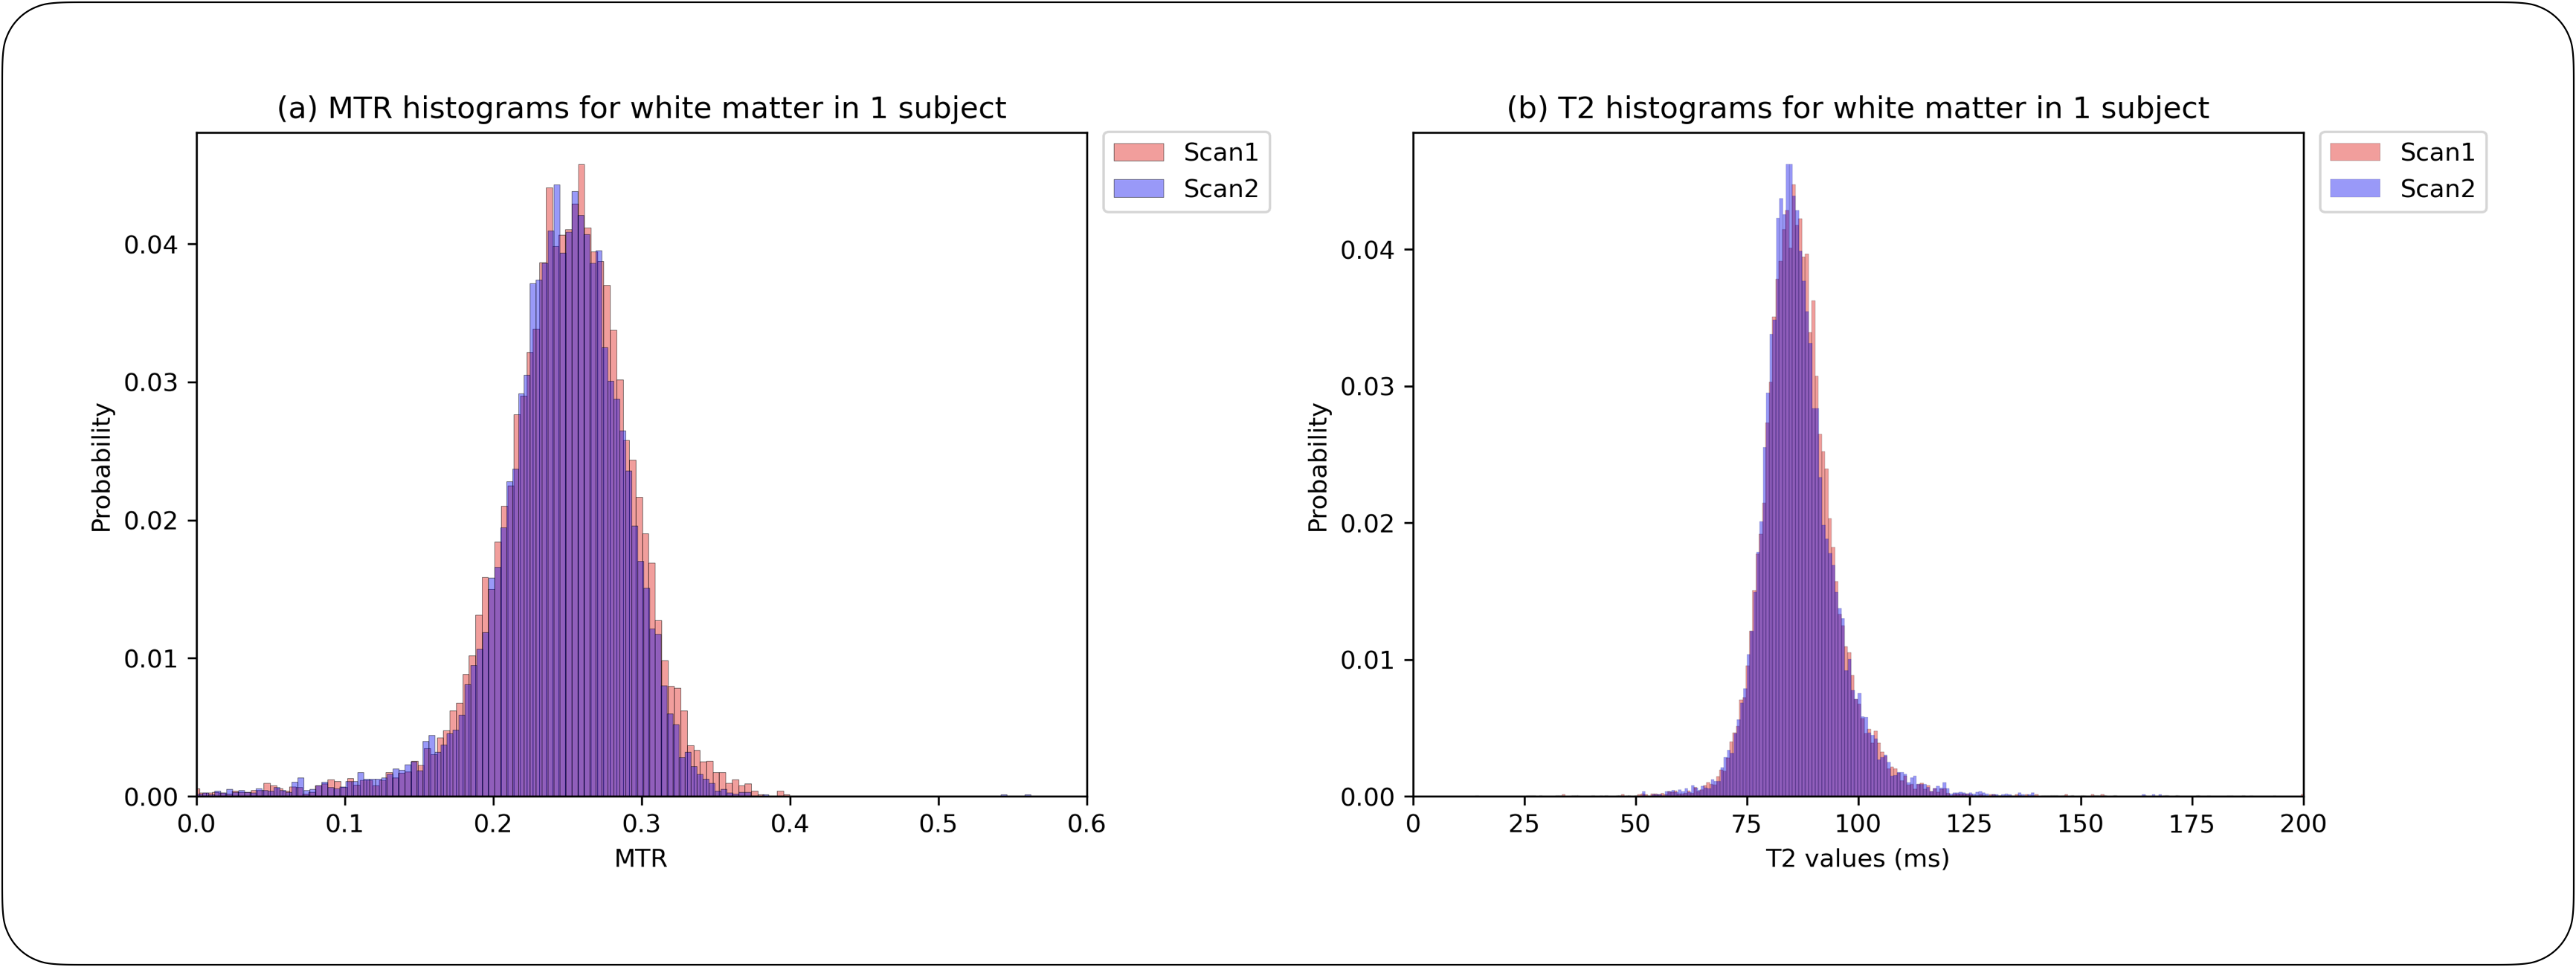
White matter masks were generated from T2w images7, and images were registered with ANTs8. Data was assessed for reproducibility by visually comparing maps, using histograms of MTR and T2 values in whole brain and white matter voxels, and comparing scan-rescan values for all subjects.
Results
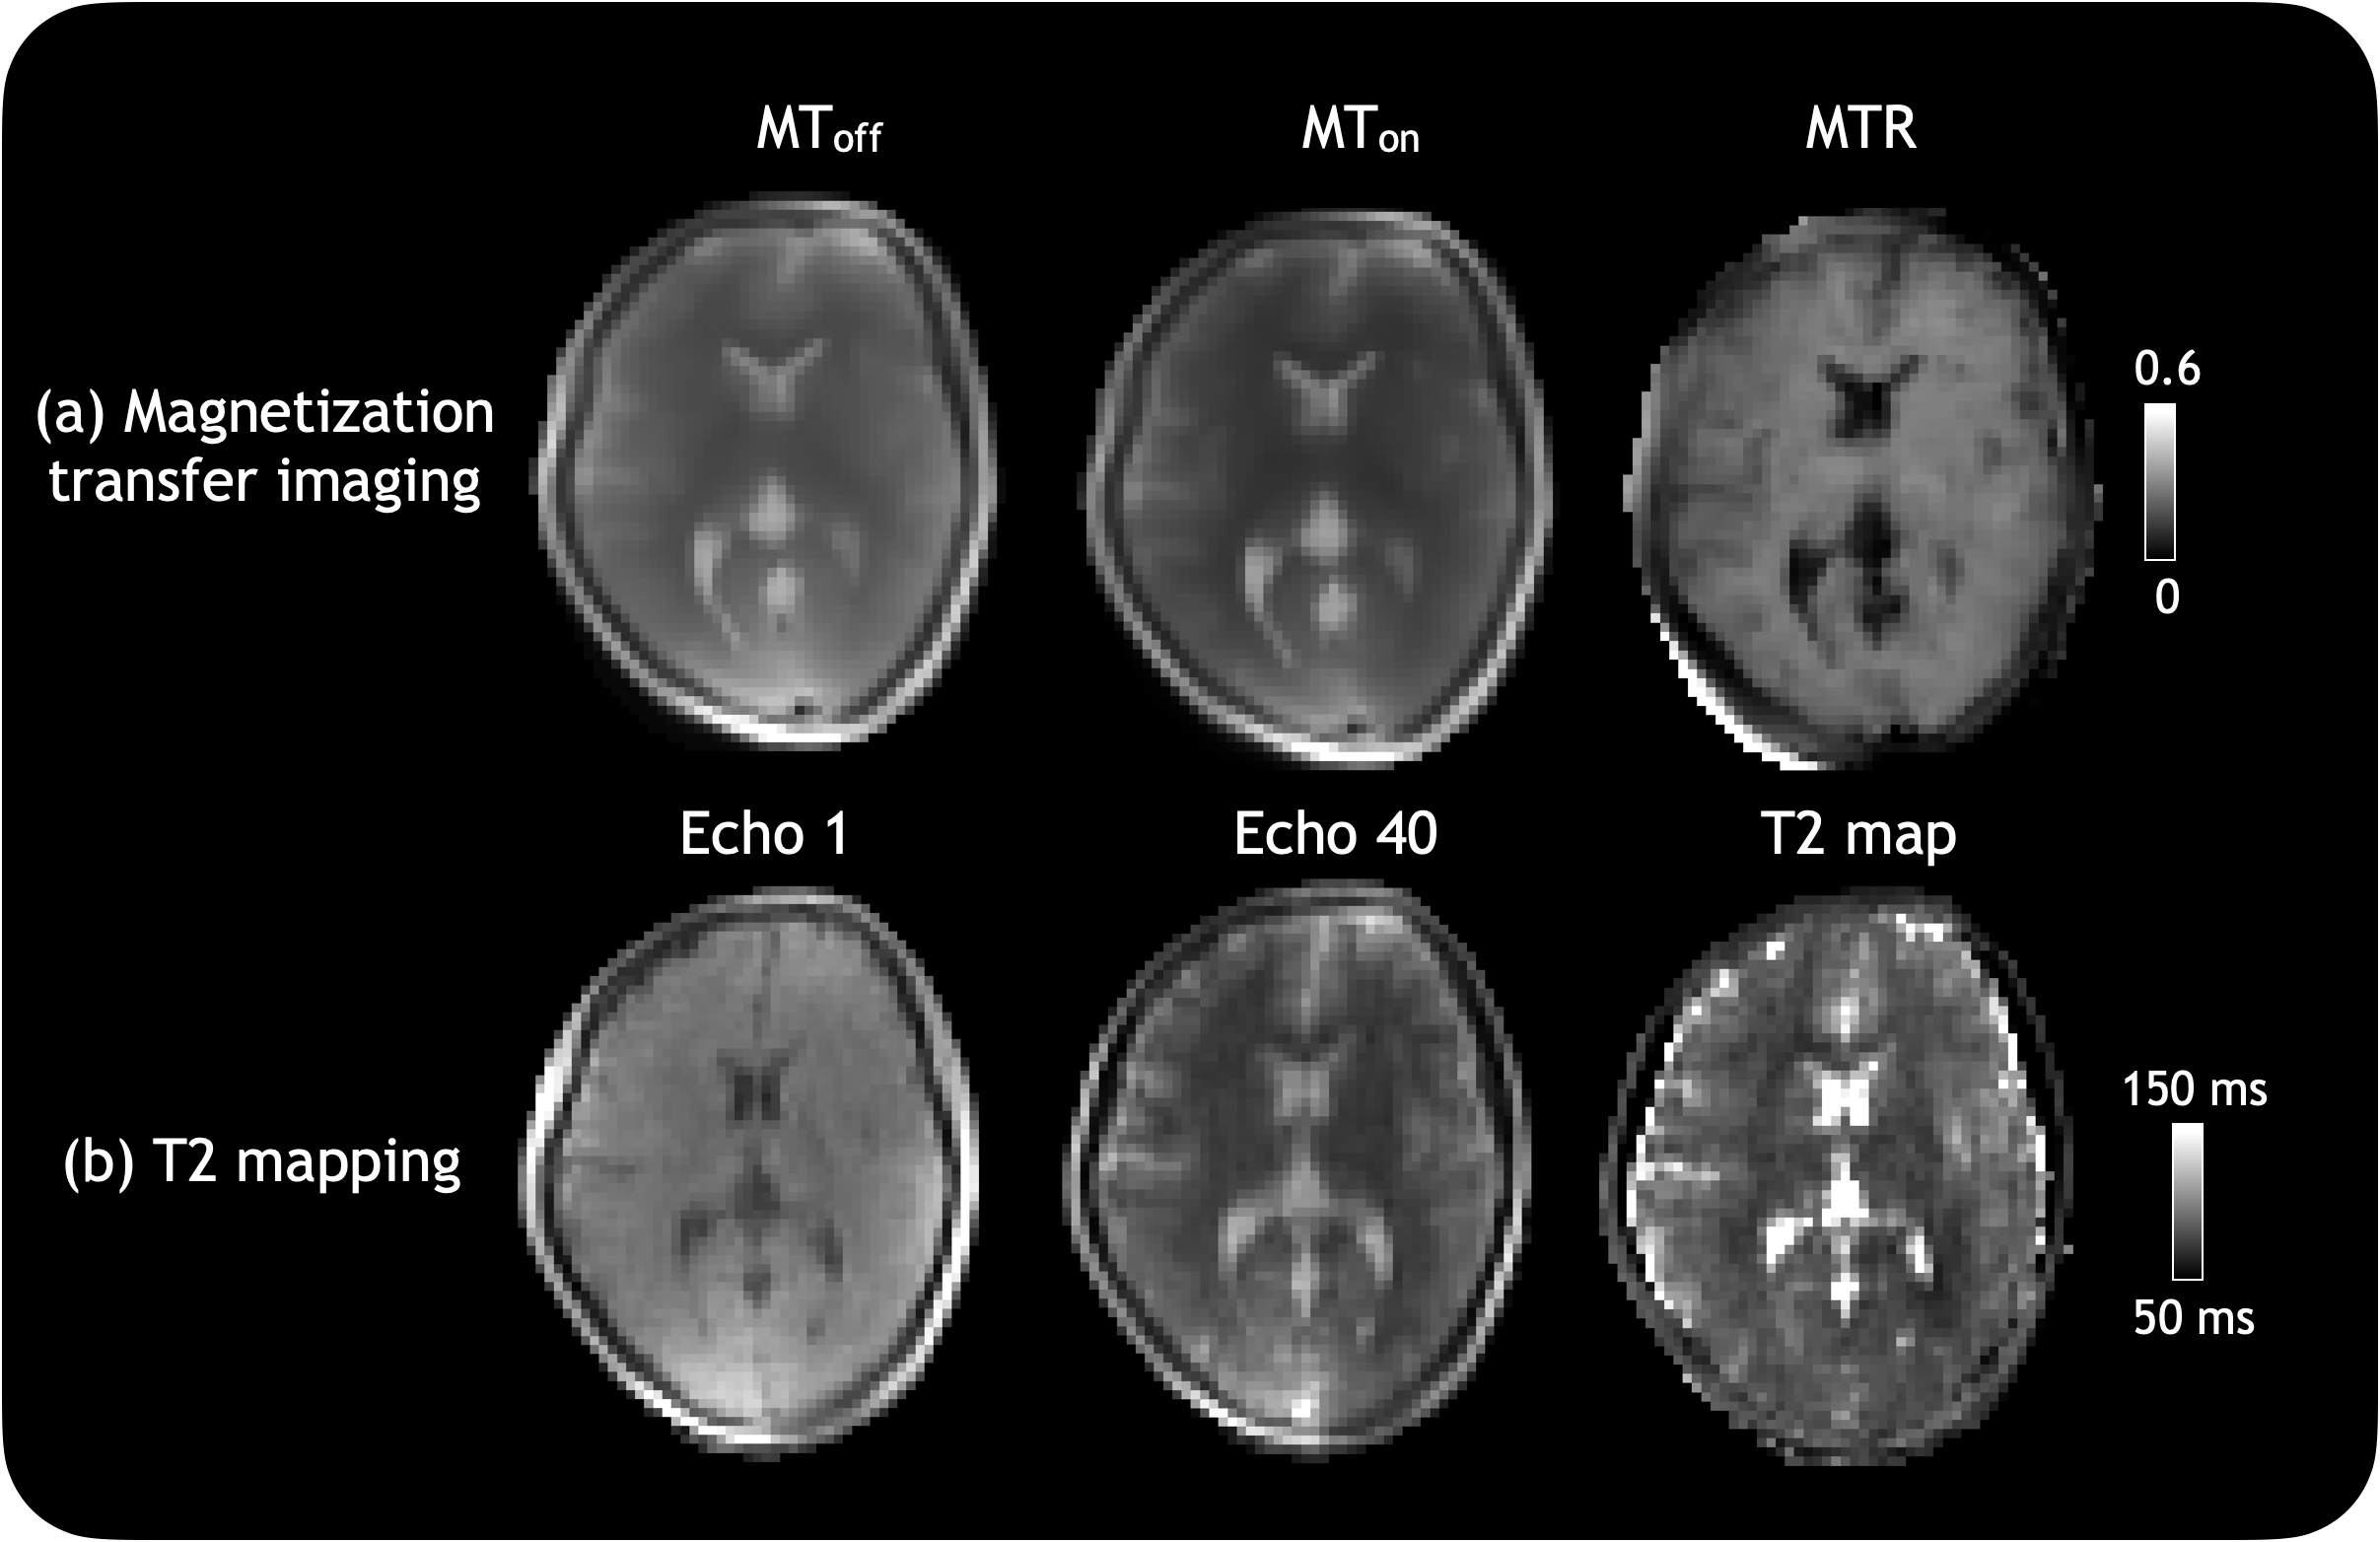
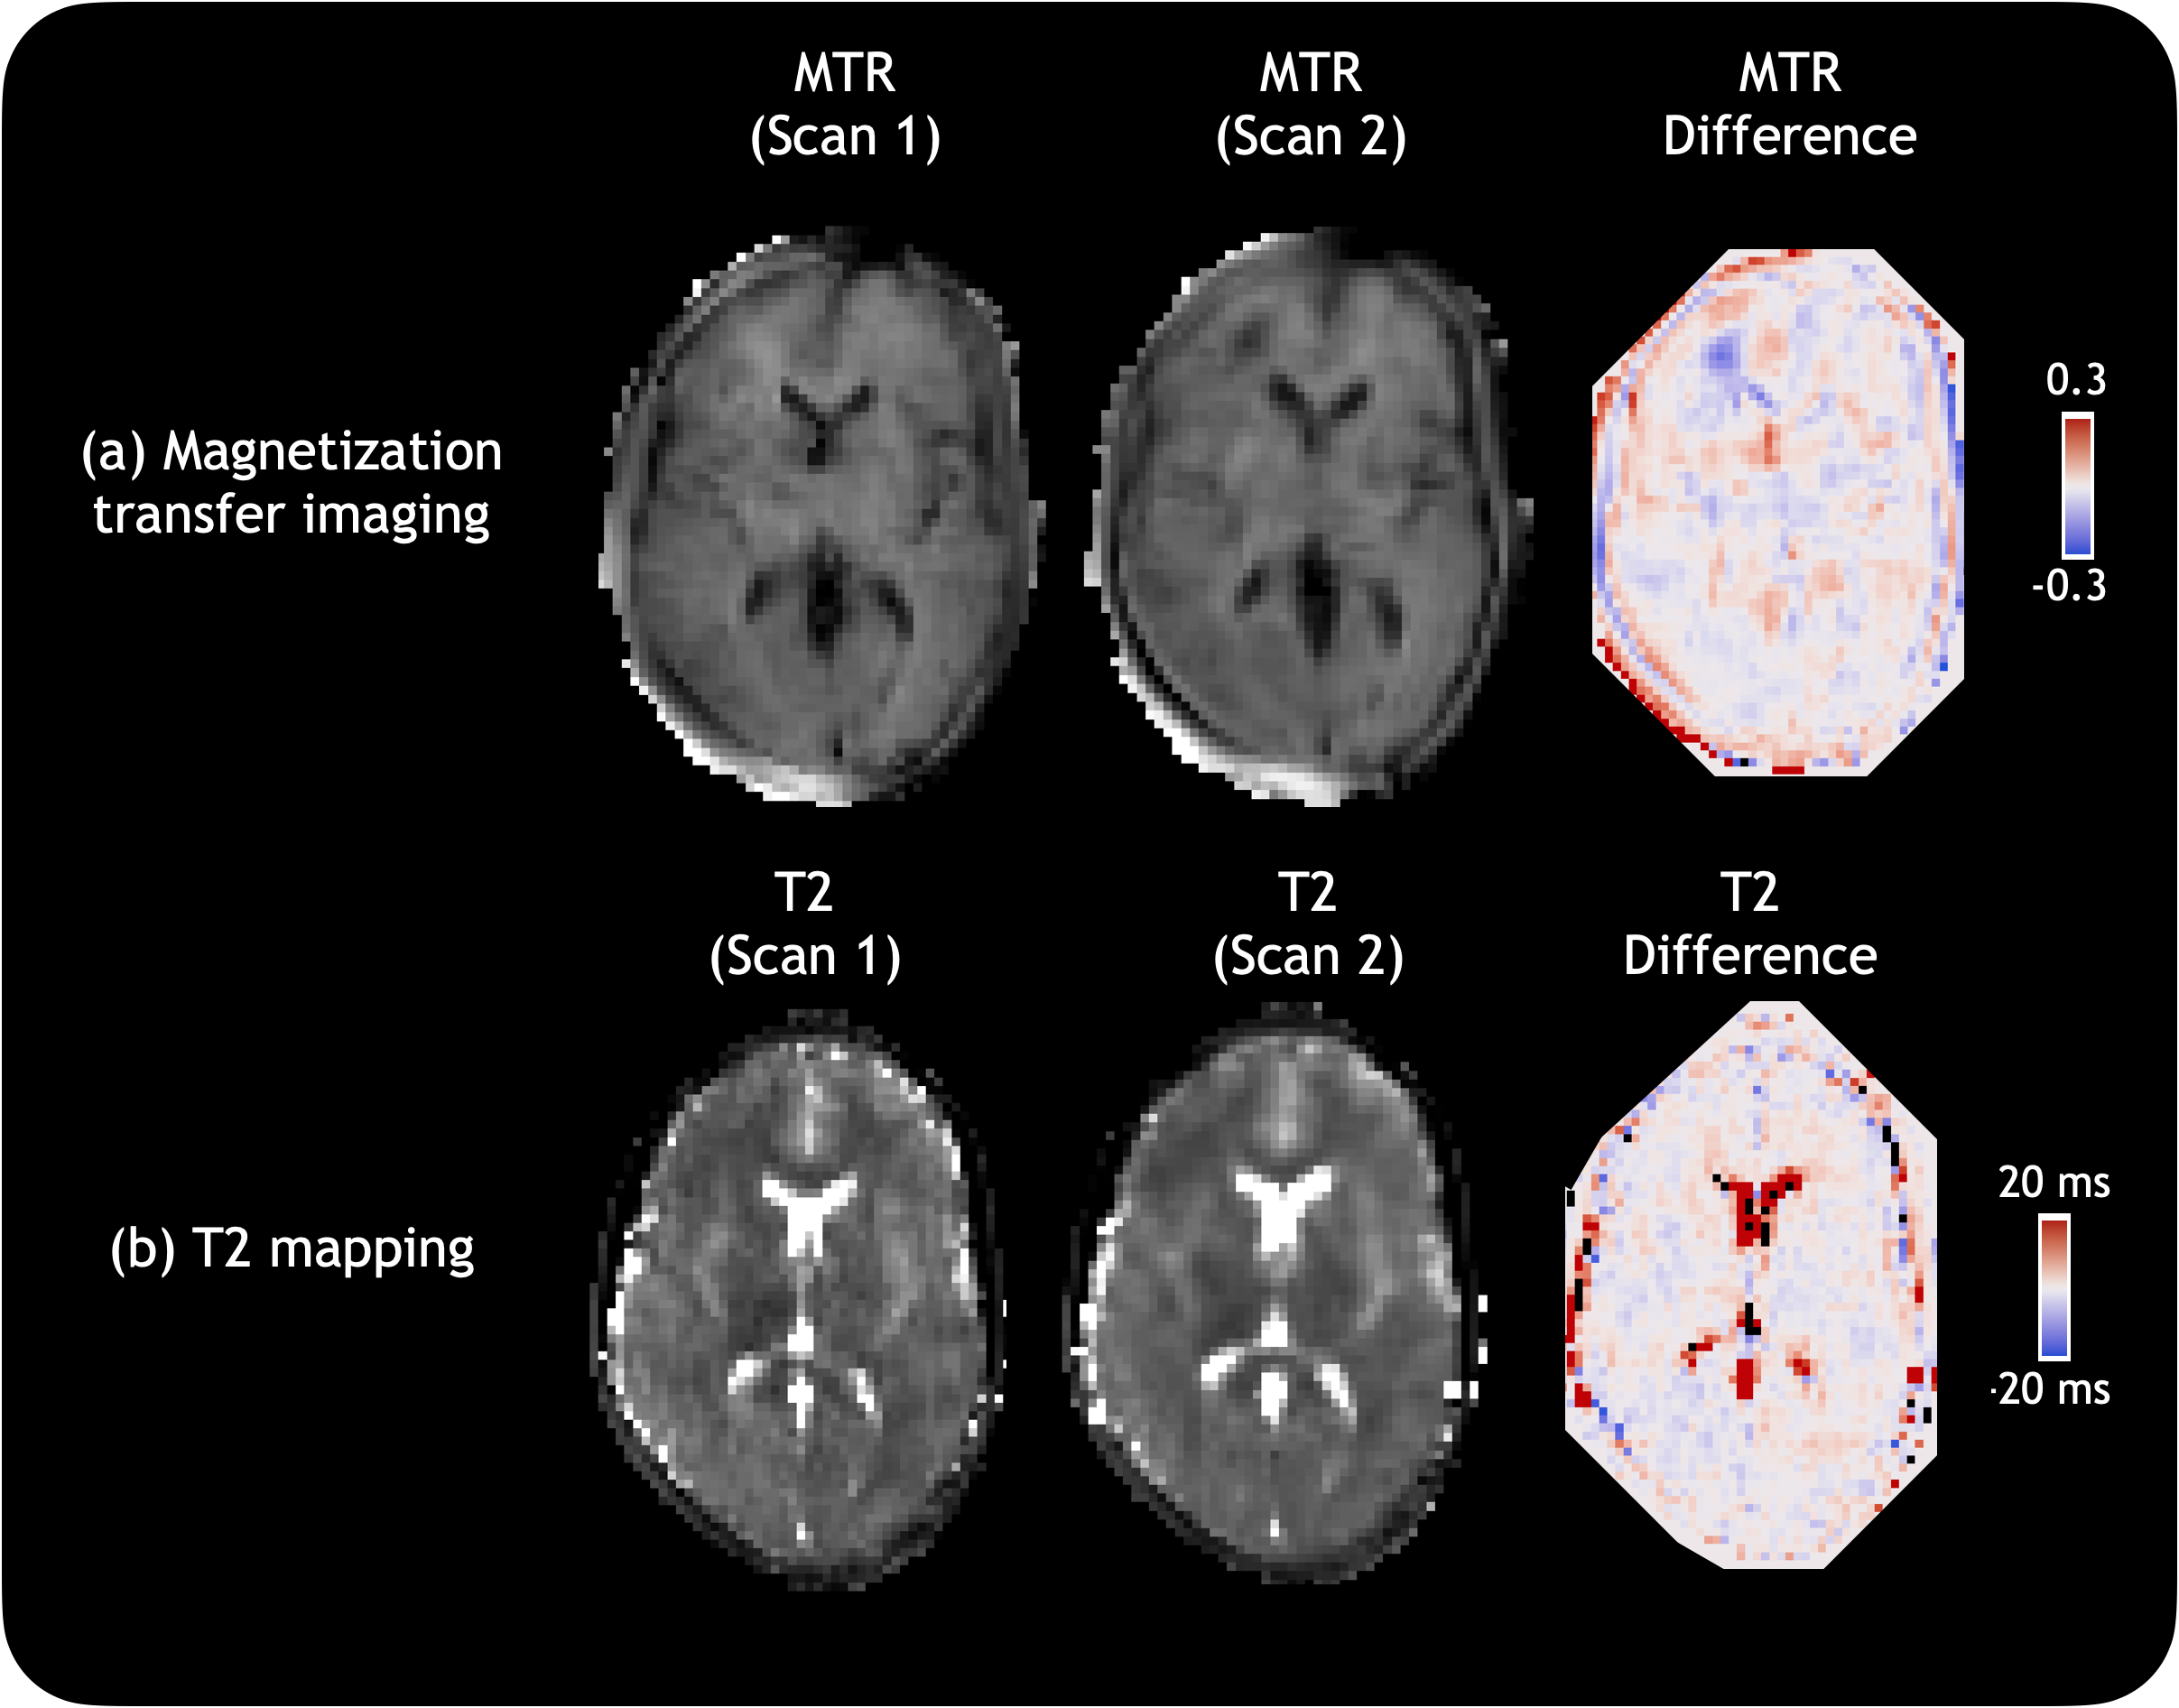
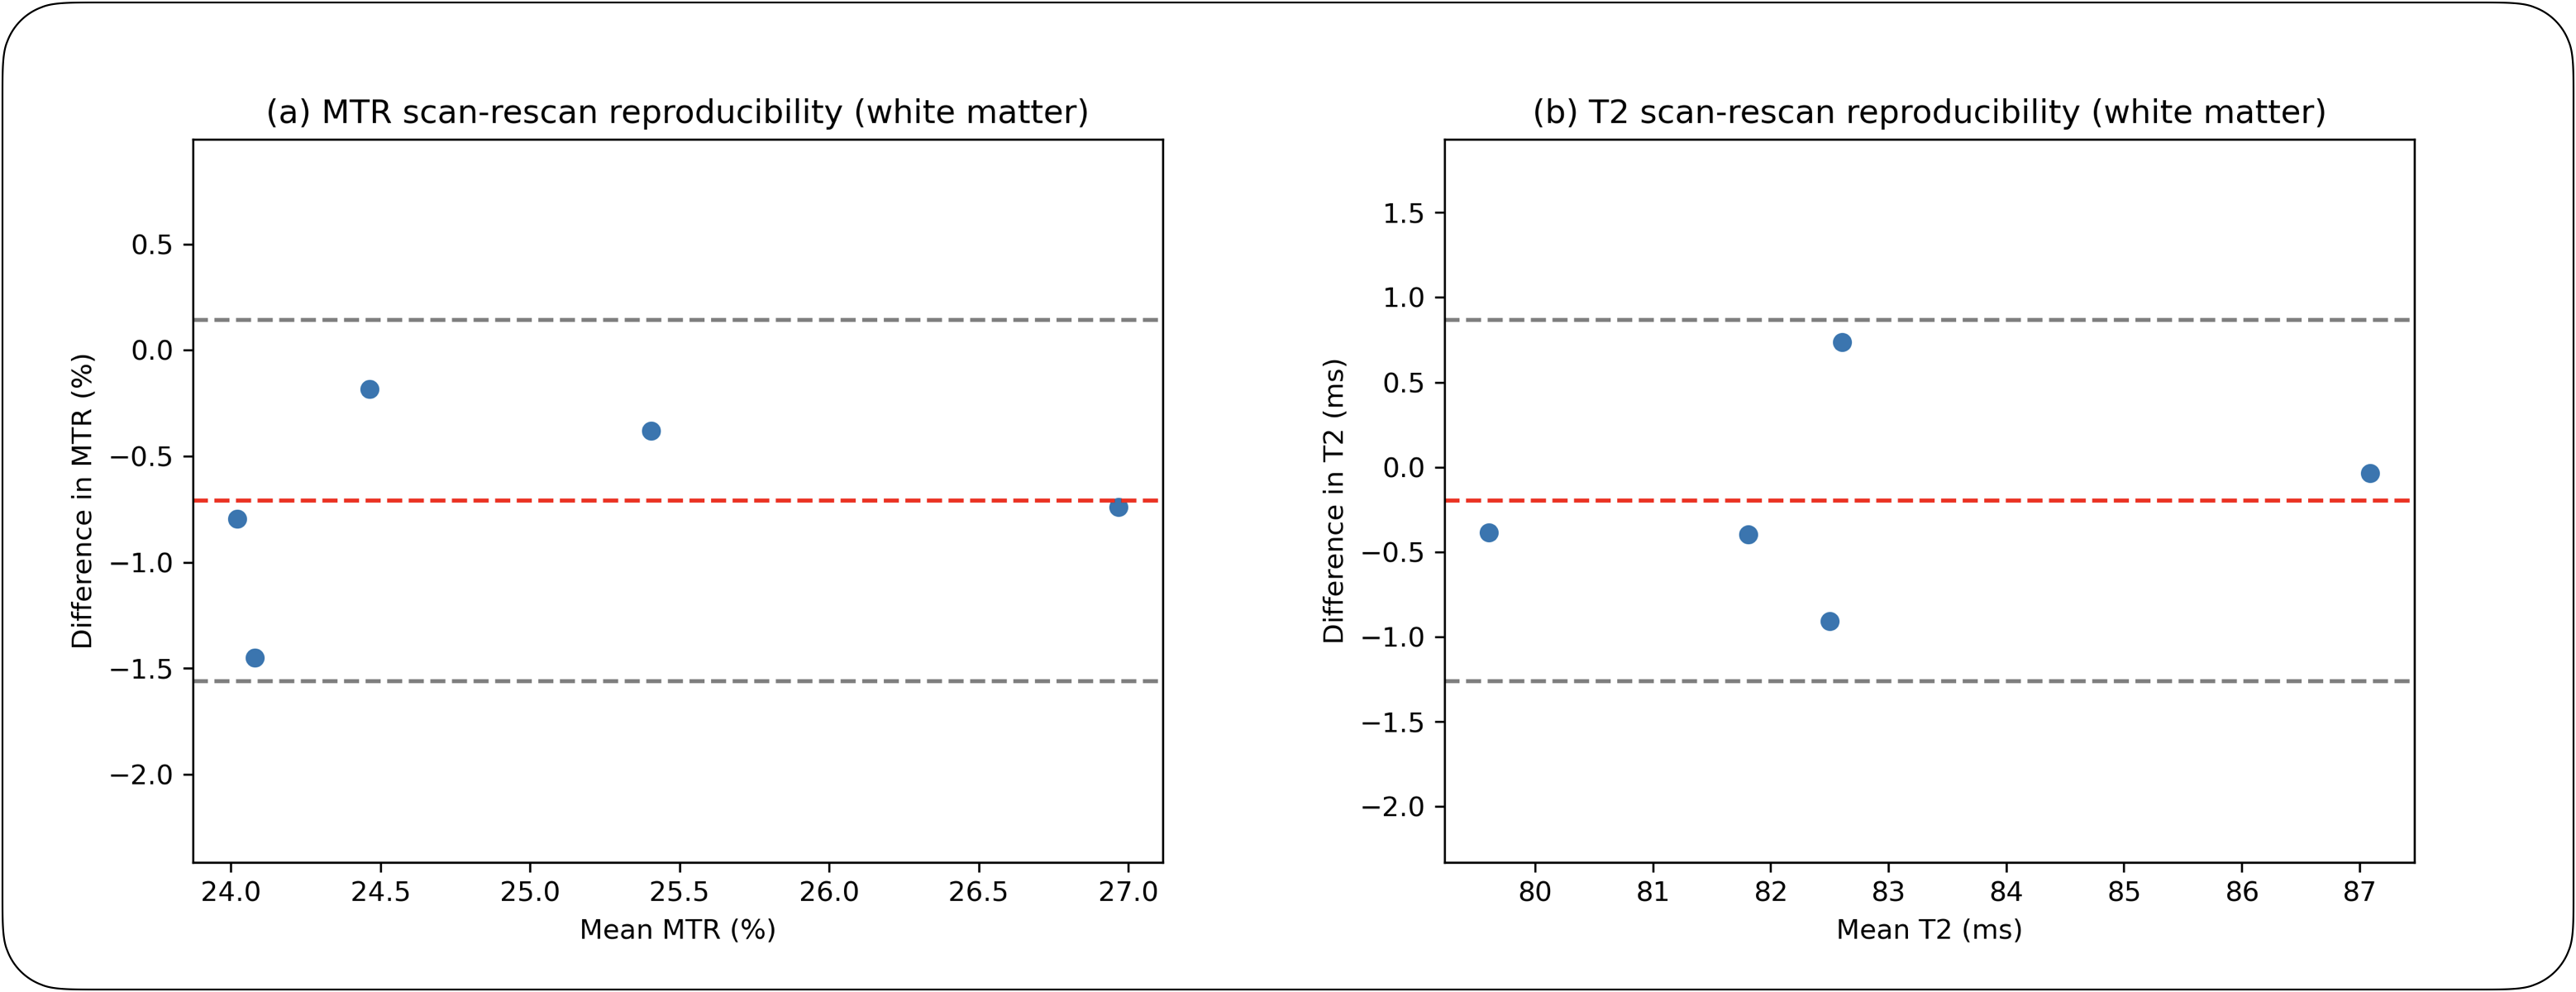
Figure 1 shows an example of constituent images of both the MT imaging and T2 mapping in a representative subject. Figure 2 shows difference images between two acquisitions of both the MTR map and T2 map in a representative subject. Figures 3 and 4 show whole brain and white matter histograms of MTR and T2 values from the repeated scans, from a representative subject. Figure 5 shows mean MTR and T2 values in white matter from all subjects, from both sets of scans. Mean±standard deviation for MTR in white matter was 0.256±0.012 across all subjects, and T2 in white matter was 82.9±2.6ms. Both measures showed strong correlation between the two scans (MTR: Pearson’s r=0.92, p=0.02, T2: Pearson’s r=0.97, p=0.004). MTR had an average scan-rescan coefficient of variation of 1.58% while T2 mapping had a variation of 0.33% upon repositioning.Discussion
The variability of metrics between, and reproducibility within, subjects was deemed sufficient to track neurodevelopment, and comparable to reproducibility at higher field strengths9,10. T2 values were in agreement with literature11.The two techniques assessed here were not without drawbacks. The low SNR in the MT sequences was a challenge when correcting environmental noise in the images, causing variability in image weighting if the signal was too near the RF noise floor. Since MTR is primarily a difference measure, this resulted in some inconsistency in MTR values. Increasing the inherent SNR of the acquisitions compared to previously reported parameters1 improved the reliability of MTR values. Future work will include combining MTon/MToff into a single acquisition to ensure consistent corrections between scans, and incorporating standard distortion correction into the reconstruction pipeline. The T2 mapping analysis was restricted to single-component fitting; future work will include modelling the accumulated phase errors along the echo train to enable multi-component fitting such as myelin water imaging. Finally, the large voxel sizes (3x3x5 mm3 for both sequences) caused partial voluming effects that resulted in larger spreads of all quantitative values; smaller voxel sizes can be used when greater resolution is required, although requiring longer acquisition times (e.g. 6.5 min for a 2x2x5 mm3 MTR acquisition). The advantages of ultra-low field strength (e.g. negligible SAR) can allow for further optimization of echo train lengths, TRs, and RF power depositions, which can also be used to improve these sequences in the future.
Conclusion
We evaluated the reliability of MTR and T2 values in 5 healthy volunteers at ultra-low field, finding the reproducibility sufficient for tracking neurodevelopment and neurodegeneration. This provides a reference point for future studies as part of the UNITY consortium.Acknowledgements
We thank the UNITY consortium and Hyperfine Inc for their support, and funding sources for this research (SB: Natural Sciences and Engineering Research Council Canada Graduate Scholarship- Doctoral, SHK: Bill and Melinda Gates Foundation, Brain Canada, EL: Bill and Melinda Gates Foundation, the Crafoord Foundation). FP, RPAGT and MEP are employed by Hyperfine Inc.References
1. Balaji S, Dvorak AV, Padormo F, Teixiera RPAG, Poorman ME, MacKay AL, Wood TC, Williams SCR, Deoni SCL, Kolind SHK, Ljungberg E. Magnetization Transfer Imaging using non-balanced SSFP at Ultra-Low Field. Proc Intl Soc Mag Reson Med 31 (2023):1586.
2. Dvorak AV, Balaji S, Poorman ME, Padormo F, Teixiera RPAG, Haskell M, Ragunathan S, Hollander WJ, MacKay AL, Williams SCR, Deoni SCL, Ljungberg E, Kolind SHK. Ultra-Low Field Quantitative T2 Mapping. Proc Intl Soc Mag Reson Med 31 (2023):0307.
3. Bieri, O., Mamisch, T.C., Trattnig, S. and Scheffler, K. (2008), Steady state free precession magnetization transfer imaging. Magn. Reson. Med., 60: 1261-1266. https://doi.org/10.1002/mrm.21781
4. BART Toolbox for Computational Magnetic Resonance Imaging, DOI: 10.5281/zenodo.592960
5. Manjón JV, Coupé P, Martí-Bonmatí L, Collins DL, Robles M. Adaptive non-local means denoising of MR images with spatially varying noise levels. J Magn Reson Imaging. 2010 Jan;31(1):192-203. doi: 10.1002/jmri.22003.
6. Dvorak AV, Kumar D, Zhang J, Gilbert G, Balaji S, Wiley N, Laule C, Moore GRW, MacKayAL, Kolind SH. The CALIPR framework for highly accelerated myelin water imaging with improved precision and sensitivity.Sci. Adv.9,eadh9853(2023).DOI:10.1126/sciadv.adh9853
7. Avants BB, Tustison NJ, Wu J, Cook PA, Gee JC. An open source multivariate framework for n-tissue segmentation with evaluation on public data. Neuroinformatics. 2011 Dec;9(4):381-400. doi: 10.1007/s12021-011-9109-y.
8. Avants BB, Tustison NJ, Song G, Cook PA, Klein A, Gee JC. A reproducible evaluation of ANTs similarity metric performance in brain image registration. Neuroimage. 2011 Feb 1;54(3):2033-44. doi: 10.1016/j.neuroimage.2010.09.025.
9. Meyers, S.M., Vavasour, I.M., Mädler, B., Harris, T., Fu, E., Li, D.K.B., Traboulsee, A.L., MacKay, A.L. and Laule, C. (2013), Multicenter measurements of myelin water fraction and geometric mean T2: Intra- and intersite reproducibility. J. Magn. Reson. Imaging, 38: 1445-1453. https://doi.org/10.1002/jmri.24106
10. Morris, SR, Vavasour, IM, Smolina, A, et al. Myelin biomarkers in the healthy adult brain: Correlation, reproducibility, and the effect of fiber orientation. Magn Reson Med. 2023; 89: 1809-1824. doi:10.1002/mrm.29552
11. Jordanova, K.V., Martin, M.N., Ogier, S.E. et al. In vivo quantitative MRI: T1 and T2 measurements of the human brain at 0.064 T. Magn Reson Mater Phy 36, 487–498 (2023). https://doi.org/10.1007/s10334-023-01095-x.
Figures