2825
In-vivo Magnetization Transfer neuroimaging at 46 mT1C.J. Gorter MRI Center, Radiology Department, Leids Universitair Medisch Centrum, Leiden, Netherlands
Synopsis
Keywords: Low-Field MRI, Magnetization transfer, Low Field MRI
Motivation: Here, we exploited the Low SAR in low-field MRI to study magnetization transfer (MT) , and potential to enhance brain tissue contrast, in particular between white and gray matter (challenging at low-field).
Goal(s): The study aimed to identify suitable MT settings and explore MT contrast in-vivo at 46 mT.
Approach: MT settings were optimized to minimize direct saturation and maximize MT contrast. With this setup, we scanned five volunteers at 46 mT and acquired additional 3T scans for two participants
Results: Optimal MT settings were defined in the phantom and in-vivo scans demonstrated the expected MT effects, and improved tissue contrast at 46 mT.
Impact: Magnetization transfer could be achieved off-resonance in-vivo at low-field MRI. It improves brain tissue contrast, in particular between white matter and gray matter, and has minimal direct saturation.
Introduction
The advancements in both software and hardware, along with improved image reconstruction and denoising techniques, have brought renewed interest in the application of low-field MRI in Point-of-care (POC) settings, thanks also to its reduced financial costs, portability, and accessibility[1]. Nevertheless, there are still potential areas not yet exploited. One significant advantage of low-field MRI is its low specific absorption rate (SAR)[2]. This allows the use of long off-resonance RF pulses for strong magnetization transfer (MT) saturation to achieve enhanced contrast in tissue and lesions[3]. For accurate off-resonance measurements, relatively high homogeneity is required. We previously showed that a Halbach-magnet array POC scanner with optimized ring diameters and magnet positions/orientations was sufficiently homogenous for this application[4]. In this study we characterized the settings for the MT experiment in a phantom and we explored the MT contrast in-vivo at 46 mT. Moreover, we qualitatively compared the low-field images with 3T scans.Methods
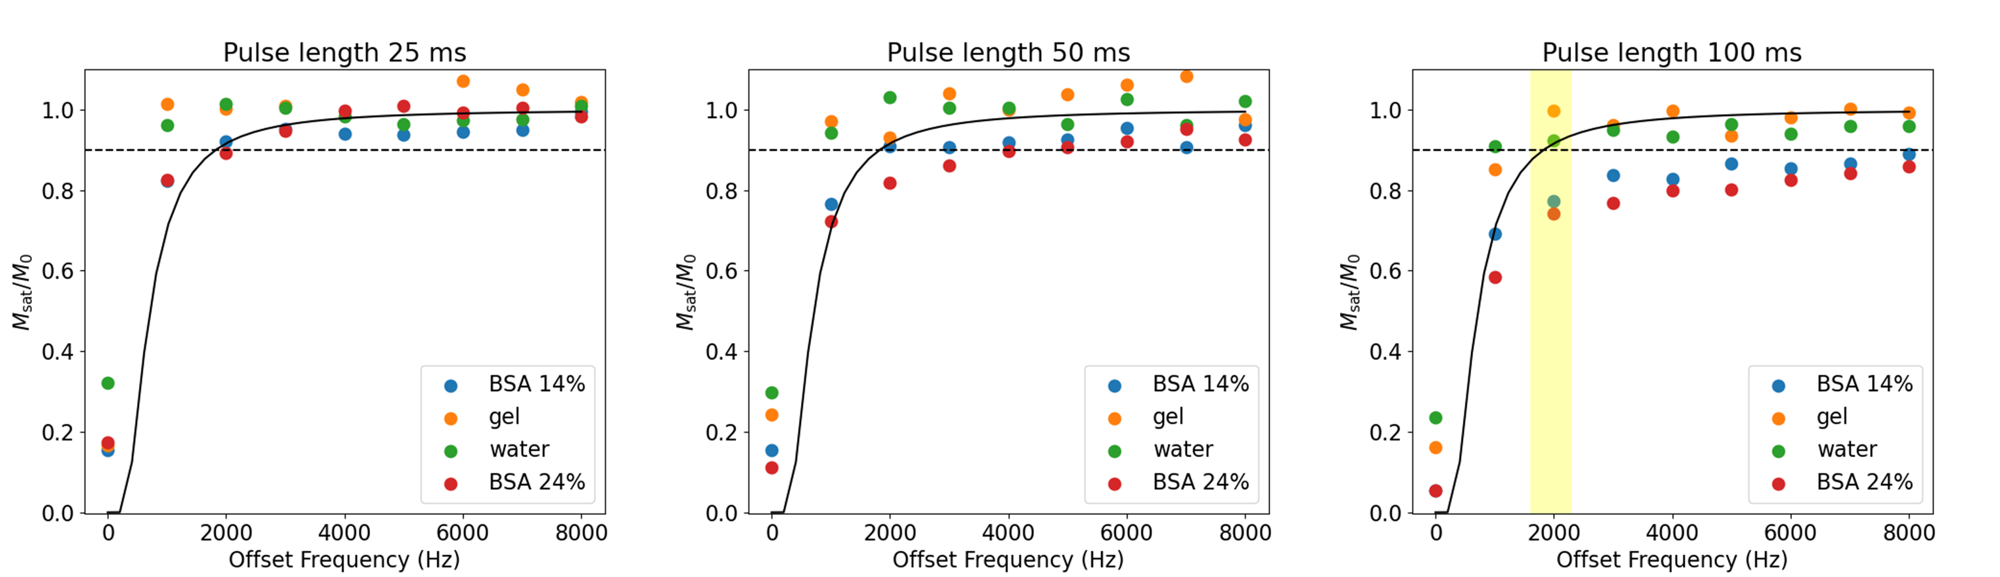
TheoryThe RF energy of the MT pulses is applied off-resonance, where it saturates some of the longitudinal magnetization of the macromolecular pool, while having hardly any effect on the liquid pool. Ideally, the MT pulse should not directly saturate any of the protons in the liquid pool, as that would reduce the SNR. The direct saturation Mdir and the saturation due to the true MT effect MMT together define the total saturation Msat=Mdirect+MMT. The degree of direct saturation of the liquid pool can be estimated assuming a Gaussian line shape: $$M_{direct}/M_0=exp(-(\gamma B_1\Delta\nu)^2 T_1/T_2 /2)$$
for a block pulse, with γ gyromagnetic ratio, B1 and $$$\Delta\nu$$$ the amplitude and frequency offset of the MT pulse, and T1,2 the relaxation times of the tissue of interest[5, 6].
Acquisition
Images were obtained using a 46 mT Halbach-magnet based MRI system using a Magritek Kea2 spectrometer[7]. A single transmit and receive solenoid and head coil were used for the phantom and in-vivo study, respectively. MT was implemented by applying off-resonance RF energy continuously, followed by a spoiler gradient.
For the phantom study, Msat and M0 were measured acquiring 9 spectra after the MT pulse with 1 kHz increment in the frequency offset in water, gel, cross-linked BSA[8] at 14% and 24% w/v. The first 2 tubes were used to check the direct saturation of the liquid pool, as they should show no MMT, and the BSA tubes should mimic the ratio T1/T2 and MTR expected in white and grey matter at low MR field. For the in-vivo study, 5 volunteers were scanned with the Halbach-magnet MRI 46 mT. The protocol involved two scans, with and without MT pulse, the specifics of which were chosen using the phantom study (hard pulse with B1=12 $$$\mu T$$$, $$$\Delta\nu=2$$$ kHz, MT pulse length =100 ms). After this premodule, a 3D turbo spin-echo (TSE) readout was used, with the following parameters: TR/TE: 1000/19 ms, echo train length: 7, 1.5x1.5x10 mm3 resolution, and acquisition bandwidth: 25 kHz. For comparison, two volunteers had an additional MT scan with a clinical 3T scanner (Philips Achieva), with MT pulse specifics: sinc-gauss pulse with 12 $$$\mu T$$$, $$$\Delta\nu=2$$$ kHz, MT pulse length.
Results
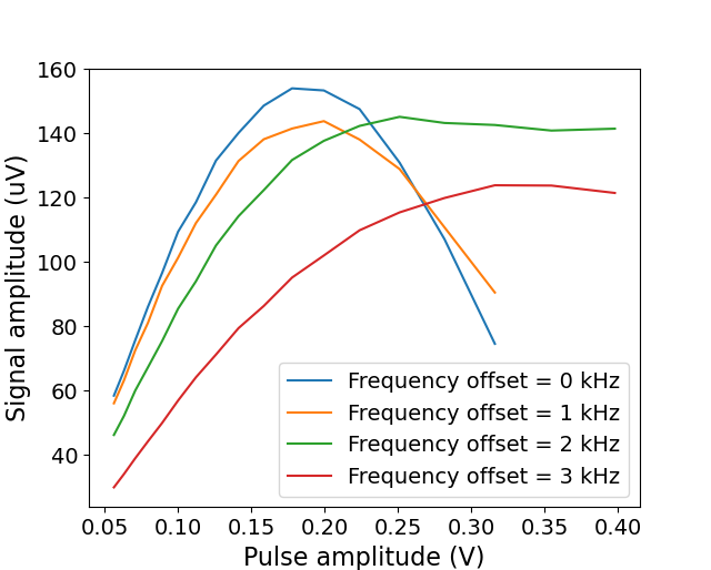
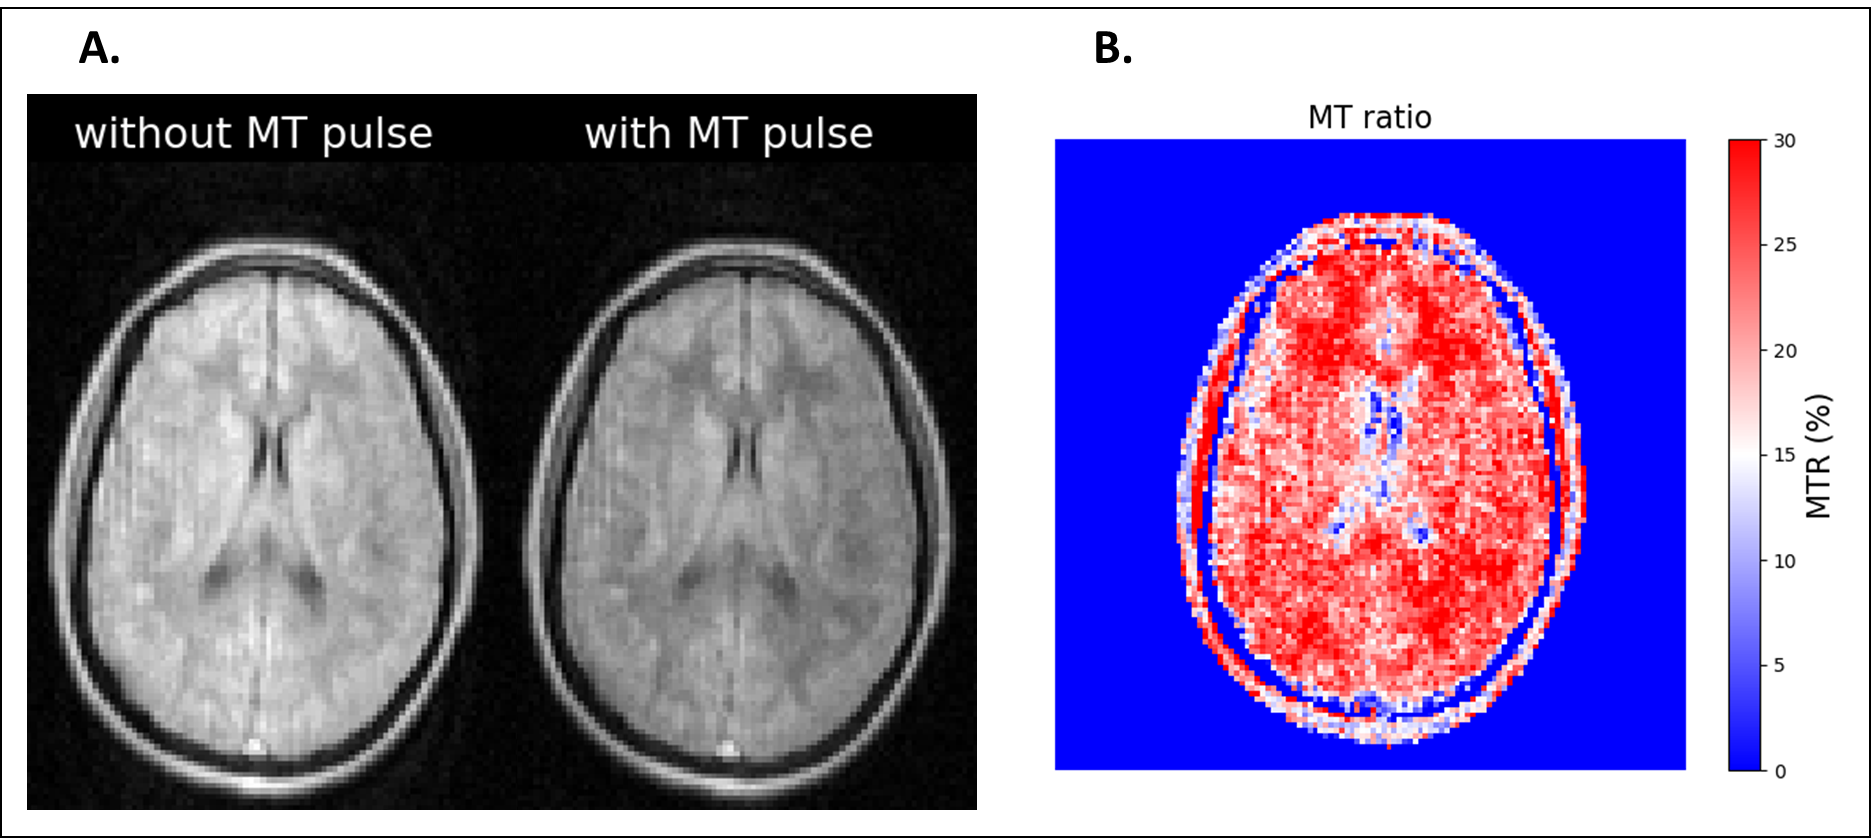
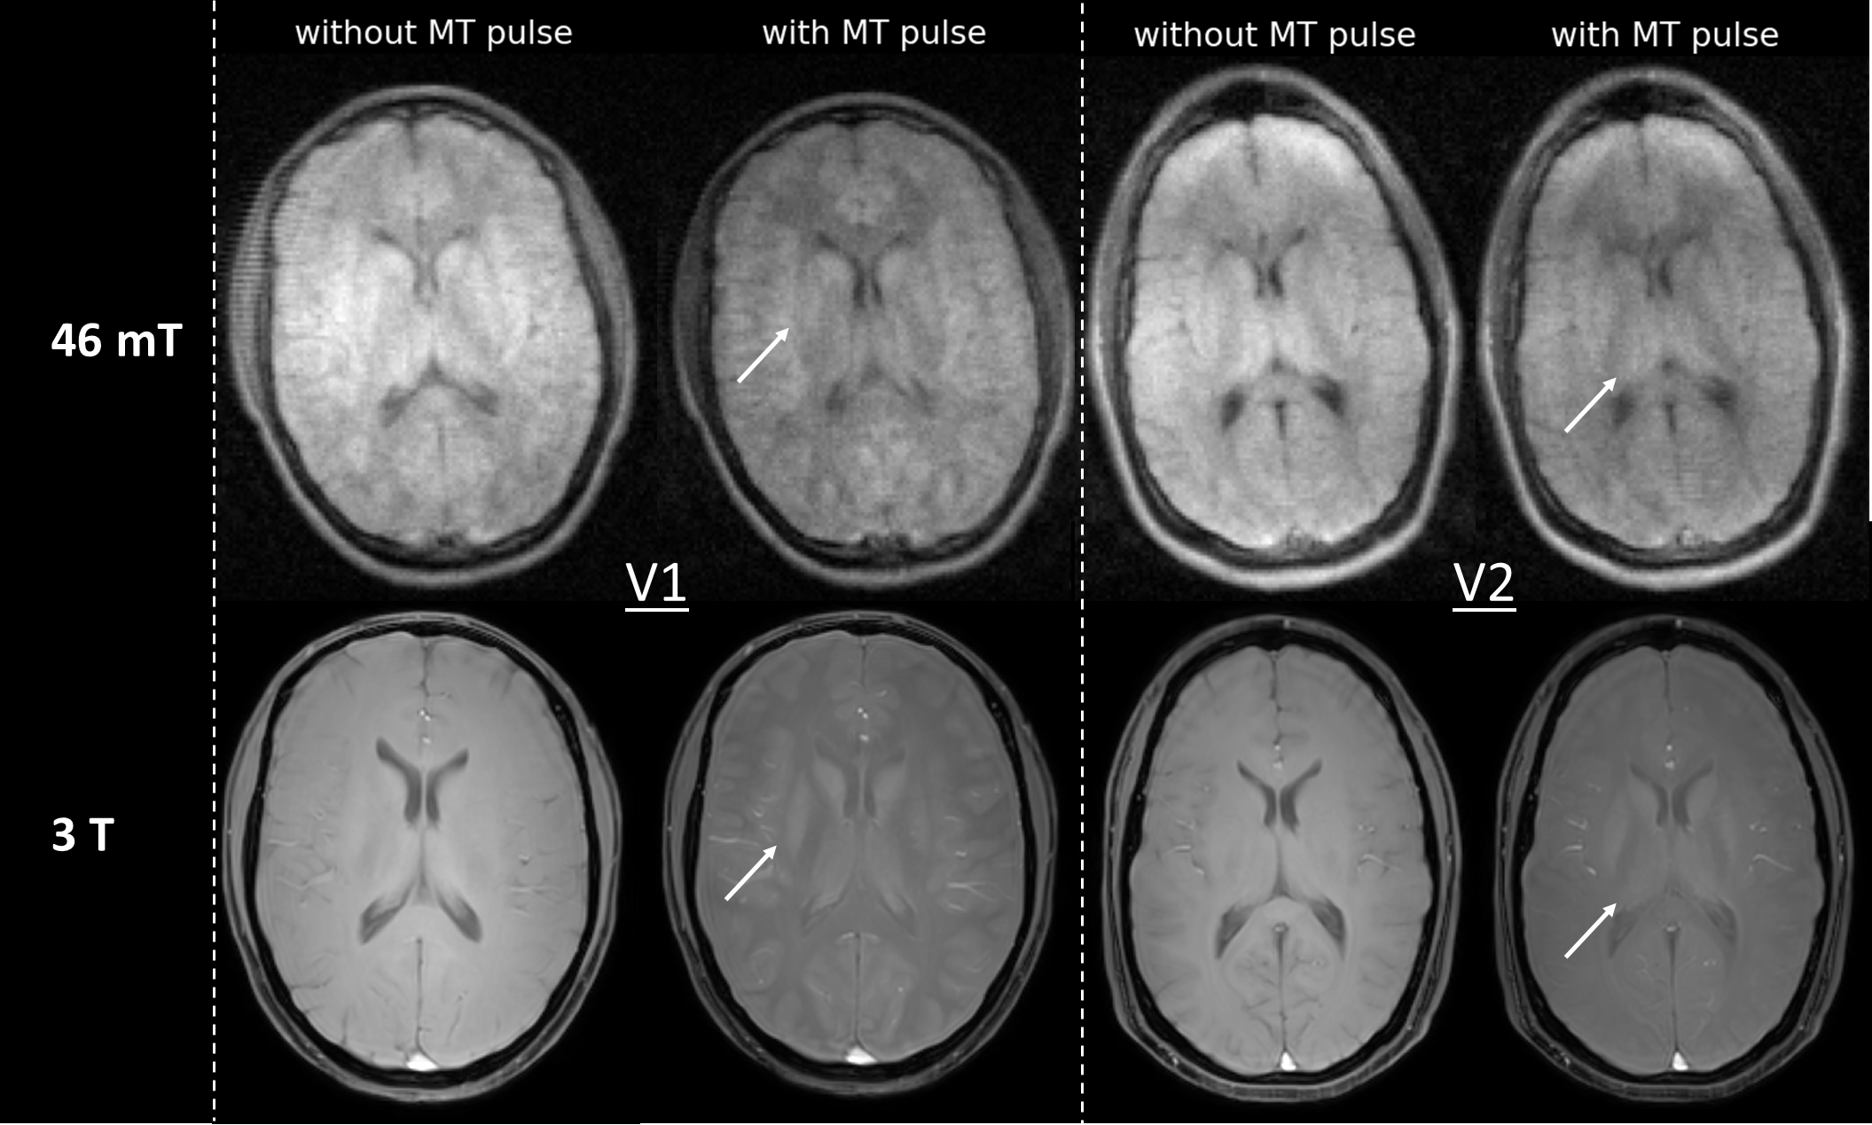
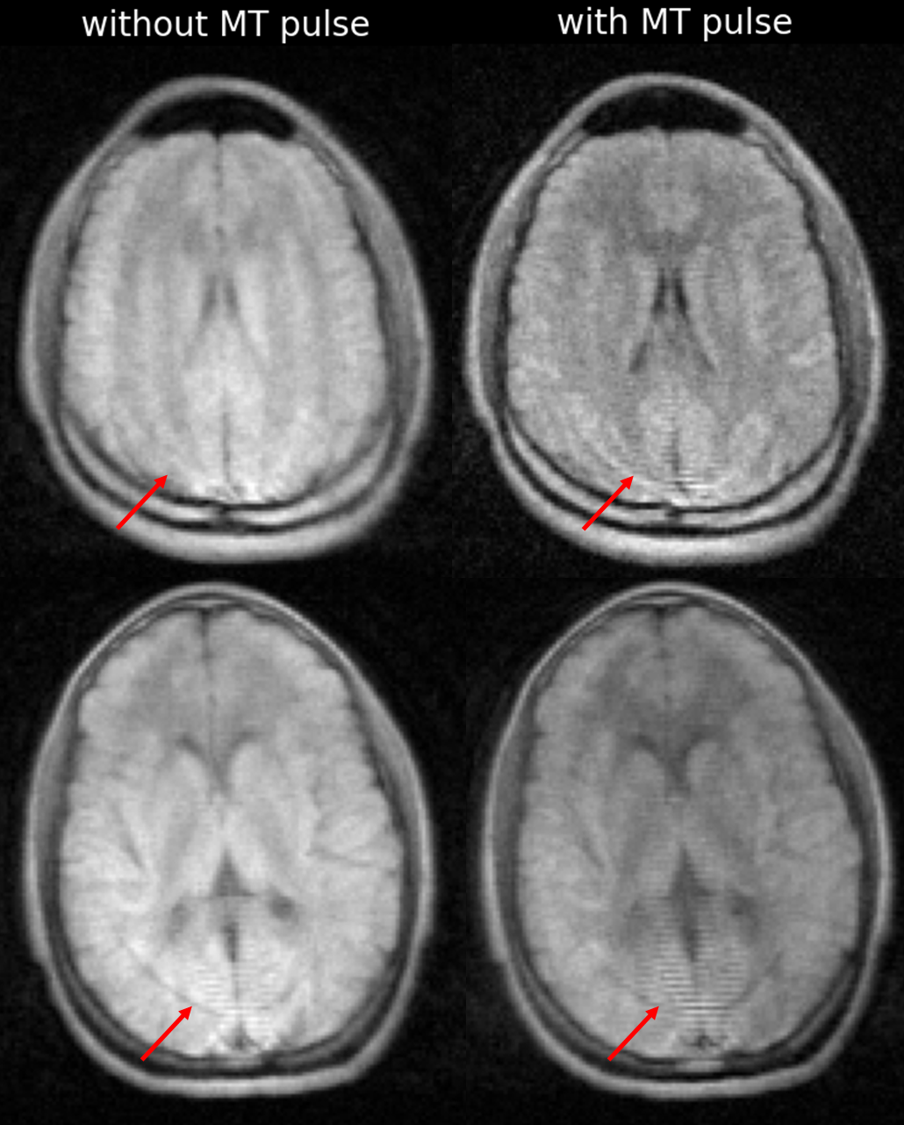
With a maximum of 10% of direct saturation, the optimal settings for the MT experiment in the phantom using a 15 $$$\mu T$$$ pulse was: $$$\Delta\nu=2$$$ kHz and MT pulse length=100 ms (Figure 1). Applied off-resonance, though, the effective B1 amplitude of the MT-pulse changes (Figure 2) due to the narrow bandwidth of the RF coil, resulting in this case in 12 $$$\mu T$$$, instead. In-vivo (Figure 3), signal reduction after the MT pulse was evident: the computed MT ratio map resulted in $$$28 \pm 2.5%$$$ in WM, $$$21 \pm 3.2%$$$ in GM and $$$6 \pm 3%$$$% in CSF (in line with the phantom experiment). Comparing 46 mT and 3T scans (Figure 4) in two volunteers, finer structures as deep grey matter appear more evidently on the MT scan in both cases. In general, MT scans enhance WM/GM contrast in all volunteers, also when artefacts were present (Figure 5).Discussions and Conclusions
In this study, we demonstrated how an appropriately selected MT prepulse before a standard sequence can enhance WM/GM tissue contrast. This is relevant especially at low-field MRI, where obtaining high WM/GM contrast can be challenging. It should be noted that MTR maps may be less useful at this field strength due to lower SNR and low-field MRI and more challenging computations (image registration is difficult with such a coarse slice thickness).Acknowledgements
This work was partly funded by the Dutch Science Foundation Open Technology 18981.References
1. Hori M, Hagiwara A, Goto M, et al (2021) Low-Field Magnetic Resonance Imaging Its History and Renaissance. https://doi.org/10.1097/RLI.0000000000000810
2. Marques JP, Simonis FFJ, Webb AG (2019) Low-field MRI: An MR physics perspective. Journal of Magnetic Resonance Imaging 49
3. de Boer RW (1995) Magnetization transfer contrast Part 2 : Clinical applications. Medica Mundi (Philips Healthcare)
4. Lena B, Najac C, Václavu L, et al (2023) T1ρ and magnetization transfer experiments on a point-of-care 46 mT MRI system. In: Proceedings of ISMRM ISMRT 32nd Annual Meeting
5. Morrison C, Stanisz G, Henkelman RM (1995) Modeling Magnetization Transfer for Biological-like Systems Using a Semi-solid Pool with a Super-Lorentzian Lineshape and Dipolar Reservoir. J Magn Reson B 108:. https://doi.org/10.1006/jmrb.1995.1111
6. Hajnal J V., Baudouin CJ, Oatridge A, et al (1992) Design and implementation of magnetization transfer pulse sequences for clinical use. J Comput Assist Tomogr 16:. https://doi.org/10.1097/00004728-199201000-00003
7. O’Reilly T, Webb A (2021) The design of a low-weight homogenous Halbach helmet for imaging the adult brain. In: Proceedings of 31st annual meeting of ISMRM & ISMRT
8. Koenig SH, Brown RD, Ugolini R (1993) Magnetization transfer in cross‐linked bovine serum albumin solutions at 200 MHz: A model for tissue. Magn Reson Med 29:. https://doi.org/10.1002/mrm.1910290306
Figures