2823
Vasuclar density mapping in AD mice with Super-resolution-resolved MION-based MRI1A.A. Martinos Center for Biomedical Imaging, Massachusetts General Hospital, Boston, MA, United States, 2Harvard Medical School, Boston, MA, United States
Synopsis
Keywords: Machine Learning/Artificial Intelligence, Vessels
Motivation: Altered angiogenesis is reported to be a key feature of vascular perturbation in AD brains.
Goal(s): There is missing global mapping tool to investigate the brain-wide vascular distribution pattern changes due to degenerative pathogenesis in AD brains.
Approach: Here, we applied the pre-trained 3D U-net to super-resolve iron-particle (MION)-based CBV images from 75µm to 37.5 µm.
Results: By performing voxel-wise differential vascular density mapping analysis, we have revealed AD-specific vascular distribution changes from in vivo MION-based MRI images.
Impact: We developed an ultra-high resolution MION-based vascular density mapping method to verify the altered brain-wide vascular distribution pattern in AD mice. Using a pre-trained 3D U-net neural network, we can produce vascular maps with super-resolved 37.5µm isotropic resolution.
Introduction
Novel ultrasound and optoacoustic imaging methodologies map the in vivo cerebrovasculature of mouse brains with ultra-high resolution2-4. Due to the complex vascular orientation and scanning probe geometric alignment, the missing vasculature from these imaging methods hinders their application to distinguish pathological vascular perturbation in AD brains. In contrast, MION-based MRI offers a more reliable brain-wide vascular mapping tool despite the lack of spatial resolution to detect individual capillaries. Previously, we have presented ultra-high resolution MION-based MRI images to segment the micro-vessels from anesthetized wild-type (WT) and AD mouse brains. Here, we created high-resolution vascular density maps and performed voxel-wise differential analysis between WT and AD mice to identify the altered vascular distribution patterns due to AD degeneration.Methods
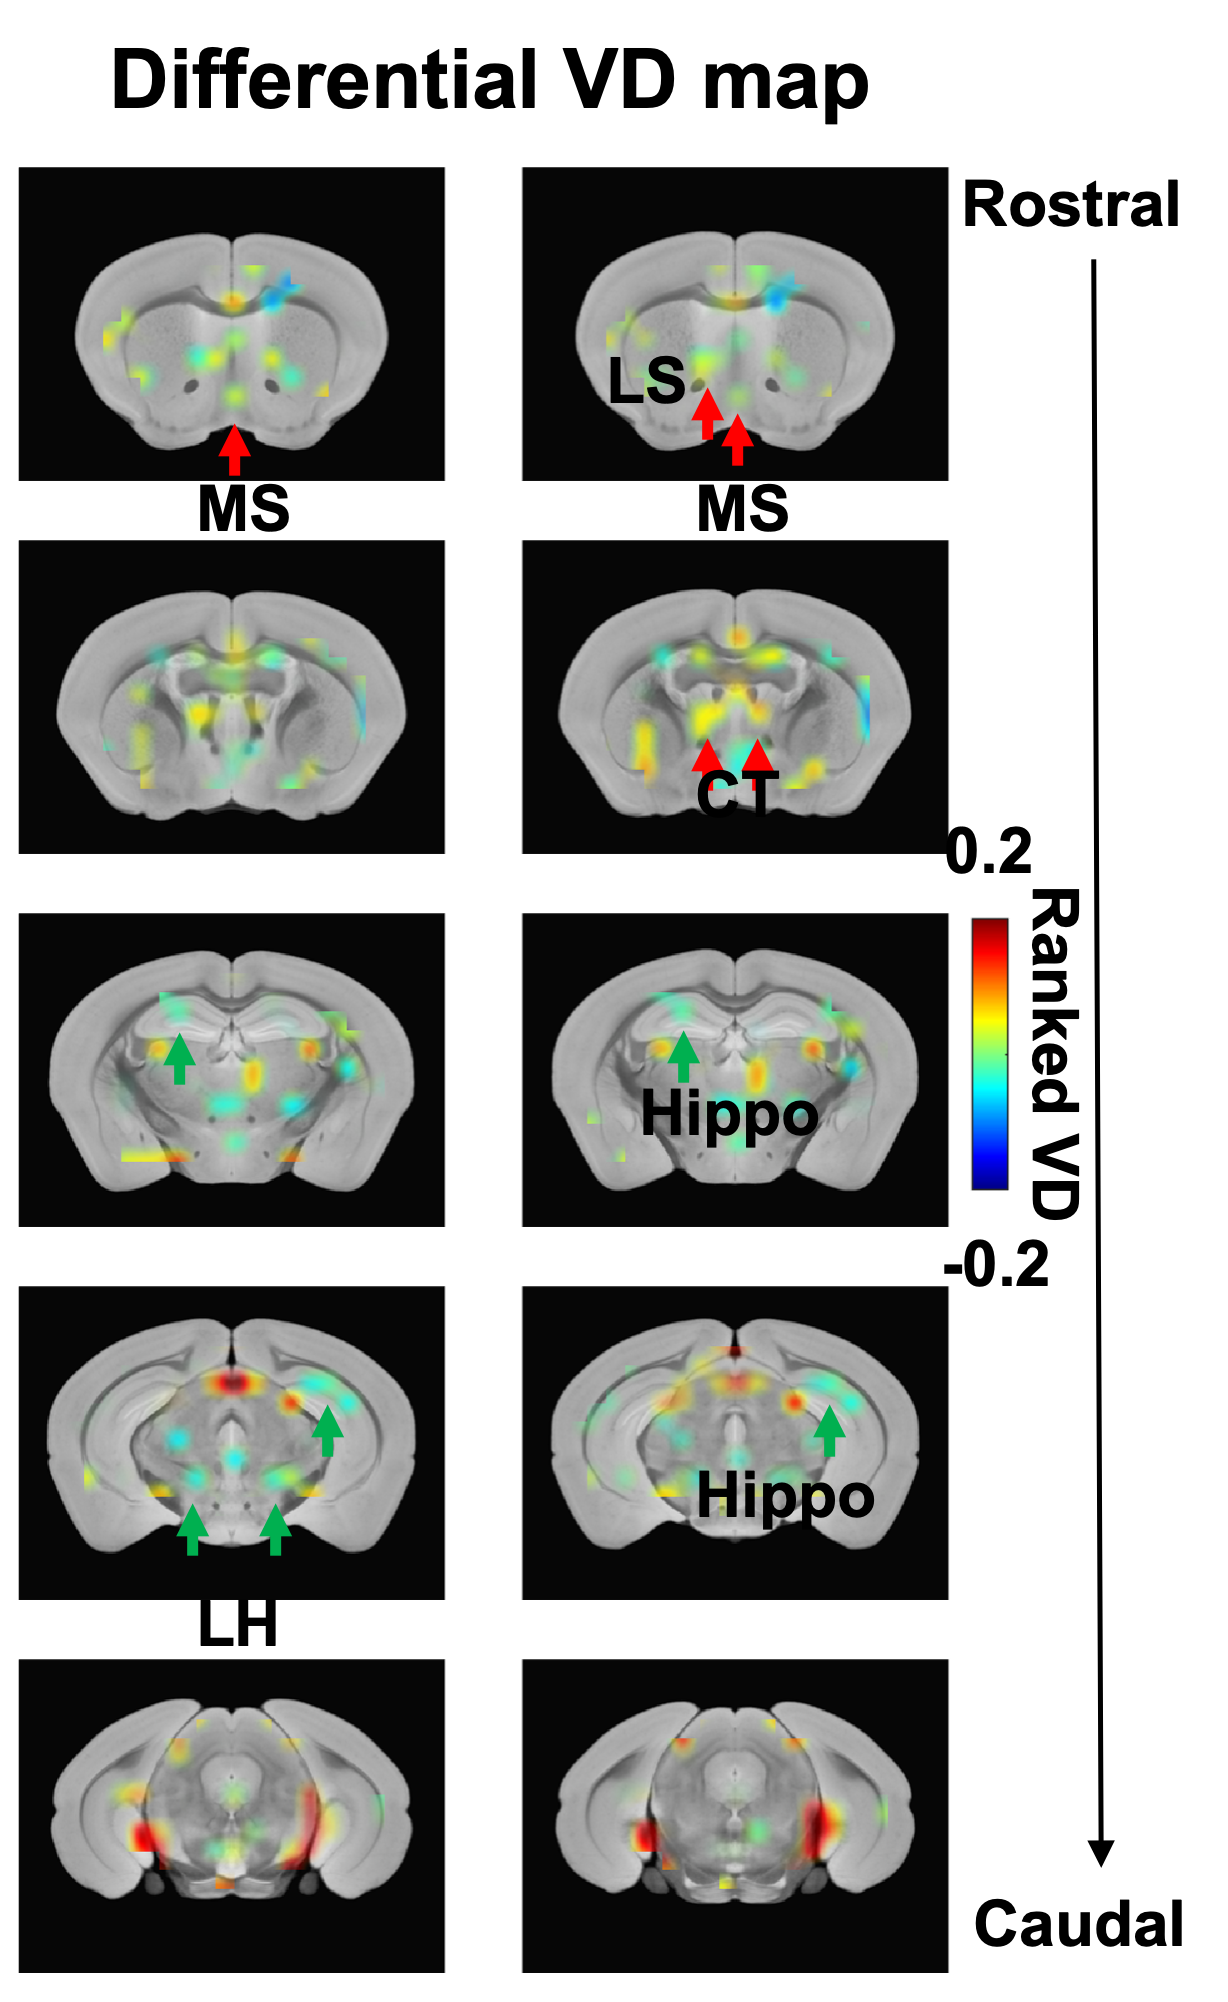
We used the 14T scanner equipped with a 1.2T/m gradient to acquire three sets of MION-based MRI datasets using 3D FLASH sequences (TR 200ms, TE, 4ms): (i) in-vivo ultra-high resolution brain image with 37.5 and 75 µm isotropic resolution for training; (ii) in vivo WT and (iii) AD mouse brain with 75µm isotropic resolution for super-resolution conversion. The super-resolution neural network is a 3D U-net, a type of convolutional neural network (CNN) with skip connections for dense prediction5,6. Our U-net has a lightweight architecture with three resolution levels, each with a convolutional layer with 32 features and a Leaky rectified linear unit7. The U-net was trained to super-resolve images by a factor of 2 in every dimension, from 75µ isotropic to 37.5µm isotropic. Specifically, it receives as input a trilinear upsampled image (i.e., living on a 37.5µm space, but with smooth, 75µm-like features), and estimates a residual that, when added to the input, produces a sharpened output. Training used the Adam optimizer8 to minimize the sum of absolute values (i.e., L1 norm) between the target and predicted residuals. Aggressive data augmentation was used during training, to mitigate the small size of the training dataset and improve generalization ability, including noise and bias field injection; contrast, brightness, and gamma modification; and geometric augmentation including rotation, shearing, scaling, and nonlinear deformation. The trained CNN was used to produce high-resolution images from the in vivo WT and AD mice. All of the high-resolution images were registered to the AMBMC template before further analysis. After removing the background signal obtained by Gaussian averaging, followed by sigmoid transform and fast non-local means denoising, the MRI images were segmented for blood vessels based on signal intensity. The obtained binary vessel segmentation mask was averaged using a sliding window of size 450x450x450µm to obtain the vessel density map. Then a voxel-wise t-test was applied to the WT and AD groups. The figure shows the differential vessel density map of WT vs AD brain (p<0.05, corrected).Results
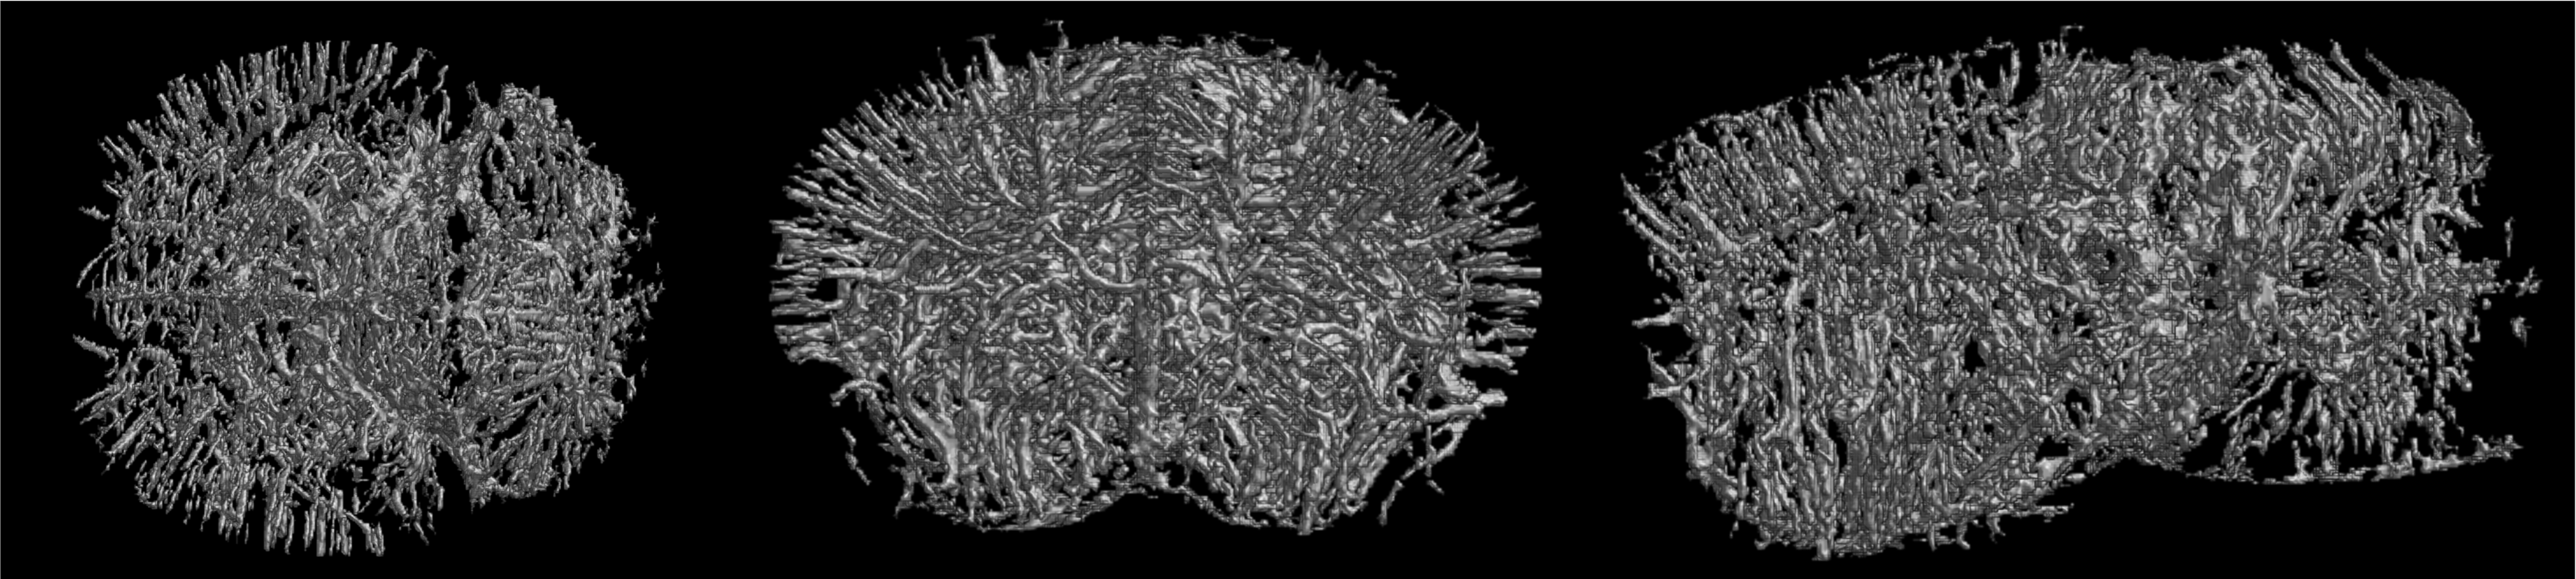
Based on the super-resolution processing, Fig 1 shows the 3D rendering of the segmented vascular maps from different viewpoints. Fig 2 shows differential vascular density maps between WT and AD mice, highlighting decreased vascular density in the medial septal area, central thalamus, hippocampus, and cingulate cortex, but increased vascular density in the hippocampus, hypothalamus, and posterior part of the basal forebrain. It should be noted that some of the hard spots (red-colored voxels) could originate from the accumulation of iron particles in the sinus area or choroid plexus of ventricles.Discussion
This preliminary result illustrated the MION-MRI-based vascular density mapping capability. This brain-wide in vivo vascular density mapping method can be used to identify the altered angiogenesis in AD mice due to pathogenesis. This mapping result is based on signal drop originating from blood iron particle-based T2* shortening. Individual micro-vessels can be identified based on the contrast in the ultra-high resolution MION-MRI images, providing means to estimate the vascular density from local brain regions.Conclusion and caveats
The vascular density map is based on the segmented blood vessels based on the MION contrast in the high-resolution images. The threshold used to segment blood vessels will provide specific criteria to choose a vessel with a certain size. Thus, the vascular density will be calculated based on the vessels segmented given its size. Meanwhile, the voxels not identified as vessel voxels could contain vessels with smaller sizes, as well as capillaries. This offers us an opportunity to compare the size-specific (or vascular component-specific) vascular density pattern differences between WT and AD mice.Acknowledgements
This research was funded by by Alzheimer’s association (AARFD-23-1145375), NIH funding (RF1NS113278, RF1NS124778, R01NS122904, R01NS120594, R21NS121642), NSF grant 2123971, and the S10 instrument grant (S10 MH124733–01) to Martinos Center.References
1. Frangi, A. F., Niessen, W. J., Vincken, K. L. & Viergever, M. A. in Medical Image Computing and Computer-Assisted Intervention — MICCAI’98. (eds William M. Wells, Alan Colchester, & Scott Delp) 130-137 (Springer Berlin Heidelberg).
2. Renaudin, N. et al. Functional ultrasound localization microscopy reveals brain-wide neurovascular activity on a microscopic scale. Nature methods 19, 1004-1012, doi:10.1038/s41592-022-01549-5 (2022).
3. Zhu, X. et al. Real-time whole-brain imaging of hemodynamics and oxygenation at micro-vessel resolution with ultrafast wide-field photoacoustic microscopy. Light: Science & Applications 11, 138, doi:10.1038/s41377-022-00836-2 (2022).
4. Lu, W. et al. Photoacoustic imaging of living mouse brain vasculature using hollow gold nanospheres. Biomaterials 31, 2617-2626, doi:https://doi.org/10.1016/j.biomaterials.2009.12.007 (2010).
5. Çiçek, Ö., Abdulkadir, A., Lienkamp, S. S., Brox, T. & Ronneberger, O. in Medical Image Computing and Computer-Assisted Intervention – MICCAI 2016. (eds Sebastien Ourselin et al.) 424-432 (Springer International Publishing).
6. Ronneberger, O., Fischer, P. & Brox, T. in Medical Image Computing and Computer-Assisted Intervention – MICCAI 2015. (eds Nassir Navab, Joachim Hornegger, William M. Wells, & Alejandro F. Frangi) 234-241 (Springer International Publishing).
7. Maas, A. L., Hannun, A.Y. and Ng, A.Y. in Proceedings of the 30th International Conference on Machine Learning Vol. 28 (2013).
8. Kingma, D. & Ba, J. Adam: A Method for Stochastic Optimization. International Conference on Learning Representations (2014).
Figures