2822
Fast, High-resolution Whole Brain SWI and QSM with CAIPIRINHA 3D-EPI and Deep Learning Reconstruction1Siemens Healthcare, Brisbane, Australia, 2Siemens Healthcare, Erlangen, Germany, 3The University of Queensland, Brisbane, Australia
Synopsis
Keywords: Machine Learning/Artificial Intelligence, Susceptibility, 3DEPI, SWI, QSM, Deep-Learning
Motivation: There is a strong clinical desire to accelerate the established SWI protocols. The clinical adoption of quantitative susceptibility maps (QSM) is hindered in part by long scan time and cumbersome offline QSM processing.
Goal(s): This study aims to substantially accelerate the SWI/QSM acquisitions while providing high-quality inline SWI/QSM images.
Approach: A flow-compensated, CAIPIRINHA-accelerated 3D echo-planar imaging (3DEPI) sequence was used to create 1-minute protocols with matching resolution to conventional sequences. Deep-learning reconstruction and super-resolution were used to enhance image quality.
Results: Compared with the established approach, the 1-minute 3D-EPI protocols provided 4× to 6× speed-up, while the DL reconstruction provided superior image quality.
Impact: Besides the general improvement in throughput, the 1-minute SWI protocols with improved image quality may enhance the role of MRI-SWI in acute care. The high-quality in-line QSM and susceptibility map weighted images (SWMI) will facilitate their clinical evaluation and adoption.
INTRODUCTION
Susceptibility weighted imaging (SWI) is a mature technique that combines the T2*w magnitude and filtered-phase images from a 3D gradient echo (GRE) sequence to visualize the influence of local magnetic field changes in tissues1. SWI is playing an increasingly important role in visualizing pathological conditions, such as stroke, vascular malformation, neurodegenerative disorders and tumour2. The more recently developed quantitative susceptibility mapping (QSM) technique is based on the same GRE sequence, but aims to better differentiate paramagnetic tissues from diamagnetic tissues by quantifying their effects on the measured phase3.The sensitivity to tissue susceptibility changes increases with echo times (TE). Hence, TEs are typically long for SWI and QSM (e.g., TE optimized for SWI are approximately 40ms and 20ms for 1.5T and 3T, respectively3,4). As a result, scan times can be as long as 5-10 minutes using a gradient echo (GRE) sequence and there is a strong clinical desire to shorten the scan time without compromising image quality. Besides long scan time, clinical adoption of QSM is further hindered by the lack of inline QSM processing. In this work, we aim to substantially accelerate the high-resolution SWI/QSM acquisitions and provide inline QSM processing, while using deep learning (DL) reconstruction to enhance image quality.
METHODS
All experiments were performed on a 3T clinical scanner (MAGNETOM Vida, Siemens Healthcare, Erlangen, Germany) with two healthy volunteers. This study employed a segmented, flow-compensated 3DEPI research sequence that is highly flexible in EPI factor, acceleration and CAIPIRINHA sampling patterns5,6. The magnitude and phase images are reconstructed inline using either GRAPPA or DL7 based reconstruction and the research sequence offers further inline processing, including SWI, minimum intensity projection (mIP), QSM and a susceptibility map weighted image (SMWI)8. The in-line QSM processing is largely replicating the methods from the off-line QSM pipeline QSMxT9.The DL reconstruction comprises two independent, sequential processing steps. Firstly, images are generated on the acquired resolution using a variational network architecture with six iterations that alternate between parallel imaging reconstruction and 3D image regularizations using U-nets7. The network parameters were determined through supervised training based on about 500 fully sampled 3D datasets of head, abdomen and pelvis from healthy volunteers (no 3DEPI data included). Secondly, the obtained images were interpolated using a DL-based super-resolution algorithm10, with a factor-of-two interpolation in all spatial dimensions. Both steps were implemented in PyTorch, trained on a dedicated GPU cluster and with networks exported for prospective use in the scanner reconstruction pipeline.
RESULTS and DISCUSSION
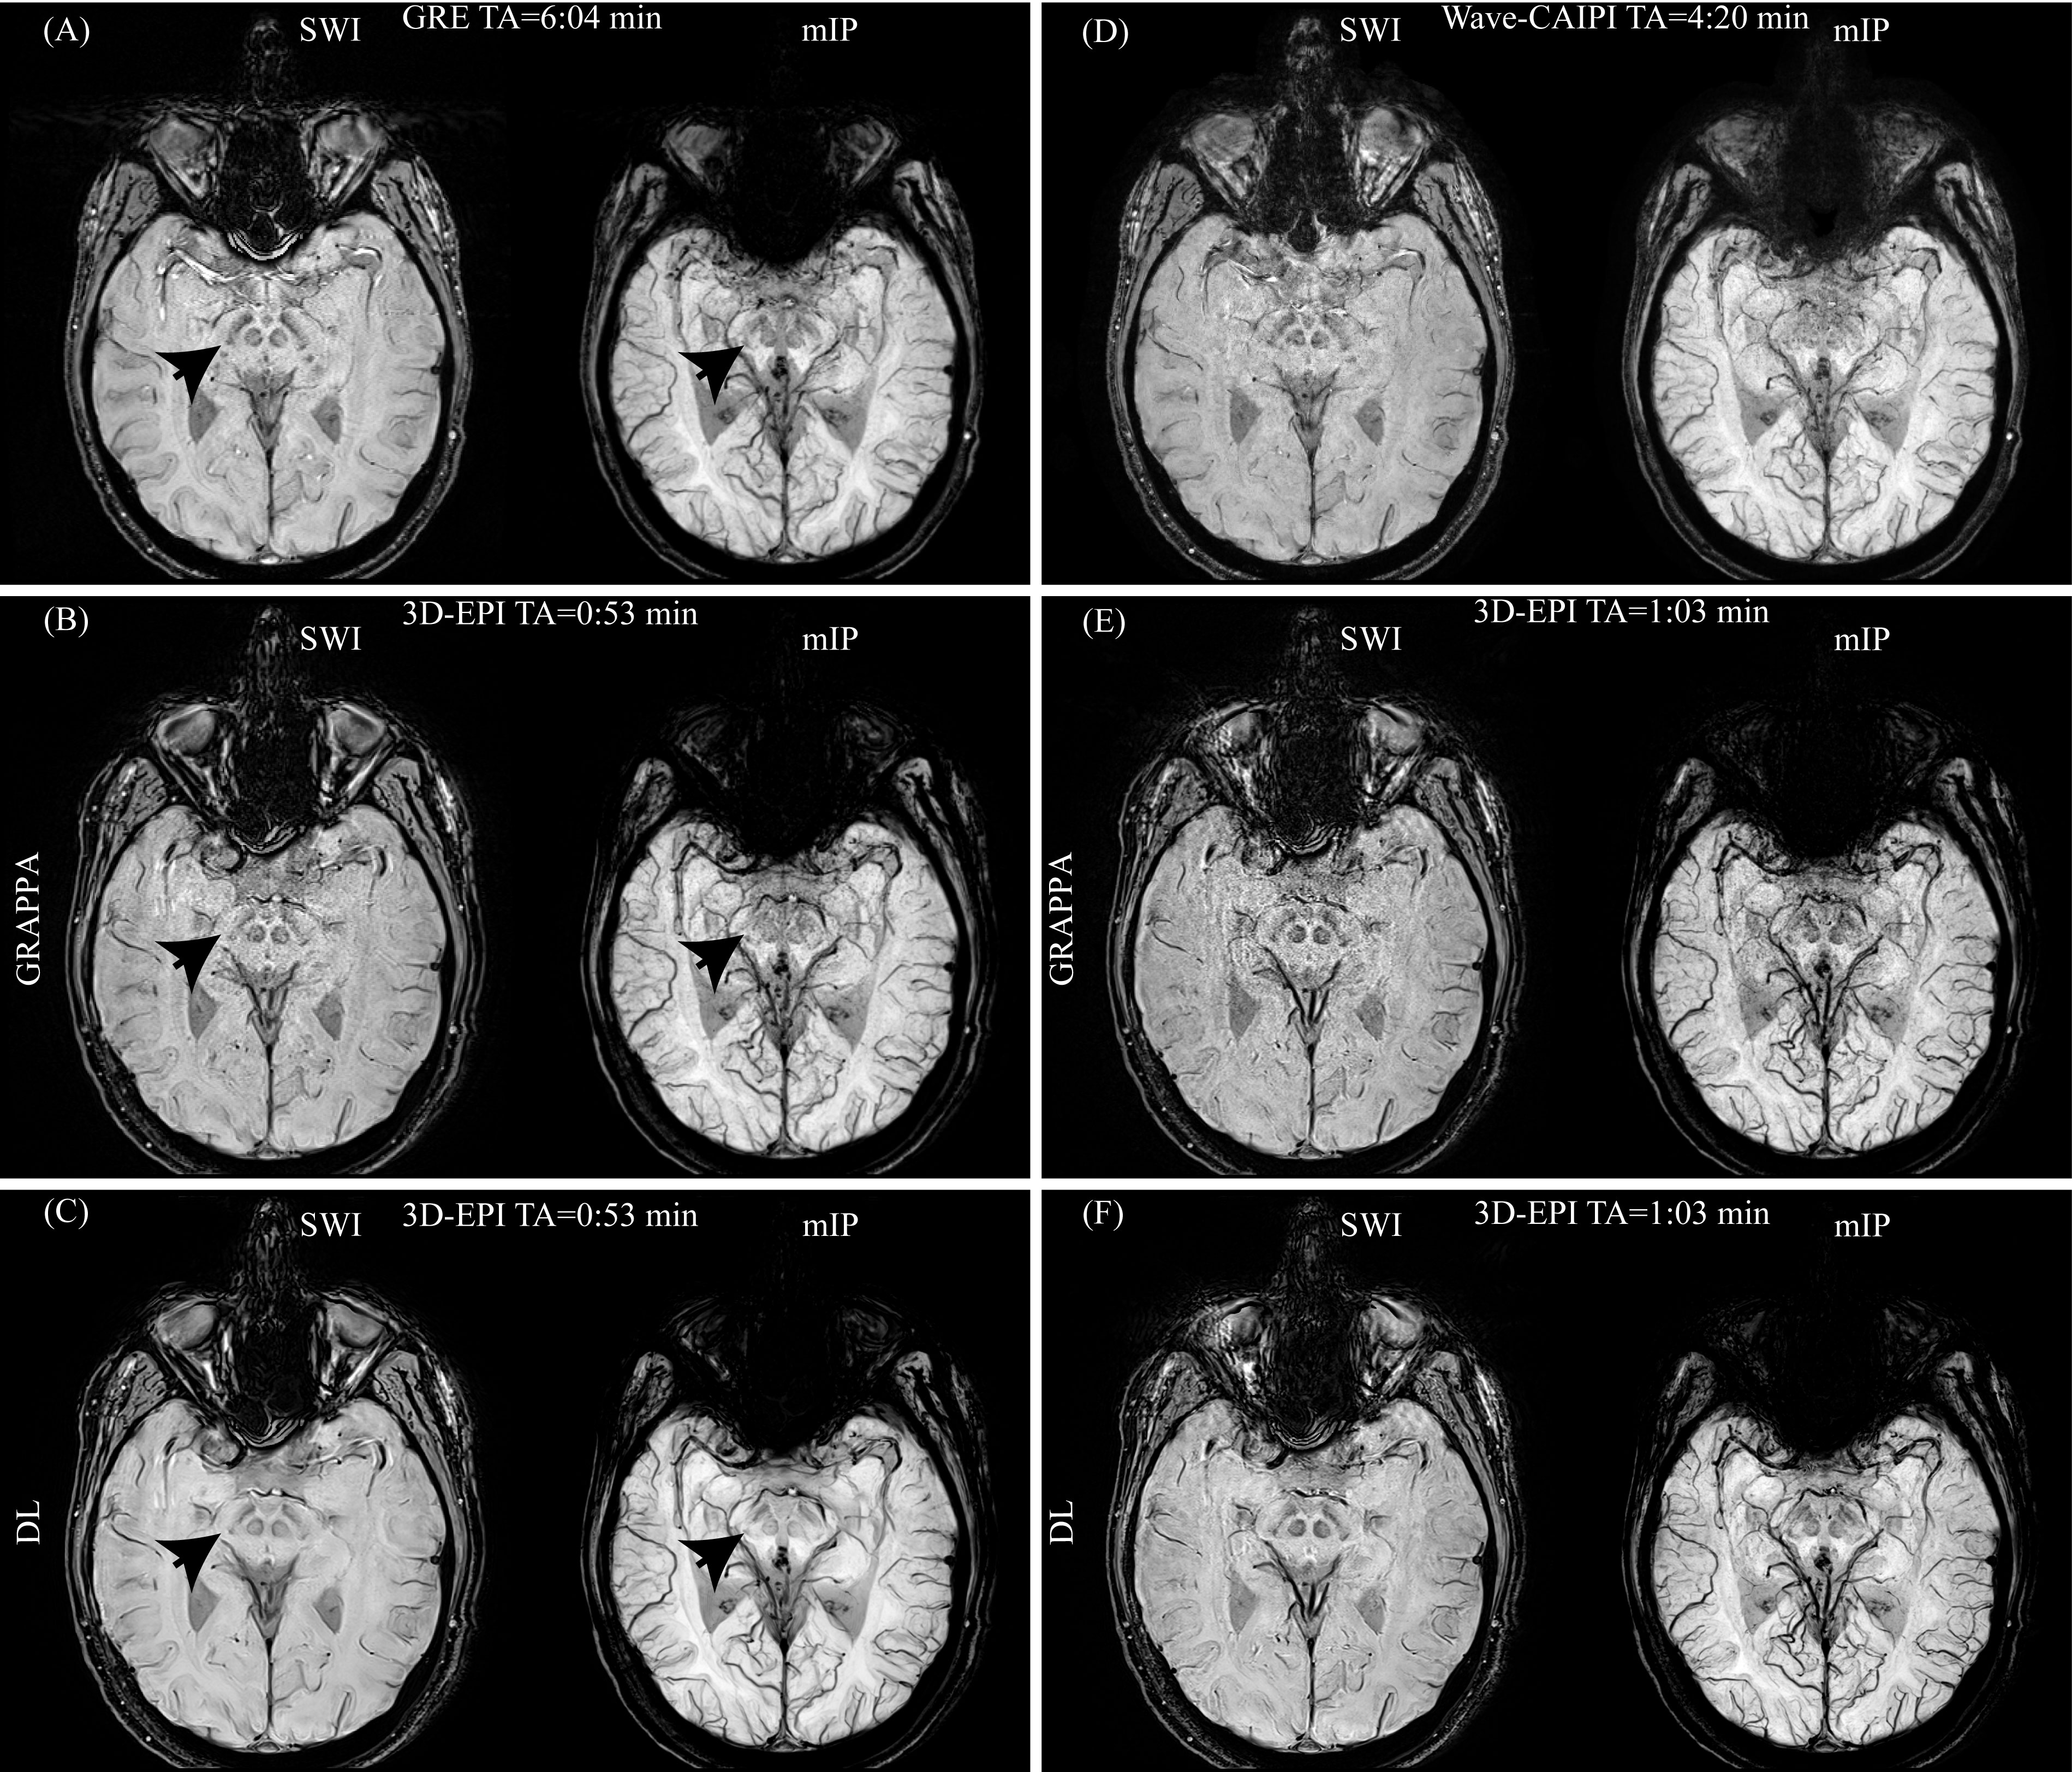
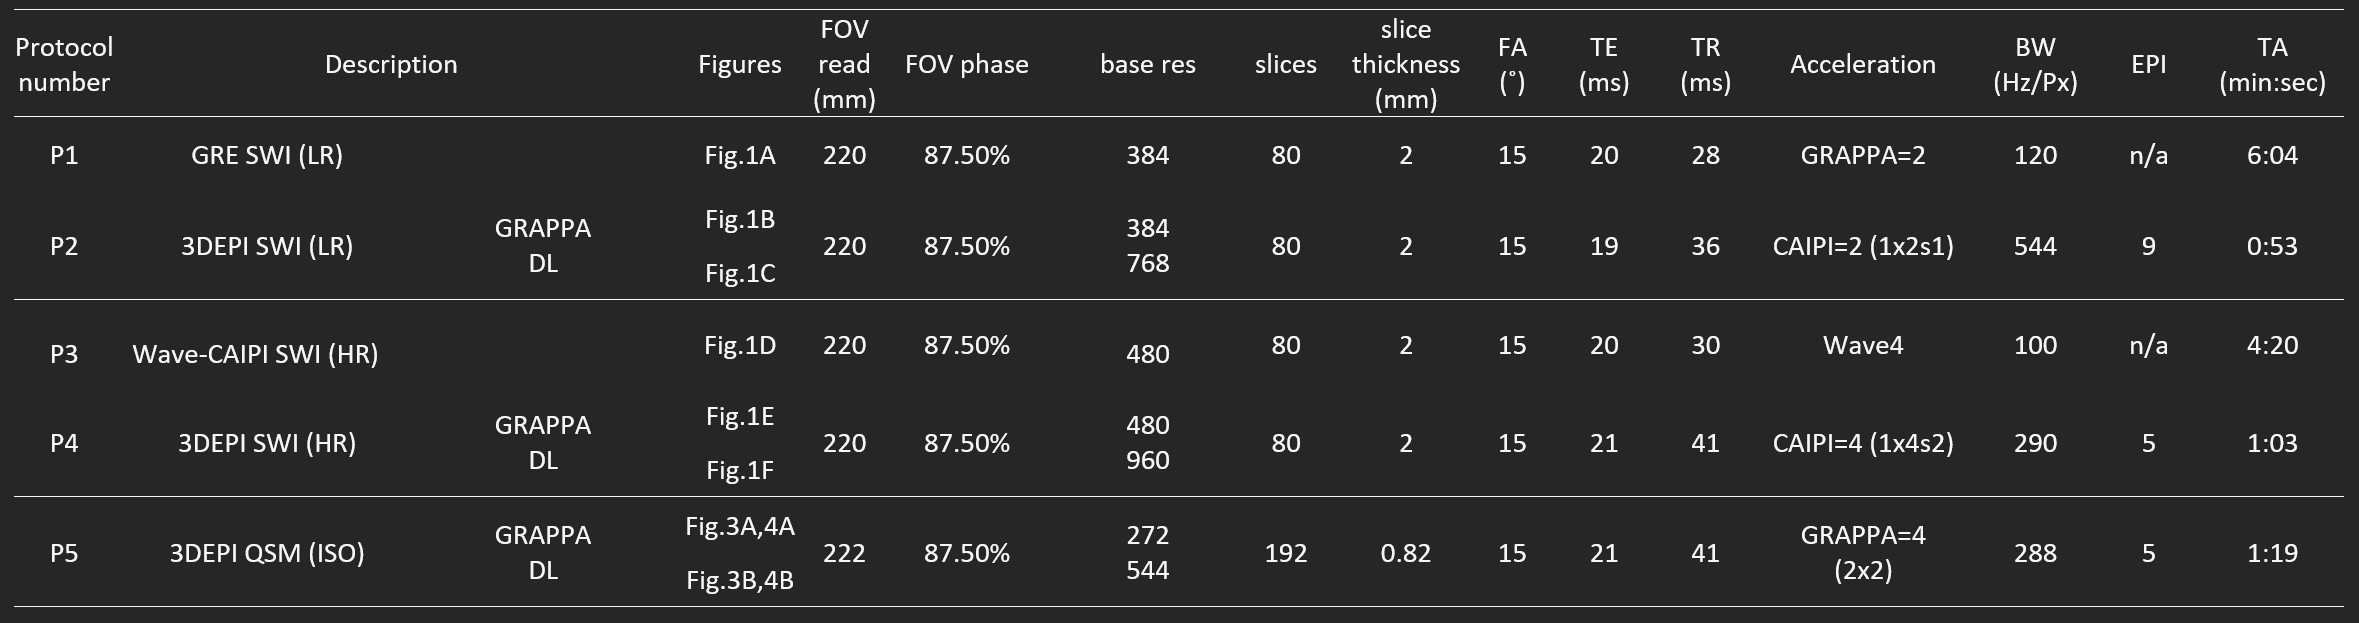
As shown in Table 1, the established SWI protocols based on 2×GRAPPA GRE (Table1-P1) and 4×Wave-CAIPI (Table1-P3) are 6:04 min and 4:20 min long, respectively. The corresponding resolution-matched 3DEPI protocols (Table1-P2/P4) achieved significant scan-time reductions, at 53 seconds (6× speed-up) and 1:03 min (4× speed-up).As seen in Fig.1, the 3DEPI+GRAPPA images (Fig1B/1E) had similar overall quality to their GRE (Fig.1A) and Wave-CAIPI (Fig.1D) counterparts. GRE and Wave-CAIPI had higher SNR at the centre of the image, while 3DEPI produced more details in cortical regions. Specifically, blood vessels and surrounding tissues appeared significantly sharper with 3DEPI. DL reconstruction (fig.1C/1F) further improved the image fidelity for the 3DEPI scans, hence recovering even more details of tissues and vessels. The substantia nigra is better defined in Fig1.C, compared with Fig.1A/1B (arrows), while the vessels are notably more delineated in Fig.1F compared with Fig.1D/1E.
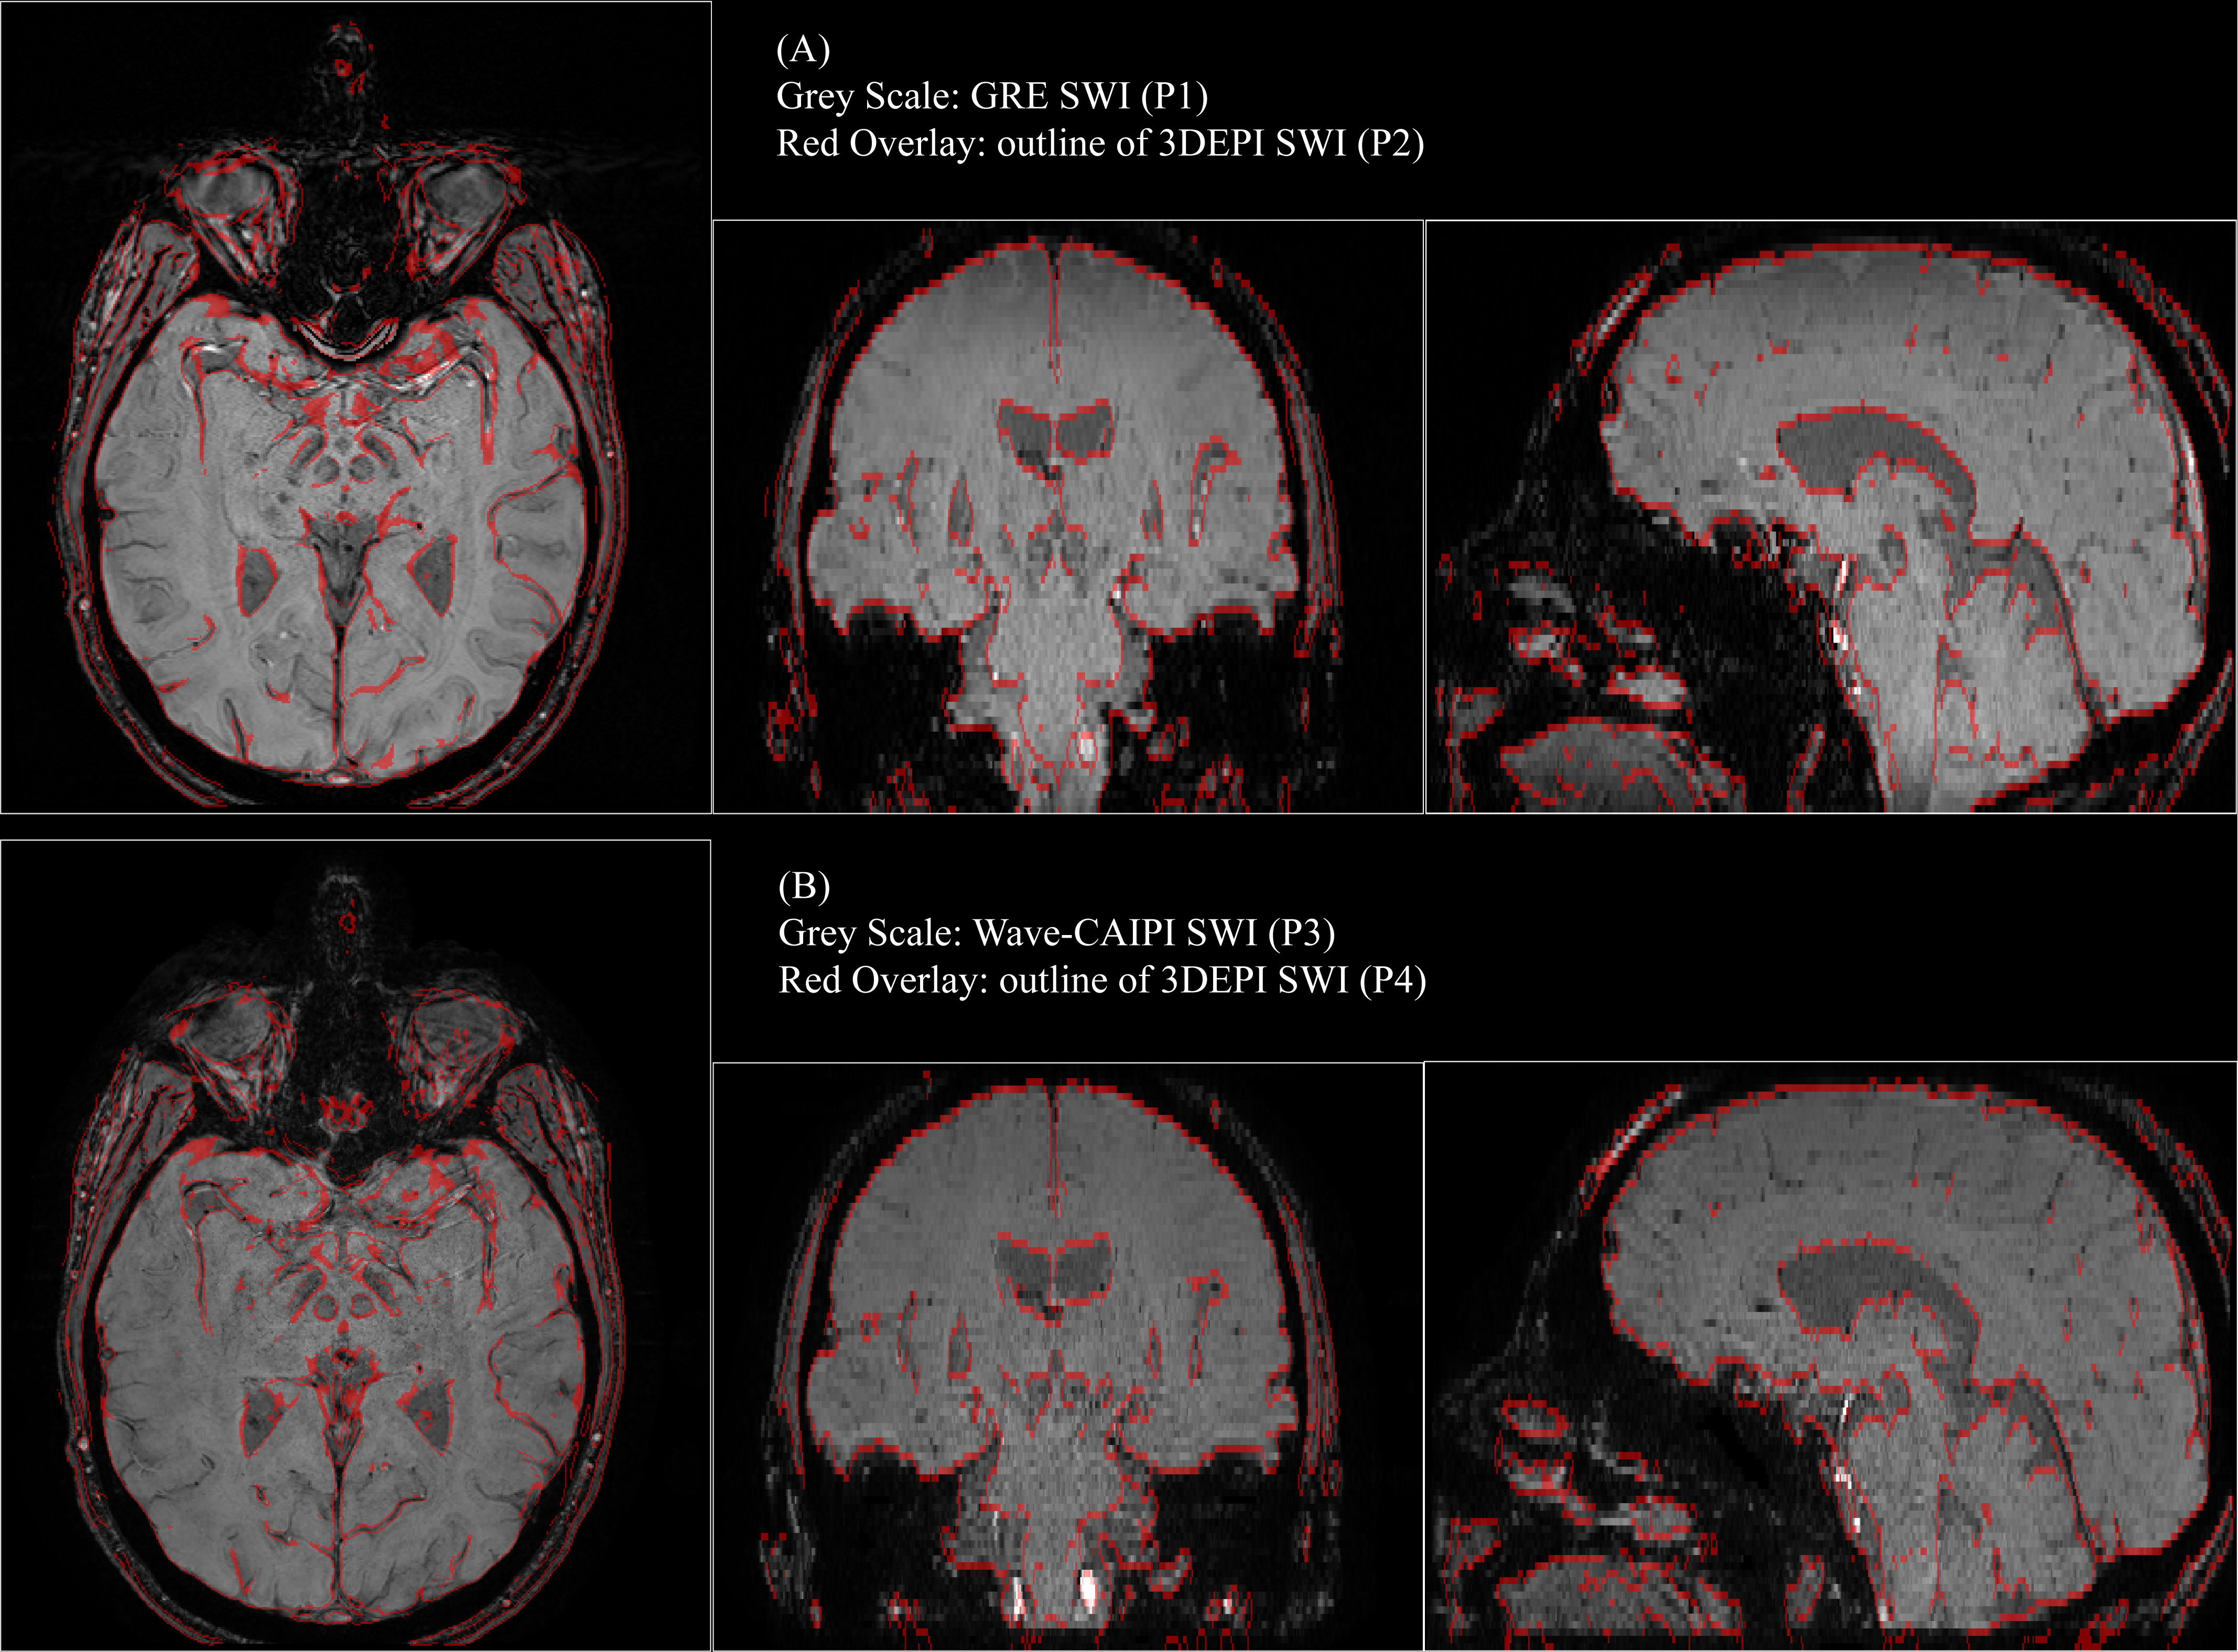
The GRE (Table1-P1) and Wave-CAIPI SWI (Table1-P3) images are displayed in Fig.2A and 2B, respectively. When the outlines of the corresponding 3DEPI-SWI images with matching resolution (Table1-P2/P4) were overlaid, little distortion was observed in the brain region, which confirms our previous findings6.
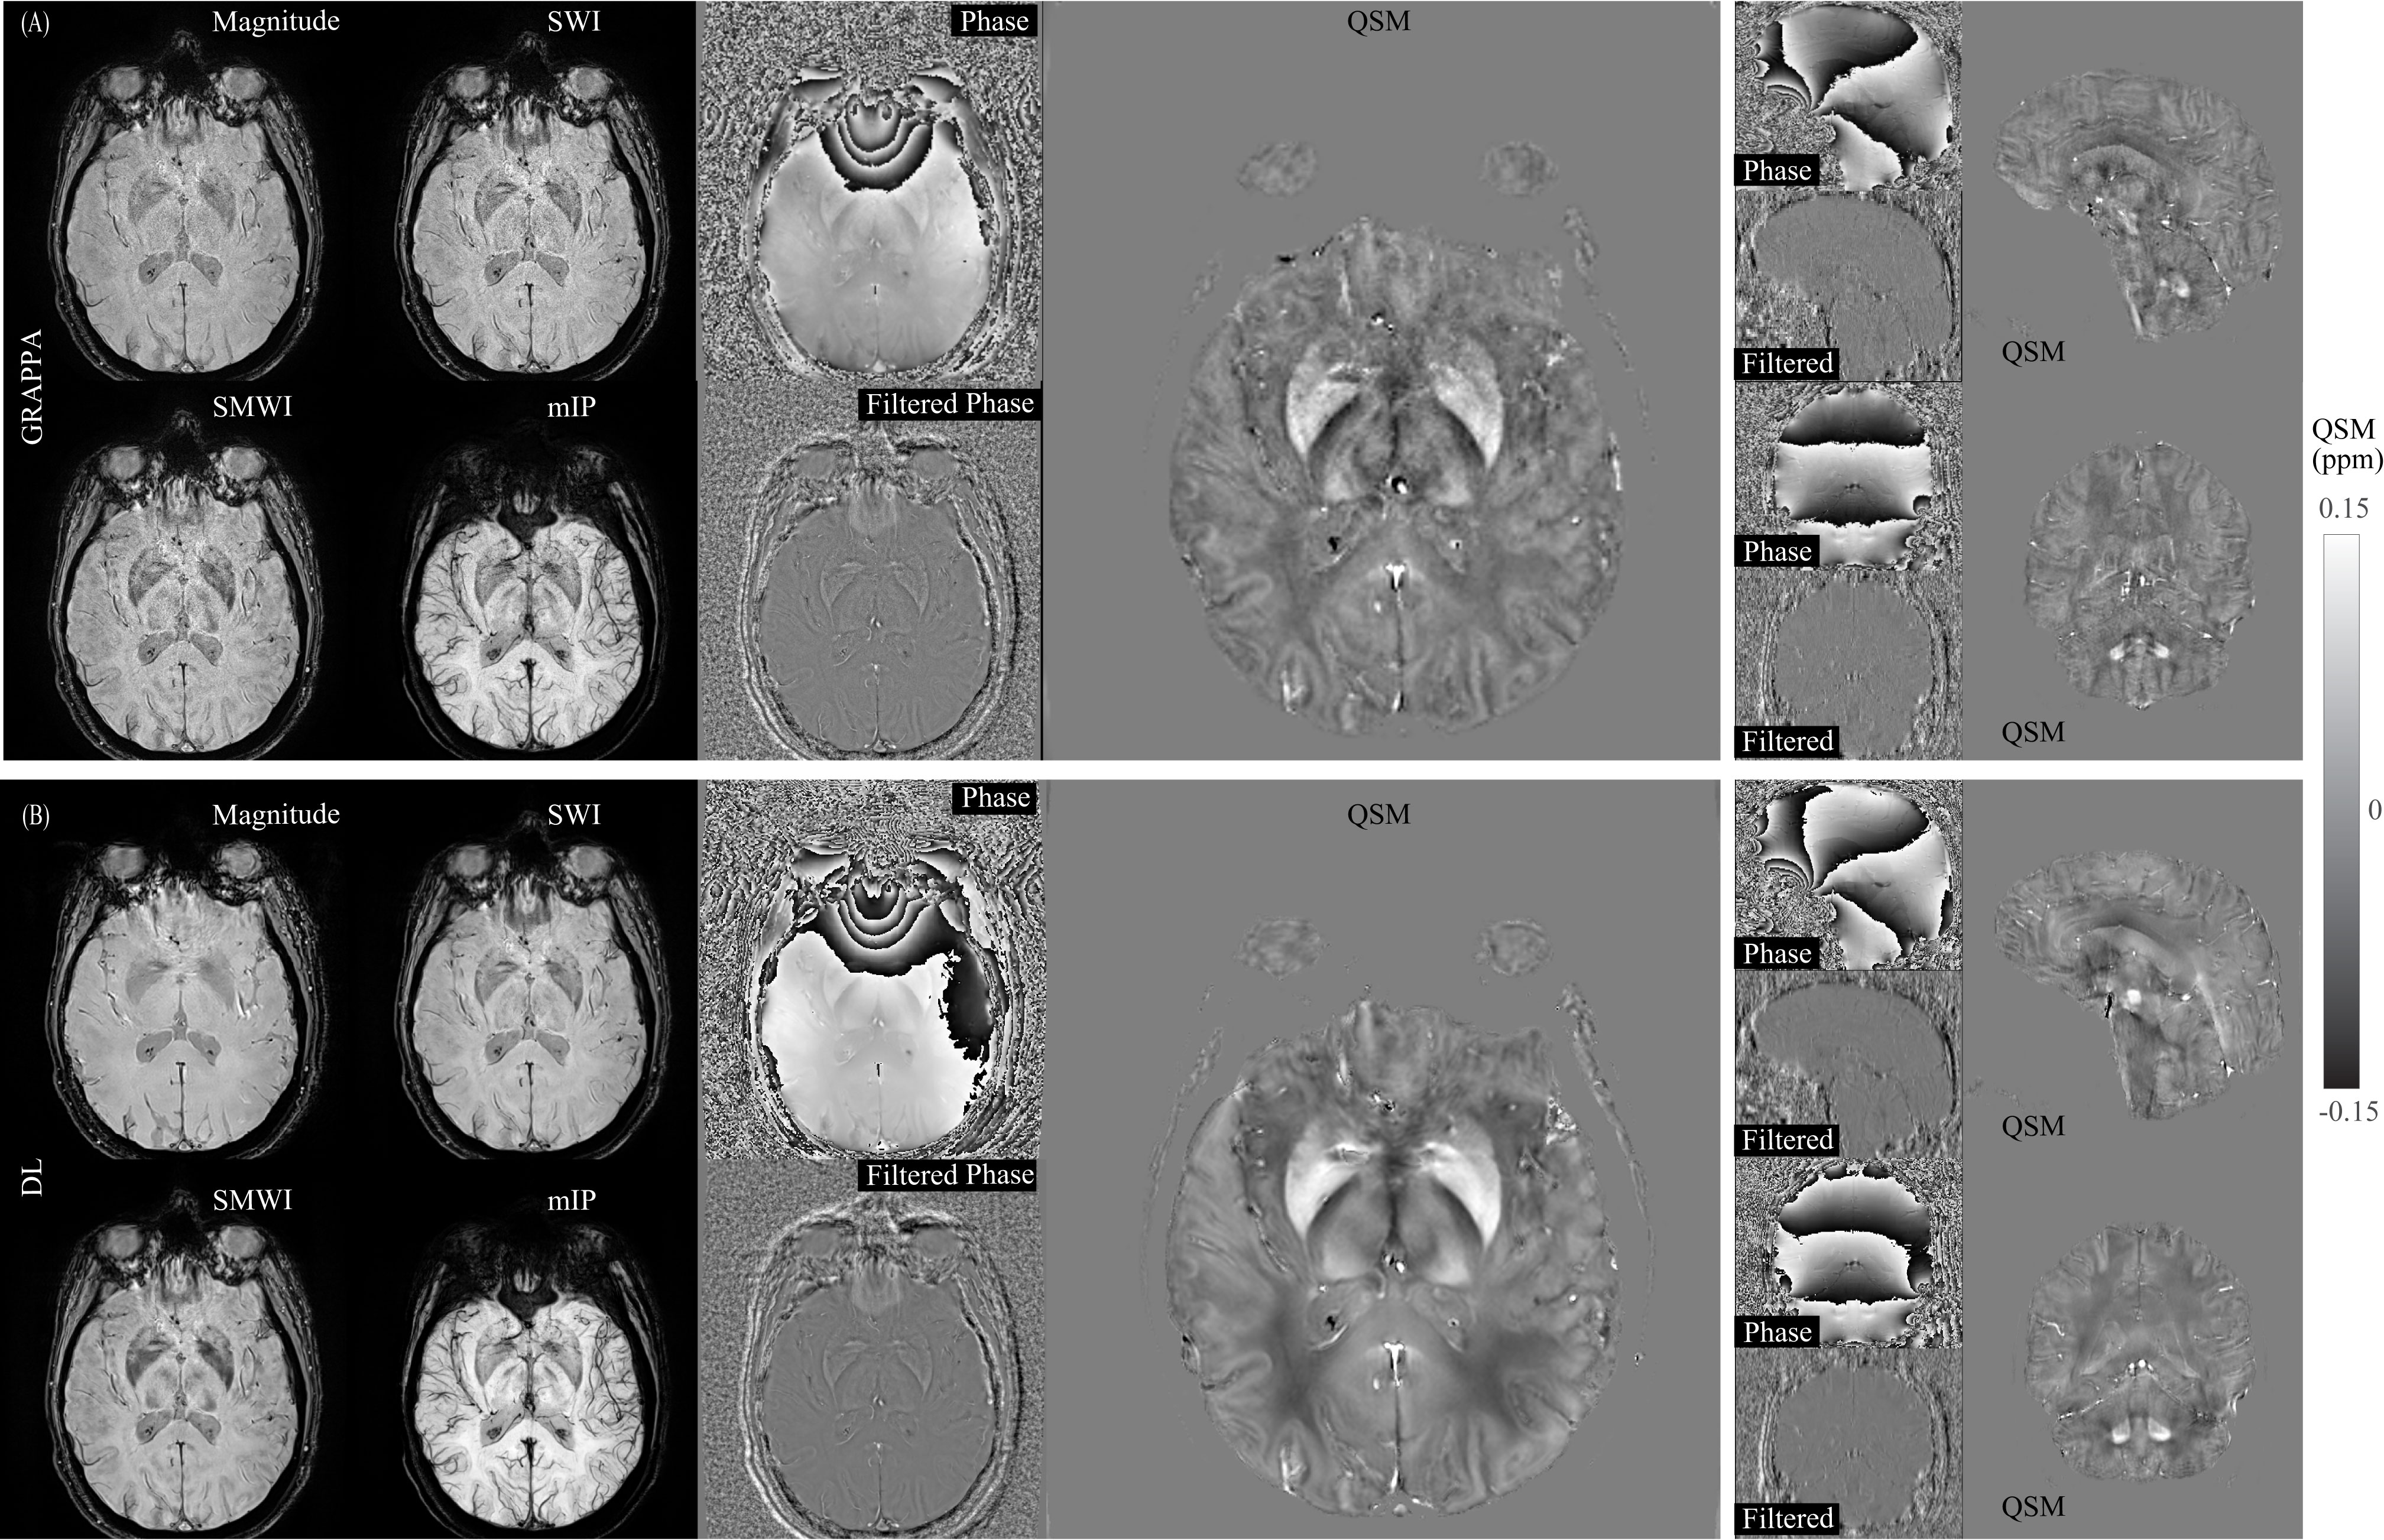
Fig.3 and Fig.4 each displays a slice from the image series of the isotropic 3DEPI (Table1-P5), including the magnitude and phase images available from the GRAPPA (Fig.3A/4A) and the DL (Fig.3B/4B) reconstructions. The subsequent inline processing provided filtered phase, SWI, mIP, QSM and SMWI. Note that the isotropic protocol P5 has about the same voxel volume as the high-resolution SWI scans (Table1-P3/P4). The DL-QSM is of significantly higher quality than GRAPPA-QSM throughout the FOV, especially around the centre of the FOV (e.g., substantia nigra). Consequently, the DL-SMWI appears to have enhanced contrast thanks to the improved susceptibility maps.
CONCLUSION
Flow-compensated 3DEPI shows promise as a viable alternative to conventional GRE-based sequences (e.g., GRE and Wave-CAIPI) for fast and high-resolution SWI, QSM and SMWI imaging in the clinic. The addition of DL reconstruction techniques for 3DEPI indicate considerable potential to explore the benefit of shorter scan times and/or enhancement of image quality on the clinical value of both SWI and QSM.Acknowledgements
No acknowledgement found.References
1. Haacke, E. M., Xu, Y., Cheng, Y.-C. N. & Reichenbach, J. R. Susceptibility weighted imaging (SWI). Magn. Reson. Med. 52, 612–618 (2004). 2. Mittal, S., Wu, Z., Neelavalli, J. & Haacke, E. M. Susceptibility-Weighted Imaging: Technical Aspects and Clinical Applications, Part 2. Am. J. Neuroradiol. 30, 232–252 (2009). 3. Haacke, E. M. et al. Quantitative susceptibility mapping: current status and future directions. Magn. Reson. Imaging 33, 1–25 (2015). 4. Haacke, E. M., Mittal, S., Wu, Z., Neelavalli, J. & Cheng, Y.-C. N. Susceptibility-Weighted Imaging: Technical Aspects and Clinical Applications, Part 1. Am. J. Neuroradiol. 30, 19–30 (2009). 5. Jin Jin et al. Segmented 3D EPI with CAIPIRINHA for Fast, High-Resolution T2*-weighted Imaging. in Proc. Annu. Meeting ISMRM (2021). 6. Monique Tourell et al. Submillimeter, Sub-Minute Quantitative Susceptibility Mapping using a Multi-Shot 3D-EPIwith 2D CAIPIRINHA Acceleration. in Proc. Annu. Meeting ISMRM (2021). 7. Hammernik, K. et al. Learning a variational network for reconstruction of accelerated MRI data. Magn. Reson. Med. 79, 3055–3071 (2018). 8. Gho, S.-M. et al. Susceptibility map-weighted imaging (SMWI) for neuroimaging. Magn. Reson. Med. 72, 337–346 (2014). 9. Ashley Wilton Stewart et al. QSMxT - A cross-platform, fexible, lightweight, and scalable processing pipeline forquantitative susceptibility mapping. in Proc. Annu. Meeting ISMRM (2021). 10. Almansour, H. et al. Deep Learning-Based Superresolution Reconstruction for Upper Abdominal Magnetic Resonance Imaging: An Analysis of Image Quality, Diagnostic Confidence, and Lesion Conspicuity. Invest. Radiol. 56, (2021). 11. Bilgic, B. et al. Wave-CAIPI for highly accelerated 3D imaging. Magn. Reson. Med. 73, 2152–2162 (2015).Figures