2809
Post-contrast multi-parametric mapping from only pre-contrast conventional weighted images1Universidad de Valladolid, Valladolid, Spain, 2Erasmus MC, Rotterdam, Netherlands, 3TU Delft, Delft, Netherlands
Synopsis
Keywords: Synthetic MR, Quantitative Imaging, Contrast-enhancement
Motivation: Gadolinium-based contrast agents (GBCAs) have become a cornerstone in clinical routine for lesions characterization and treatment monitoring. However, issues such as safety concerns related to deposition of GBCA in the body and brain, prolonged acquisitions, and cost increase advocate against its usage.
Goal(s): To replace the usage of GBCAs in post-contrast imaging with parametric maps and deep learning.
Approach: A cascade of two convolutional-neural-networks for pre- and post-contrast parametric mapping and the synthesis of post-contrast T1-weighted images from only two pre-contrast conventional weighted images.
Results: The proposed approach presents potential for predicting post-contrast T1w-enhancement without the usage of GBCAs.
Impact: The proposed deep learning approach provides both pre- and post-contrast parametric maps and, consequently, the capability of synthesizing any post-contrast image from only two pre-contrast conventional weighted images. Thus, it paves the way towards GBCAs-free acquisitions.
Purpose
Gadolinium-based contrast agents (GBCAs) are a cornerstone for detection, characterization and monitoring of brain tumors due to their ability to reveal blood-brain-barrier (BBB) breakdown1. Although GBCAs are considered safe, up to 2.4% of patients suffer from mild adverse reactions2 and, also, their possible deposition in tissues has recently raised safety concerns3. In addition, the usage of GBCAs results in patient discomfort, additional cost and prolonged scan time. Thus, making GBCAs unnecessary would be highly advantageous. With this goal in mind, parametric maps could play a crucial role due to their known ability to detect subtle tumor changes4,5.In this work, we propose a deep learning approach for pre- and post-contrast parametric mapping and the synthesis of post-contrast T1-weighted (post-T1w) images. Only two pre-contrast conventional weighted images —a T1-weighted (T1w) and a T2-weighted (T2w)— are used as input.
Methods
Dataset and preprocessing:14 patients with different grades of gliomas who had undergone tumor resection were scanned, after IRB approval and written informed consent, in a 3T GE Healthcare scanner. T1w, T2w, T2w-FLAIR, and post-T1w were acquired together with MAGiC6, a fast multi-parametric mapping technique. Images were co-registered and skull-stripped. Next, weighted images were analyzed by HD-GLIO7 to segment: (a) T1w-enhancement (T1e), and (b) T2w/T2w-FLAIR hyperintensity (T2h). Finally, each weighted image was normalized by its average intensity prior to the convolutional-neural-network (CNN).
Proposed approach:
We propose a cascade of two CNNs, namely, an extraction CNN and a prediction CNN (see Figure 1). The first CNN extracts the quantitative T1, T2, and PD maps, whose information is embedded in the T1w and T2w. The second CNN takes these T1 and T2 maps and predicts the corresponding post-contrast (i.e., after GBCA administration) T1 and T2 maps. This prediction of the GBCA-related information is performed using both the tissue information derived from the pre-contrast maps and the extra knowledge extracted from the post-T1w and T2w during the self-supervised training. Training with T2w images, which are virtually invariant to contrast administration5, ensures that the post-contrast maps are numerically and physically coherent. Both CNNs share the architecture of Moya-Sáez et al.8 except for the number of inputs.
Training is 2-fold; step 1) the extraction CNN is trained via supervised learning with MAGiC maps as reference. The loss function is the l1-norm. Step 2) Keeping the weights of the extraction CNN fixed, the prediction CNN is trained with a self-supervised learning procedure similar to that proposed in Moya-Sáez et al.9. Post-T1w and T2w are used as references and the loss function is:
$$$L_{\text{step2}}=||(\text{postT1w}_{\text{syn}}-\text{postT1w}_{\text{acq}})||_{\ell1}+||(\text{T2w}_{\text{syn}}- \text{T2w}_{\text{acq}})||_{\ell1}+\lambda||M\odot(\Delta\text{T1w}_{\text{syn}}-\Delta \text{T1w}_{\text{acq}})||_{\ell1}$$$
where $$$\text{postT1w}_{\text{syn}}$$$ and $$$\text{postT1w}_{\text{acq}}$$$ are the synthesized and acquired post-T1w, respectively. A similar distinction is applied to the T2w. $$$M$$$ is a binary mask with positive values in the T1e regions, $$$\Delta\text{T1w}_{\text{syn}}$$$ and $$$\Delta\text{T1w}_{\text{acq}}$$$ are the GBCA intakes (i.e., $$$\text{postT1w}_{\text{syn}}-\text{T1w}_{\text{acq}}$$$ and $$$\text{postT1w}_{\text{acq}}-\text{postT1w}_{\text{acq}}$$$, respectively). We stress that the post-T1w and the mask are only needed for training.
Cross-validation was carried out via leave-one-out. For each data splitting, one patient is used for testing and the remaining patients are randomly split between training (11 patients) and early-stopping validation (2 patients). Transfer learning was employed; in the extraction CNN by pre-training with a synthetic dataset8, and in the prediction CNN by pre-training with a large public dataset10. Both networks were trained with Adam (lr=1e-4), batchsize=4, and $$$\lambda$$$=100.
Results
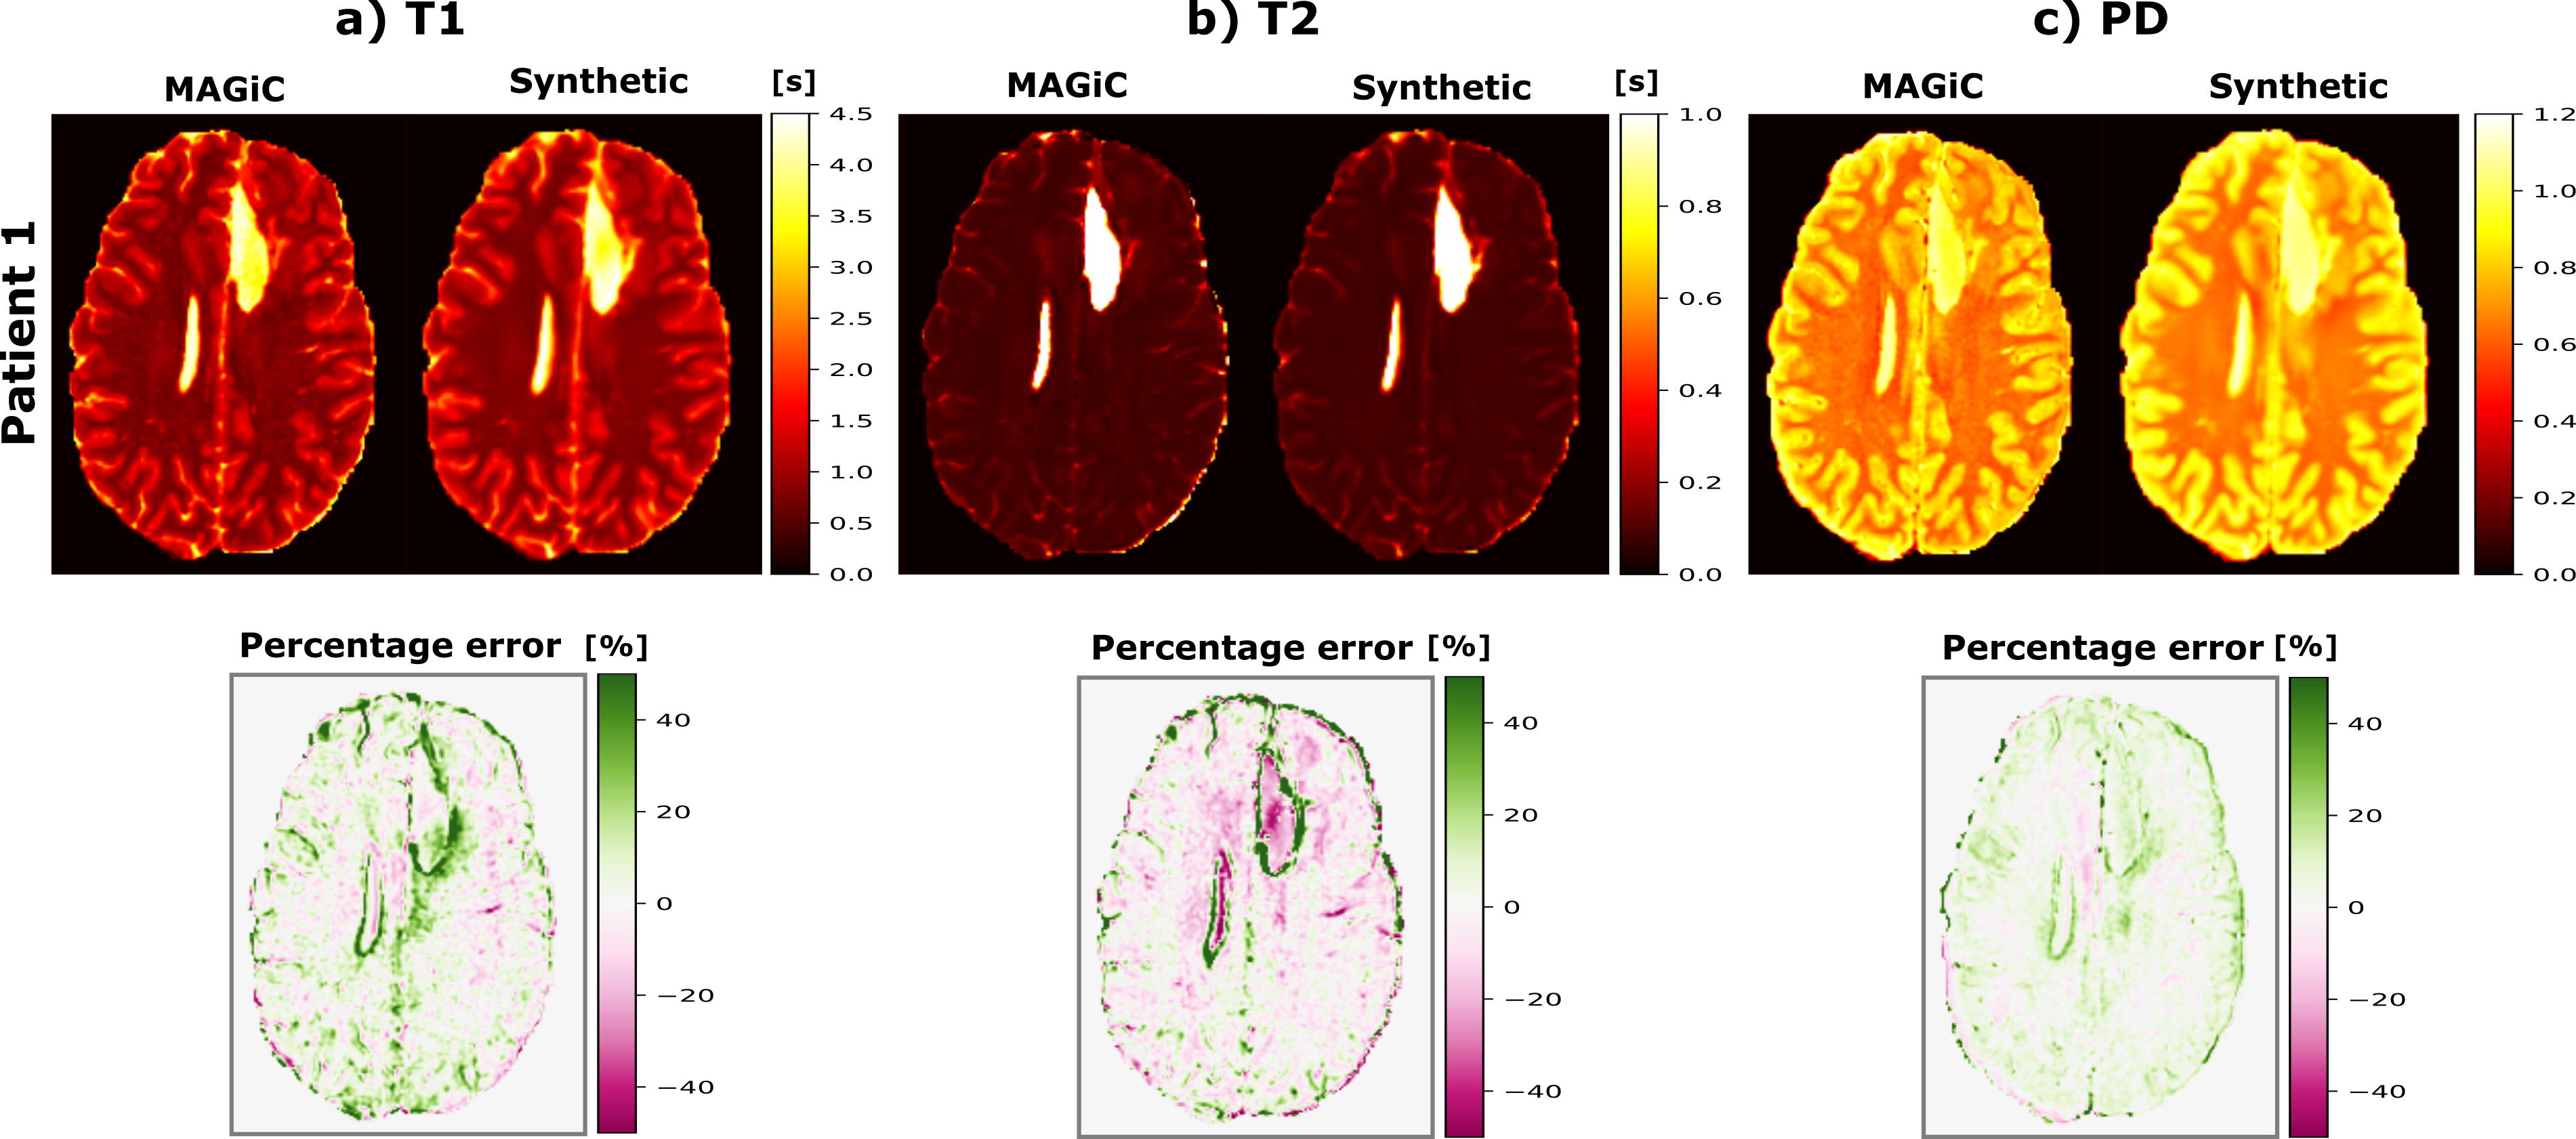
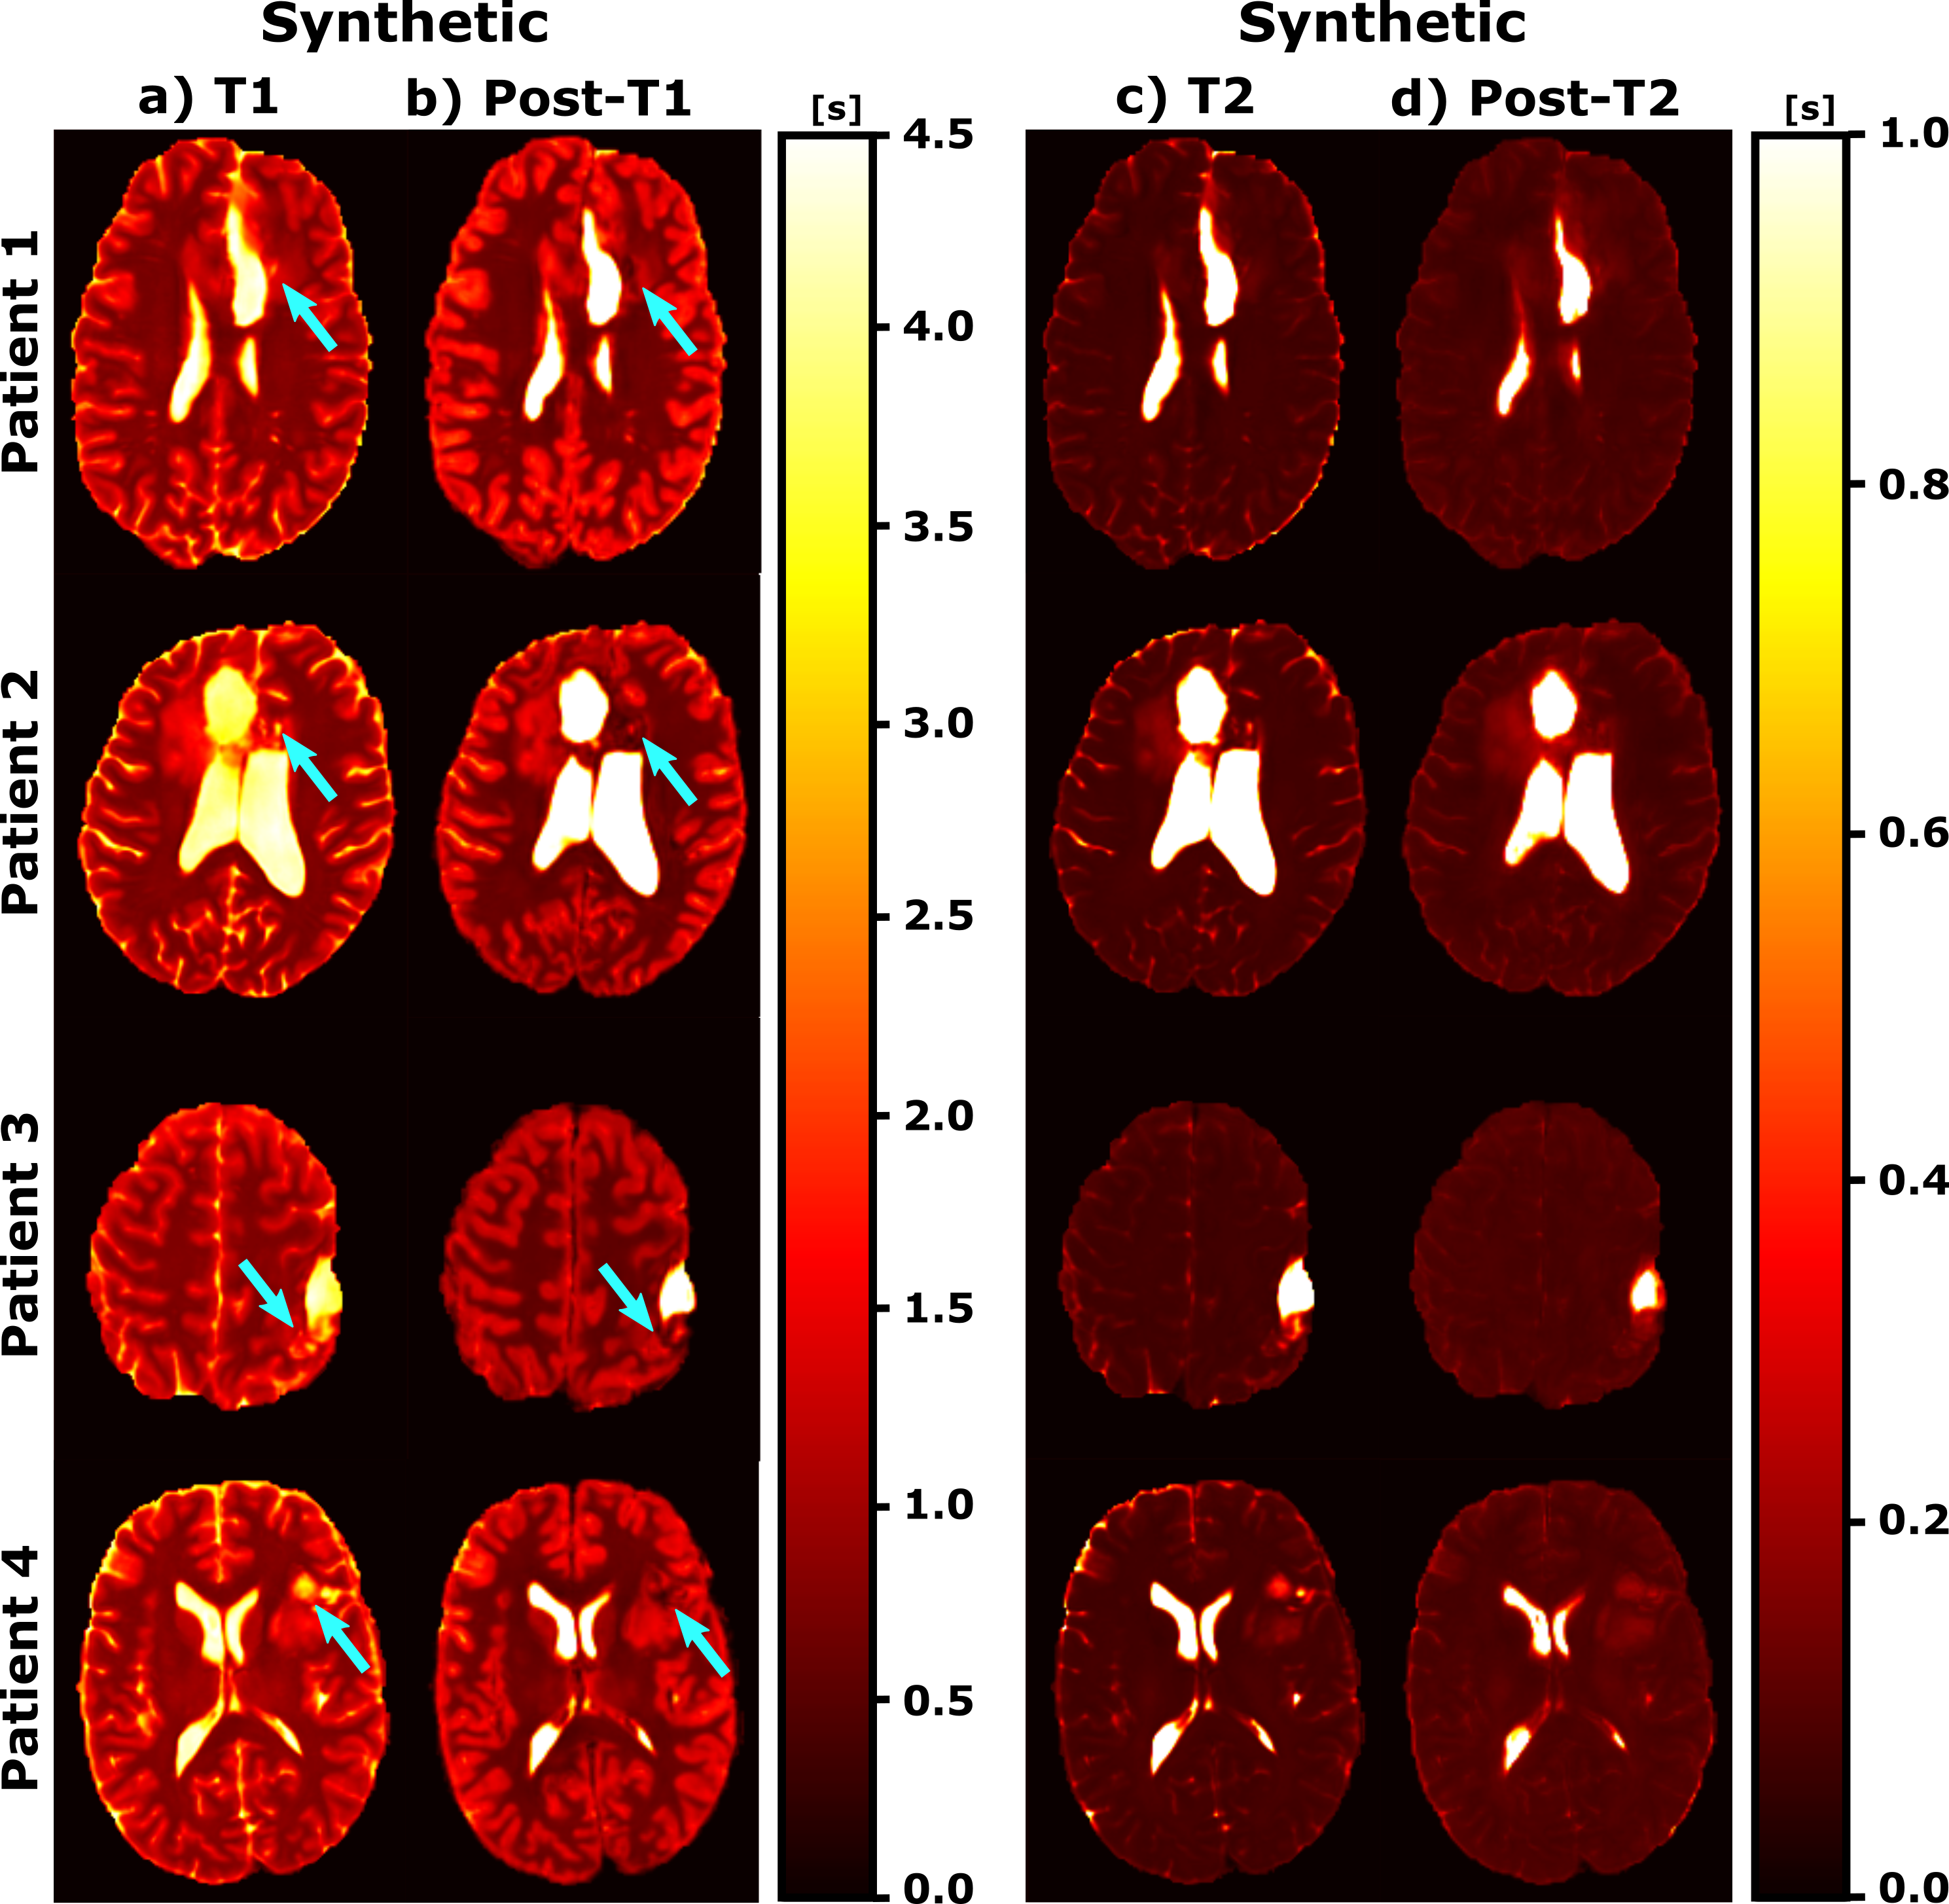
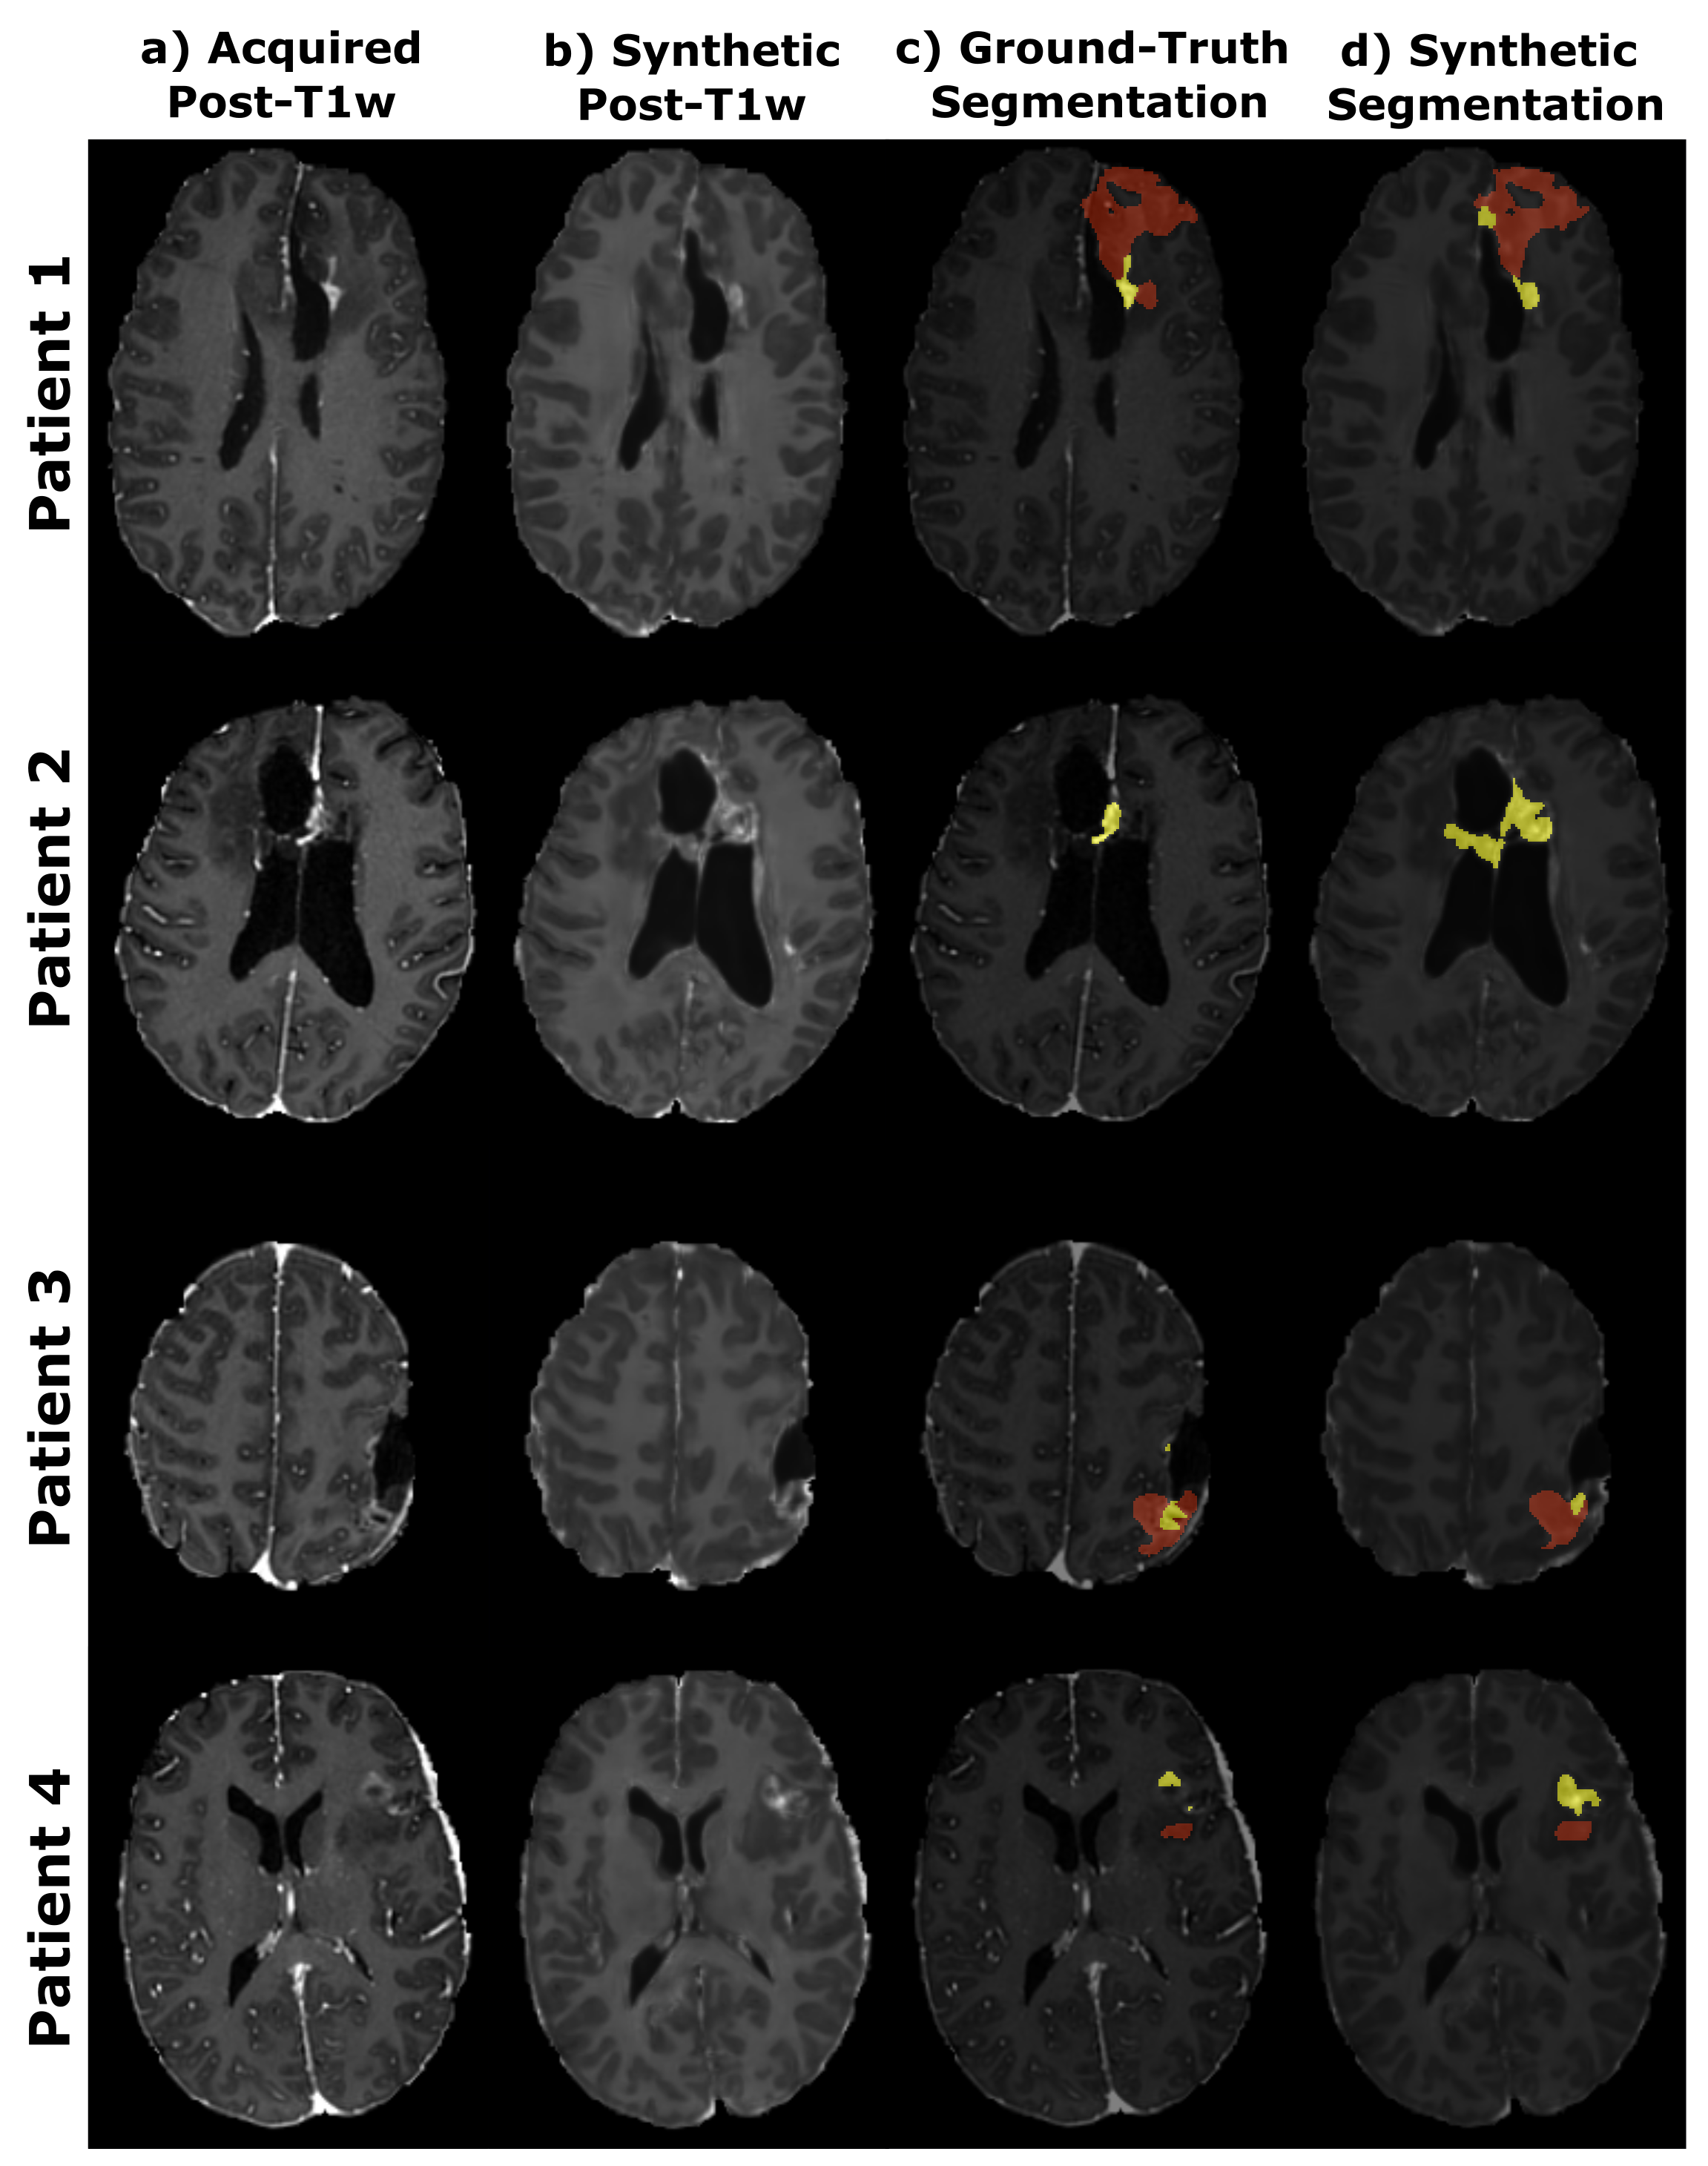
Figure 2 displays the pre-contrast MAGiC and synthetic parametric maps and also the percentage error between both. Figure 3 shows the pre- and post-contrast synthetic parametric maps, whereas Figure 4 shows the synthesized and acquired post-T1w images. The ground-truth and synthetic segmentations are also shown.Discussion
These preliminary results show how using only pre-contrast weighted images (i.e., acquired without GBCAs) is feasible not only to extract pre-contrast parametric maps but also to predict post-contrast maps. These maps may add value towards automatic enhancement quantification4,5. MAGiC and synthetic pre-contrast maps present similar values (see Figure 2). Additionally, the predicted post-contrast maps have the capability of synthesizing post-contrast weighted images with visual resemblance to the acquired counterparts as shown in Figure 4. Despite the differences visible in Figure 4 between the ground-truth and the synthetic T1w-enhancement segmentations, the clinical value of both could potentially be the same. Future lines of research include the comparison of the synthetic post-contrast parametric maps with those obtained with other well-accepted techniques as well as validation of the approach with a larger cohort.Conclusion
We proposed a proof-of-concept for pre- and post-contrast multi-parametric mapping and the synthesis of post-T1w images, using only two pre-contrast conventional weighted images. Preliminary results suggest its potential for predicting post-contrast T1w-enhacement without GBCAs.Acknowledgements
The authors acknowledge the Fundación Científica Asociación Española Contra el Cáncer (FC AECC) for the predoctoral fellowship of the first author. In addition, the authors also acknowledge grants PID2020-115339RB-I00, TED2021-130090B-I00 and PID2021-124407NB-I00 from the Ministerio de Ciencia e Innovación of Spain. The General Electric Healthcare Grant: “B-GEHC-5. MR Physiological Signature” is also acknowledged, as well as the support from ESAOTE.References
1. Warntjes M., et al. Synthesizing a contrast-enhancement map in patients with high-grade gliomas based on a postcontrast MR imaging quantification only. Am J Neuroradiol. 2018; 39(12),2194-2199.
2. Forghani R., Adverse effects of gadolinium-based contrast agents: changes in practice patterns. Top Magn Reson Imaging. 2016; 25,163–6
3. Gulani V., et al. Gadolinium deposition in the brain: summary of evidence and recommendations. Lancet Neurol. 2017; 16(7), 564-570.
4. Nunez-Gonzales L., et al. Pre-contrast MAGiC in treated gliomas: a pilot study of quantitative MRI. Sci Rep. 2022;12(1):21820.
5. Hattingen E., et al. Value of quantitative magnetic resonance imaging T1-relaxometry in predicting contrast-enhancement in glioblastoma patients. Oncotarget. 2017; 8(32), 53542.
6. Warntjes J.B.M., et al. Rapid magnetic resonance quantification on the brain: optimization for clinical usage. Magn Reson Med. 2008;60(2),320-329.
7. Kickingereder P., et al. Automated quantitative tumour response assessment of MRI in neuro-oncology with artificial neural networks: a multicentre, retrospective study. Lancet Oncol. 2019; 20(5):728-740.
8. Moya-Sáez E., et al. A deep learning approach for synthetic MRI based on two routine sequences and training with synthetic data. Comput Methods Programs Biomed. 210, 106371.
9. Moya‐Sáez E., et al. Synthetic MRI improves Radiomics‐based glioblastoma survival prediction. NMR Biomed. 2022; e4754.
10. Bakas S., et al. The University of Pennsylvania glioblastoma (UPenn-GBM) cohort: advanced MRI, clinical, genomics, & radiomics. Sci. Data. 2022; 9(1),1-12.
Figures