2796
Simultaneously Multi-slice Imaging by the Fusion of Reconstruction and Collecting Under-sampled Signal with Deep Learning (FoCUS)1Utsunomiya University, Utsunomiya, Japan, 2National Institute of Technology, Oyama College, Oyama, Japan
Synopsis
Keywords: Machine Learning/Artificial Intelligence, New Trajectories & Spatial Encoding Methods
Motivation: Simultaneous multi-slice imaging (SMS) can obtain multiple slice images simultaneously, but it requires the sensitivity distribution of the receiver coils.
Goal(s): Our goal was to separate slice images using deep learning reconstruction without coil sensitivity.
Approach: Different amplitude modulation is given to each slice, and the CNN separates each slice from the focal image based on the value of the amplitude modulation.
Results: Simulation experiments showed that image separation was successfully achieved not only for real-valued images but also for complex-valued images. Image quality decreases when the number of excitation images was increased.
Impact: SMS can be used much more easily because it does not require coil sensitivity distribution for image separation. No non-uniform residual noise will be generated. The proposed method may expand the application of SMS.
Introduction
Among MRI high-speed imaging, simultaneous multi-slice imaging (SMS) [1] has the advantage of measuring multiple slice images at the same time. It is sometimes difficult to measure the sensitivity of receiver coils accurately, and there is also the problem of non-uniformity of the signal-to-noise ratio on the image. We have applied the principle of holography to MR imaging that can reconstruct an arbitrarily focused image at the z-coordinate from a two-dimensionally acquired signals [2,3]. In this study, we attempted to separate superimposed images using deep learning approach. Unlike our previous studies [2,3], we considered a method applicable to the Fourier transform method.Methods
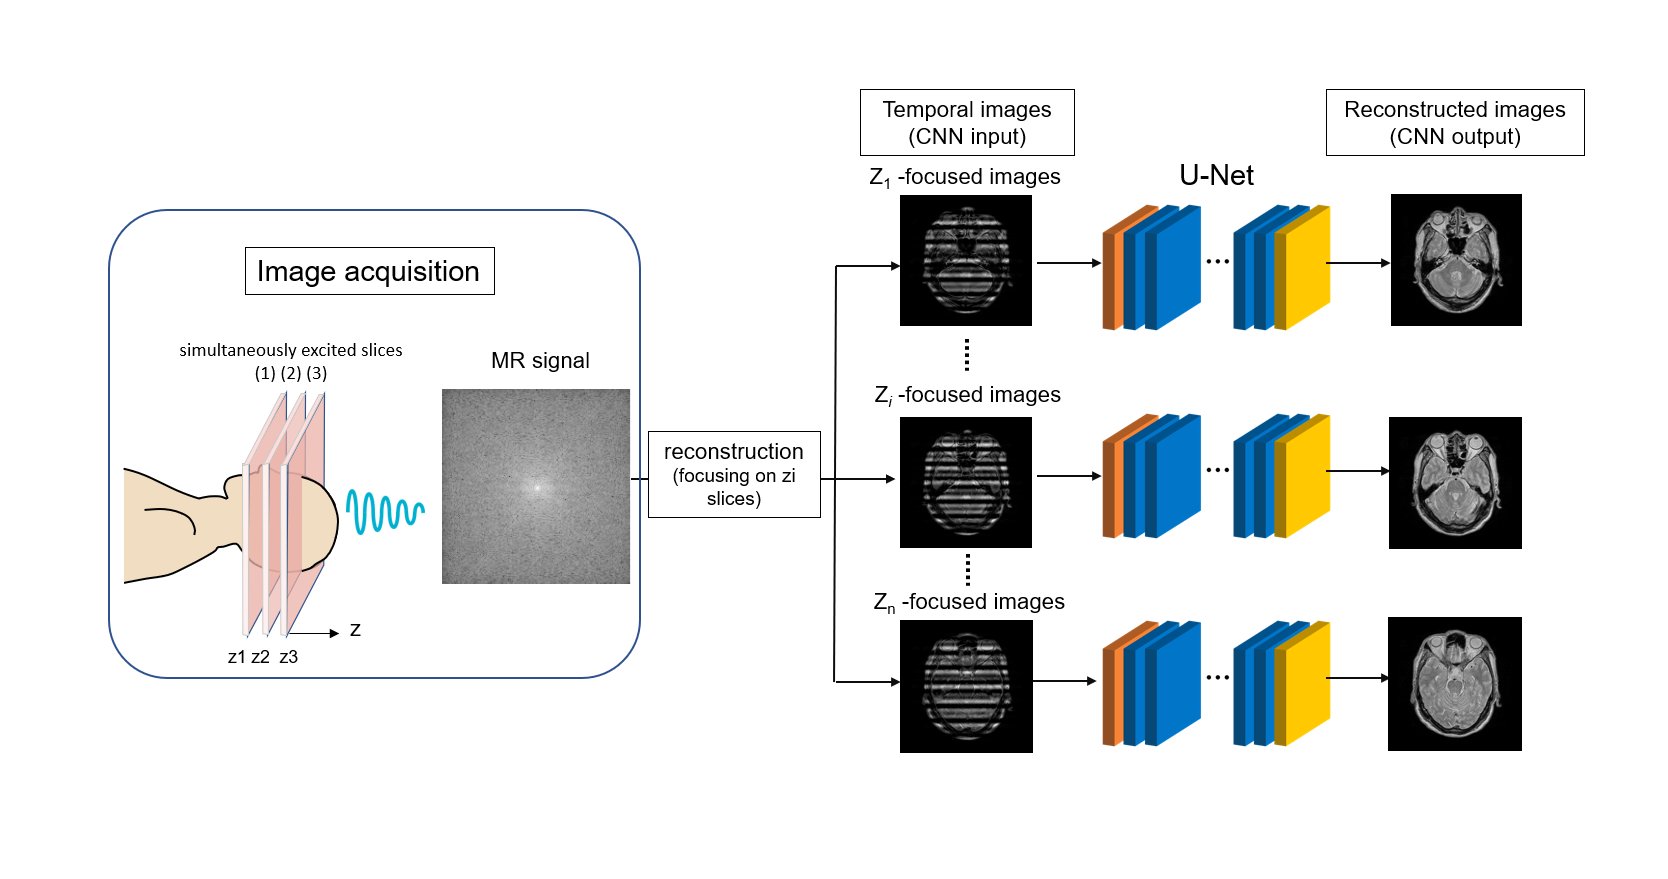
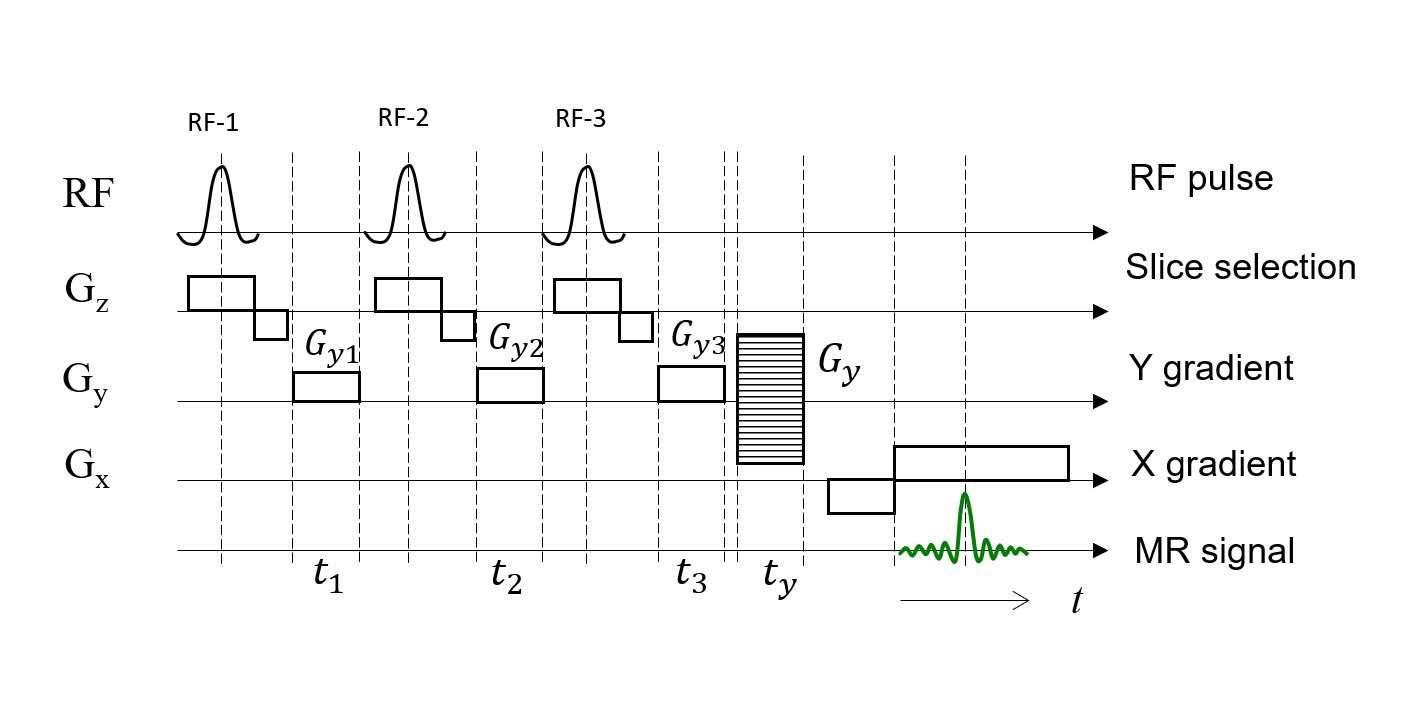
Figure 1 shows the schematic of proposed method. Consider the case where three slices (z1, z2, z3) are to be imaged simultaneously. As shown in Fig. 2, after applying an RF1 pulse that excites only slice-1, phase modulation can be given to slice-1 by applying a $$$G_{y1}$$$ gradient for the time $$$t_1$$$. Next, an RF2 pulse is applied to excite slice-2, and a $$$G_{y2}$$$ gradient is applied for the time $$$t_2$$$ to provide phase modulation to slice-2 and slice-1. Slice-3 is excited and phase-modulated in the same way. After multiple slice excitations and phase modulations, signal acquisition is performed using a Fourier transform imaging sequence. MR signal in this sequence is written as Eq. (1).$$v(k_x,k_y)= \int \hspace{-2.0mm} \int^{\infty}_{-\infty} \left\{ \rho(x,y,z_1) e^{-j (k_{m1}+k_{m2}+k_{m3}) y} +\rho(x,y,z_2) e^{-j (k_{m2}+k_{m3}) y} +\rho(x,y,z_3) e^{-j k_{m3} y} \right\} e^{-j \left(k_x x+k_y y \right)} dxdy ...(1)$$
where $$$k_{m1}= \gamma G_{y1} t_1, k_{m2}= \gamma G_{y2} t_2, k_{m3}= \gamma G_{y3} t_3$$$.
The image focused on z1 is obtained by compensating the modulation given to z1 in the IFT image,
$$\rho_{f=z1}(x,y,z_1) = e^{j (k_{m1}+k_{m2}+k_{m3}) y} {\rm IFT} \left[v(k_x,k_y) \right]\ =\rho(x,y,z_1) +\rho(x,y,z_2) e^{j k_{m1} y} +\rho(x,y,z_3) e^{j (k_{m1}+k_{m2}) y} ...(2)$$
Temporary reconstructed image focused on z1 is disturbed because other slice images are superimposed on the focal plane image $$$ρ(x,y,z_1)$$$. To remove out-of-focus slice images, CNN is trained with the temporal reconstructed image as input and the slice image as the teacher image. U-Net was used for the CNN.
Results
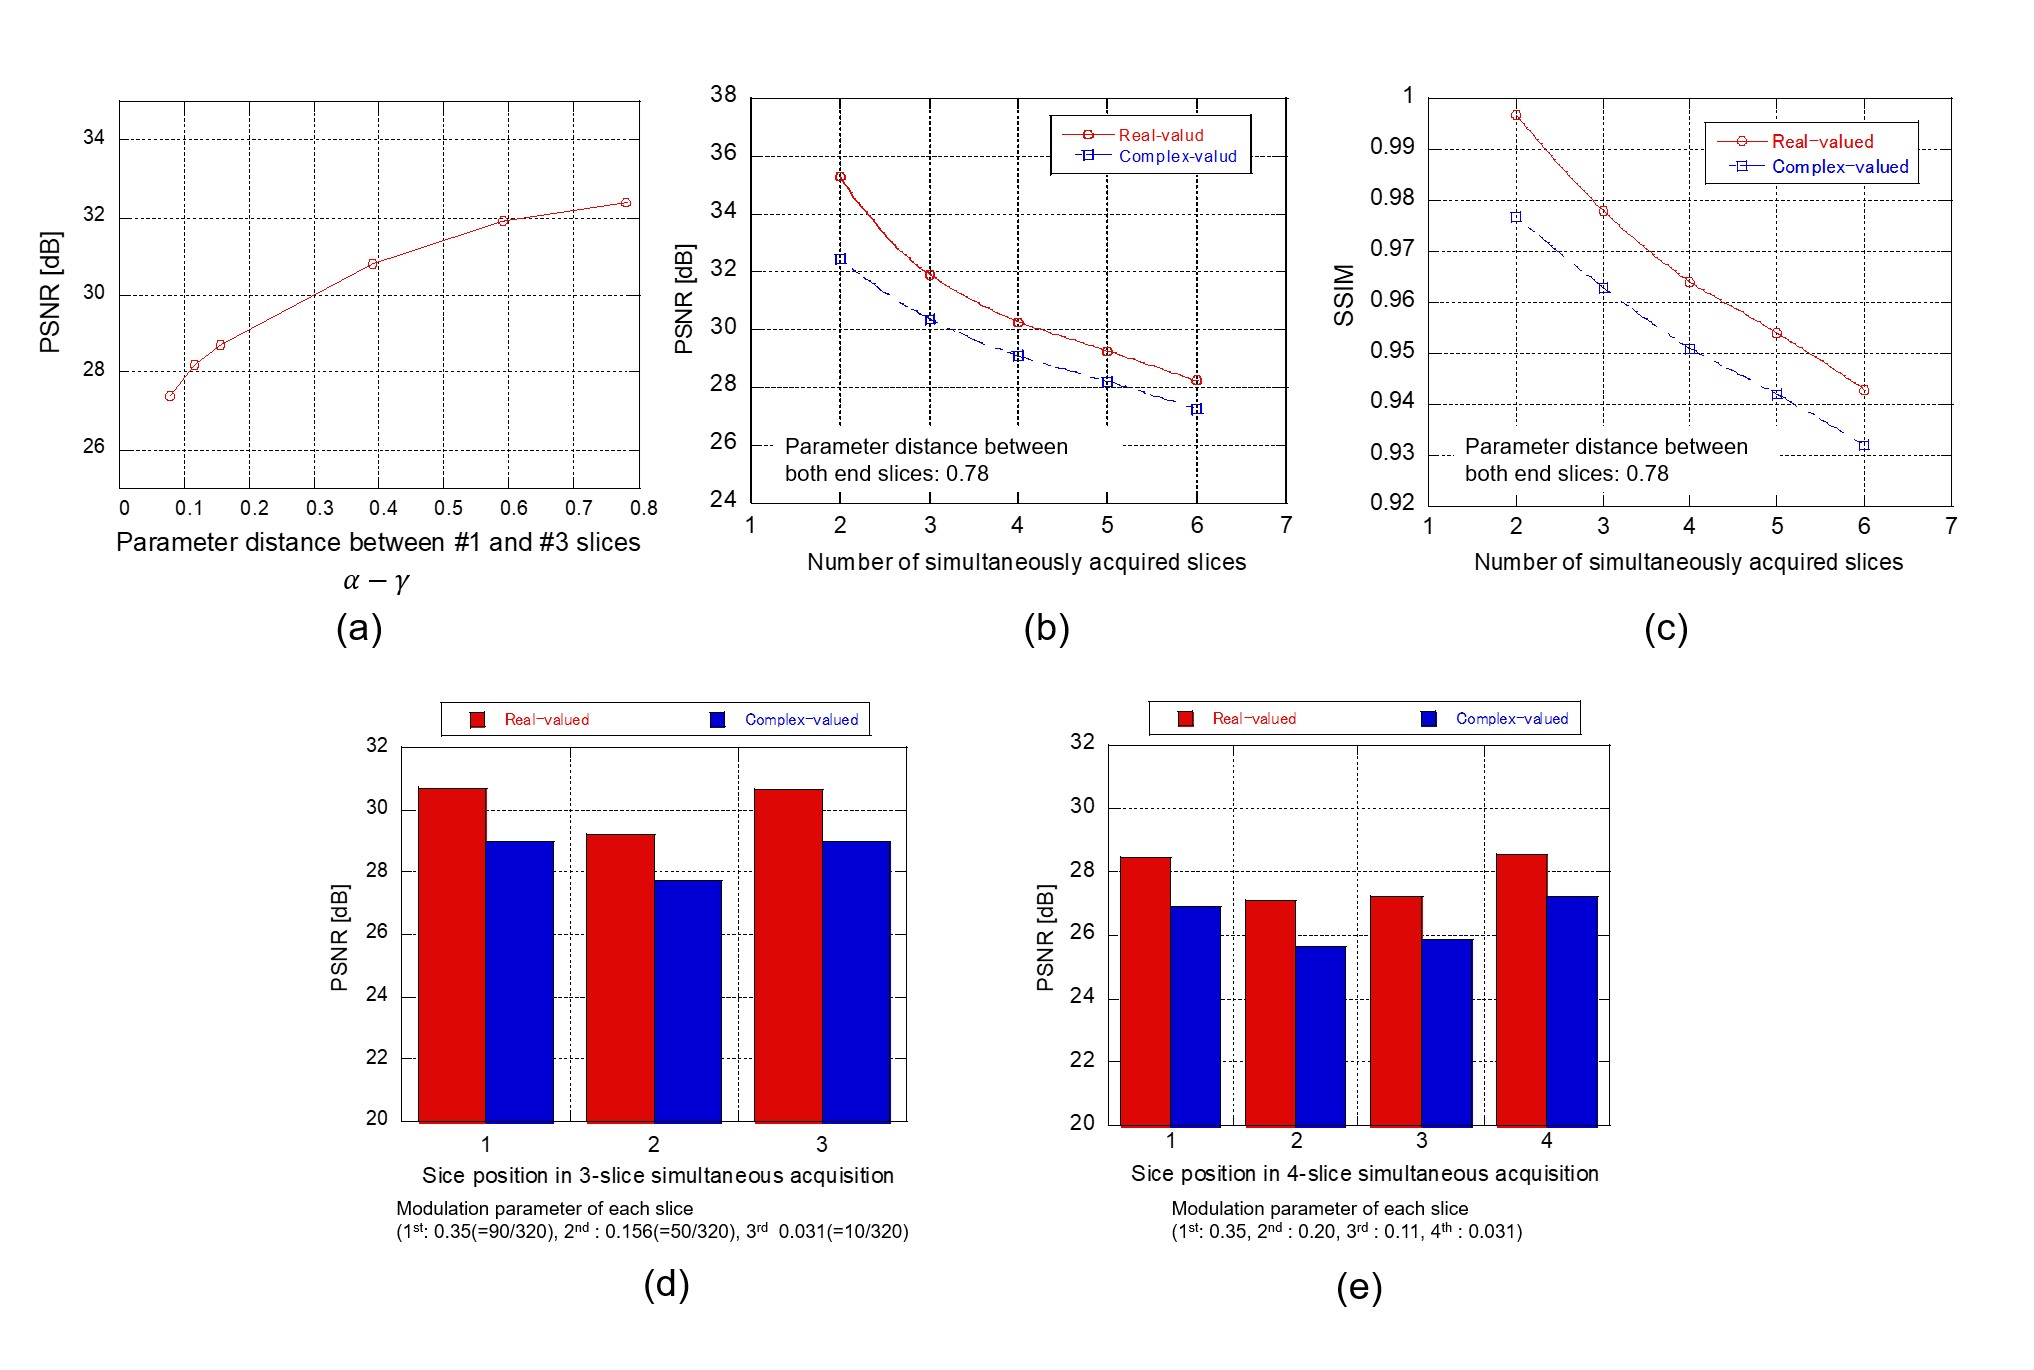
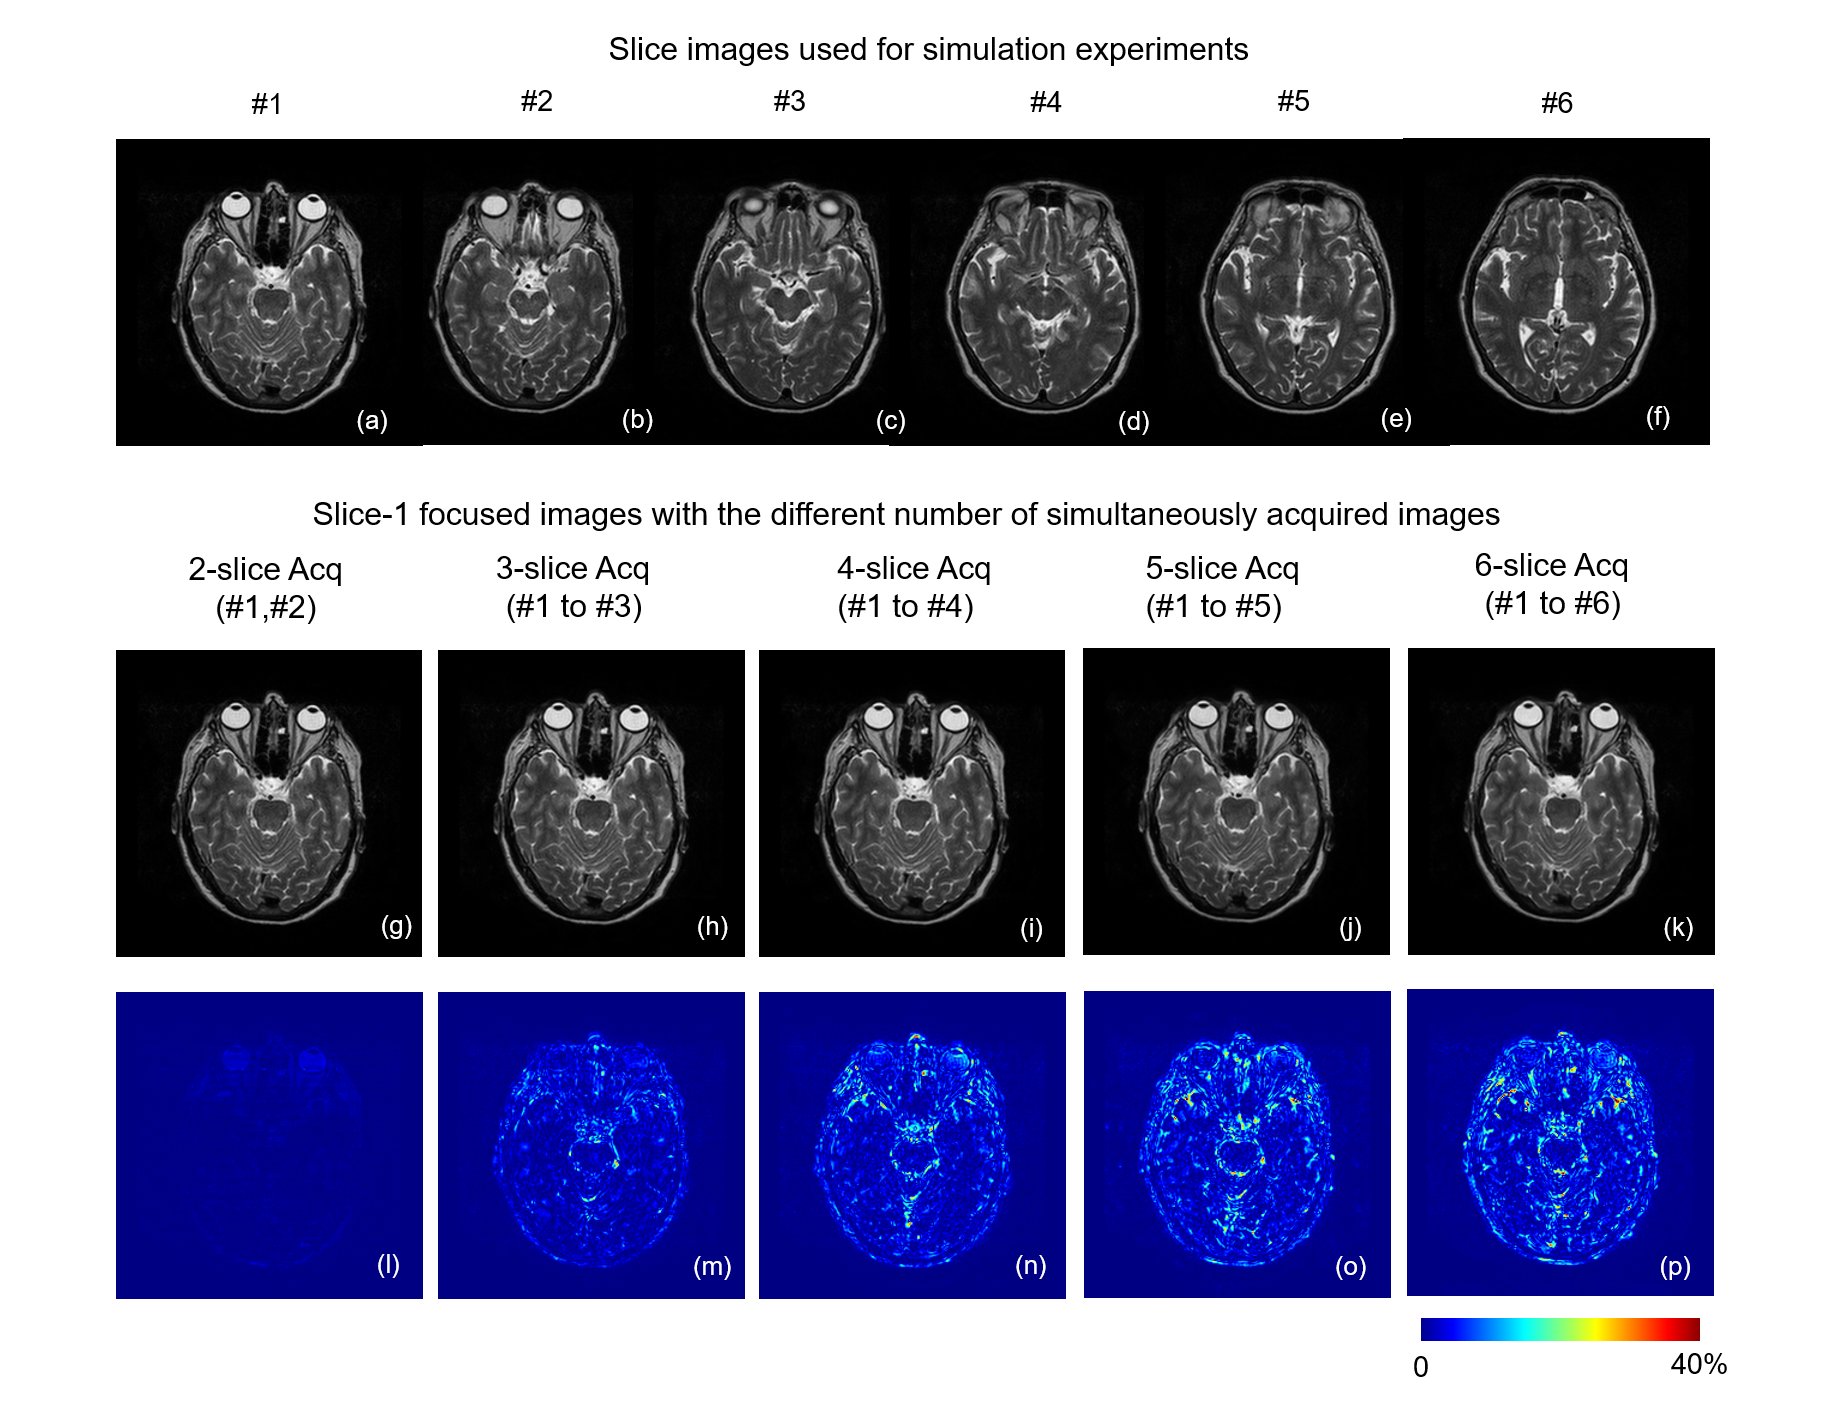
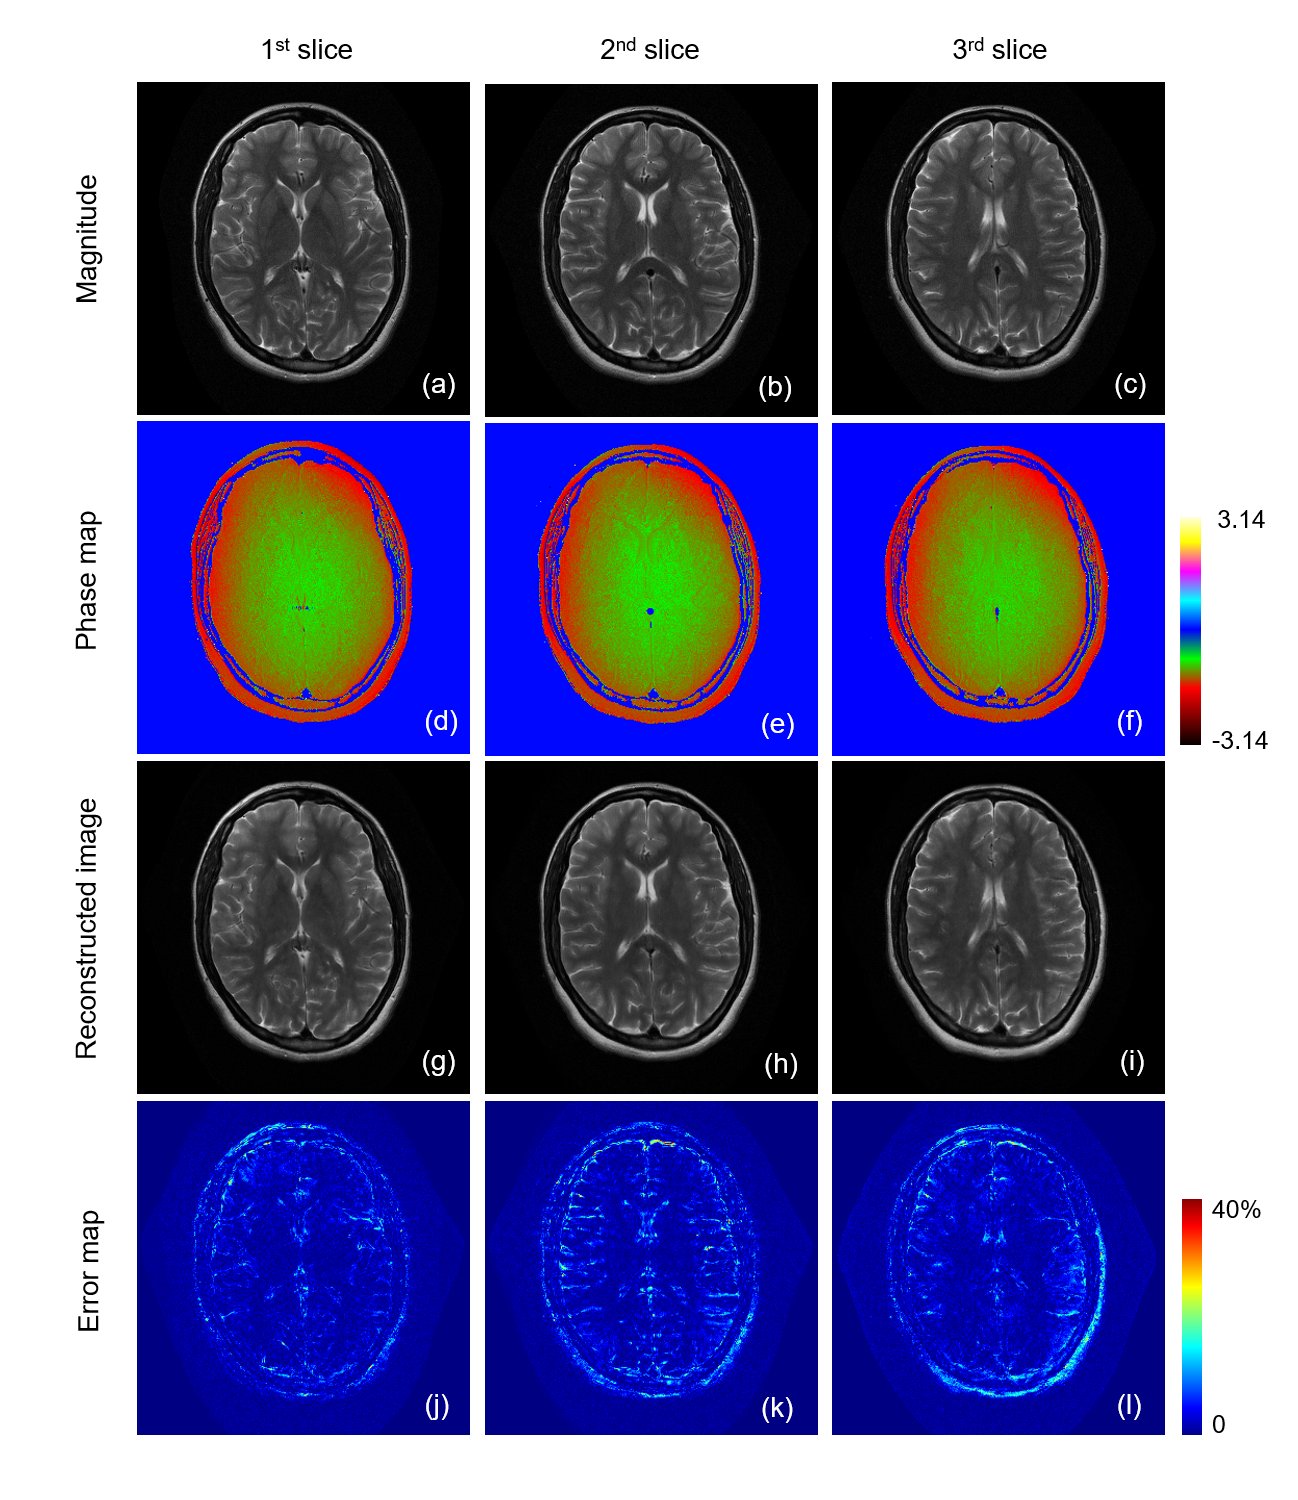
Let the maximum modulation frequency given by the sampling theorem be $$$k_{max}$$$, the phase modulation coefficients can be expressed as $$$ k_{m1} = \alpha k_{max}, k_{m2} = \beta k_{max}, k_{m3} = \gamma k_{max} (\alpha, \beta, \gamma <1) $$$. Figure 3(a) shows the relationship between the difference in modulation coefficients $$$(\alpha-\gamma)$$$ ($$$\gamma$$$ is fixed 0.04) of the two end slices-1 and slice-3 and the average PSNR in 3-slice SMS. The $$$k_{m2}$$$ is set to the middle value at both ends $$$ (k_{m1}+ k_{m3})/2 $$$. The images used for training were 1400 T2-weighted images from the IXI dataset [4] (250 images for validation, 250 images for testing, 256x256 pixel, pixel size 0.89×0.89 $$$mm^3$$$. Each slice was spaced 3.75 mm apart). Figure 3(a) suggests that the slice separation performance increases with the difference of phase modulation coefficients. Figures 3(b), (c) show the relationship between the number of slices excited simultaneously and the averaged PSNR and SSIM when the parameter distance of both end slices was fixed 0.79. The images used for training were 400 T2-weighted images from fastMRI data set (320×320 pixels, pixel size 0.5mm×0.5mm) [5], 100 images for validation, 100 images for testing). Each slice was spaced 3 mm apart. Since fastMRI image data includes spatial phase variation, the case including phase were examined. Figures 3(b) and (c) indicate that PSNR and SSIM decrease with increasing number of slices. These results indicate the possibility of image separation in the case of phase-varied images, even though PSNR and SSIM become lower than in the case of real-valued image’s case.Figure 4 shows the reconstructed image of slice number 1 for different slice number SMS in the case of a real-valued image. Figure 5 shows the simulation results for the simultaneous 3-slice excitation using phase varied images, which is assumed to be close to the actual situation. Figure 3 shows the PSNR for each slice position in the case of 3-slice and 4-slice SMS. Figure 3 shows that the PSNR was higher at both ends of the slices, while the slice closer to the center had lower PSNRs. We consider that the PSNR is reduced because of the small difference in phase modulation coefficients between the center slice and the two end slices.Conclusion
We proposed a new SMS that separate slice images using deep learning and amplitude modulation given to each slice. Simulation studies show promise as an new SMS from perspective that integrates measurement and reconstruction.Acknowledgements
We acknowledge Imperial College London and NYU for providing the IXI data set and fastMRI Dataset.References
[1] Barth M, Breuer F, Koopmans PJ, et al:Simultaneous multislice(SMS)imaging techniques. Magn Reson Med vol.75, pp.63-81, 2016
[2] Ito S, Yamada Y, Image Reconstruction in Magnetic Resonance Diffractive Imaging Technique, 7th ISMRM, Kyoto Japan, no.351, 2004
[3] Ito S, Ono A, Yamada Y, Magnetic Resonance Diffractive Imaging, IEEE Transaction on Biomedical Engineering, vol. 49, no.6, pp.574-583, 2002
[4] Imperial College London. IXI dataset. https://brain-development.org/ixi-dataset/
[5] NYU Langone Health fastMRI Dataset. https://fastmri.med.nyu.edu/
Figures