2778
3D multiple overlapping-echo detachment (3D-MOLED) imaging for ultrafast simultaneous T2* and susceptibility mapping of whole-brain1Department of Electronic Science, Xiamen University, Xiamen, China, 2Department of Radiology, Zhongshan Hospital (Xiamen), Fudan University, Xiamen, China, 3Clinical & Technical Support, Philips Healthcare, Shenzhen, China, 4Department of Imaging Sciences, University of Rochester, Rochester, NY, United States
Synopsis
Keywords: Quantitative Imaging, Relaxometry, QSM
Motivation: Current high-resolution T2* and susceptibility mapping techniques remain time-consuming or suffer from geometric distortion.
Goal(s): Our goal was to achieve distortion-free and time-efficient quantification of whole-brain T2* and susceptibility.
Approach: The multiple overlapping-echo detachment imaging (MOLED) method was extended to 3D acquisition for collecting more echoes for robust high-resolution parametric mapping. Single scan blip-up-down operation of two echo trains combined with deep learning reconstruction was used for distortion correction.
Results: 3D-MOLED enables high-quality T2* and susceptibility mapping in 32 seconds, comparable to conventional 3D-GRE in 12 minutes, with Pearson’s correlation coefficient of 0.983 and 0.986, respectively.
Impact: Distortion-free whole-brain T2* and susceptibility mapping at isotropic 1 mm3 resolution can now be achieved using our newly developed 3D-MOLED technique in only 32 seconds, which significantly improves the motion robustness of quantitative imaging in clinical examinations.
Introduction
Quantitative MR imaging is moving toward shorter scan times and higher spatial resolution.1 T2* and tissue susceptibility are natural imaging biomarkers that provide great sensitivity and specificity in detecting several diseases in the nervous system, such as microbleeds, multiple sclerosis and quantification of iron deposition.2,3 As a commercially available method for T2* mapping and quantitative susceptibility mapping (QSM), 3D-GRE typically requires acquisition times of at least 5 minutes, which increases patient discomfort and raises the failure rate due to unavoidable motion. Previous studies have proposed using 3D-EPI to accelerate T2* or susceptibility mapping. However, some of these methods may only acquire a limited number of echoes or suffer from geometric distortion, hindering their application in clinics.4,5 To address these challenges, we developed the multiple overlapping-echo detachment (MOLED) technique6,7 to 3D acquisition, termed 3D-MOLED sequence, and applied it to quantify whole-brain T2* and susceptibility. We demonstrate that the fast 3D-MOLED enables motion-robust and distortion-free parametric mapping with quality comparable to the conventional 3D-GRE method.Methods
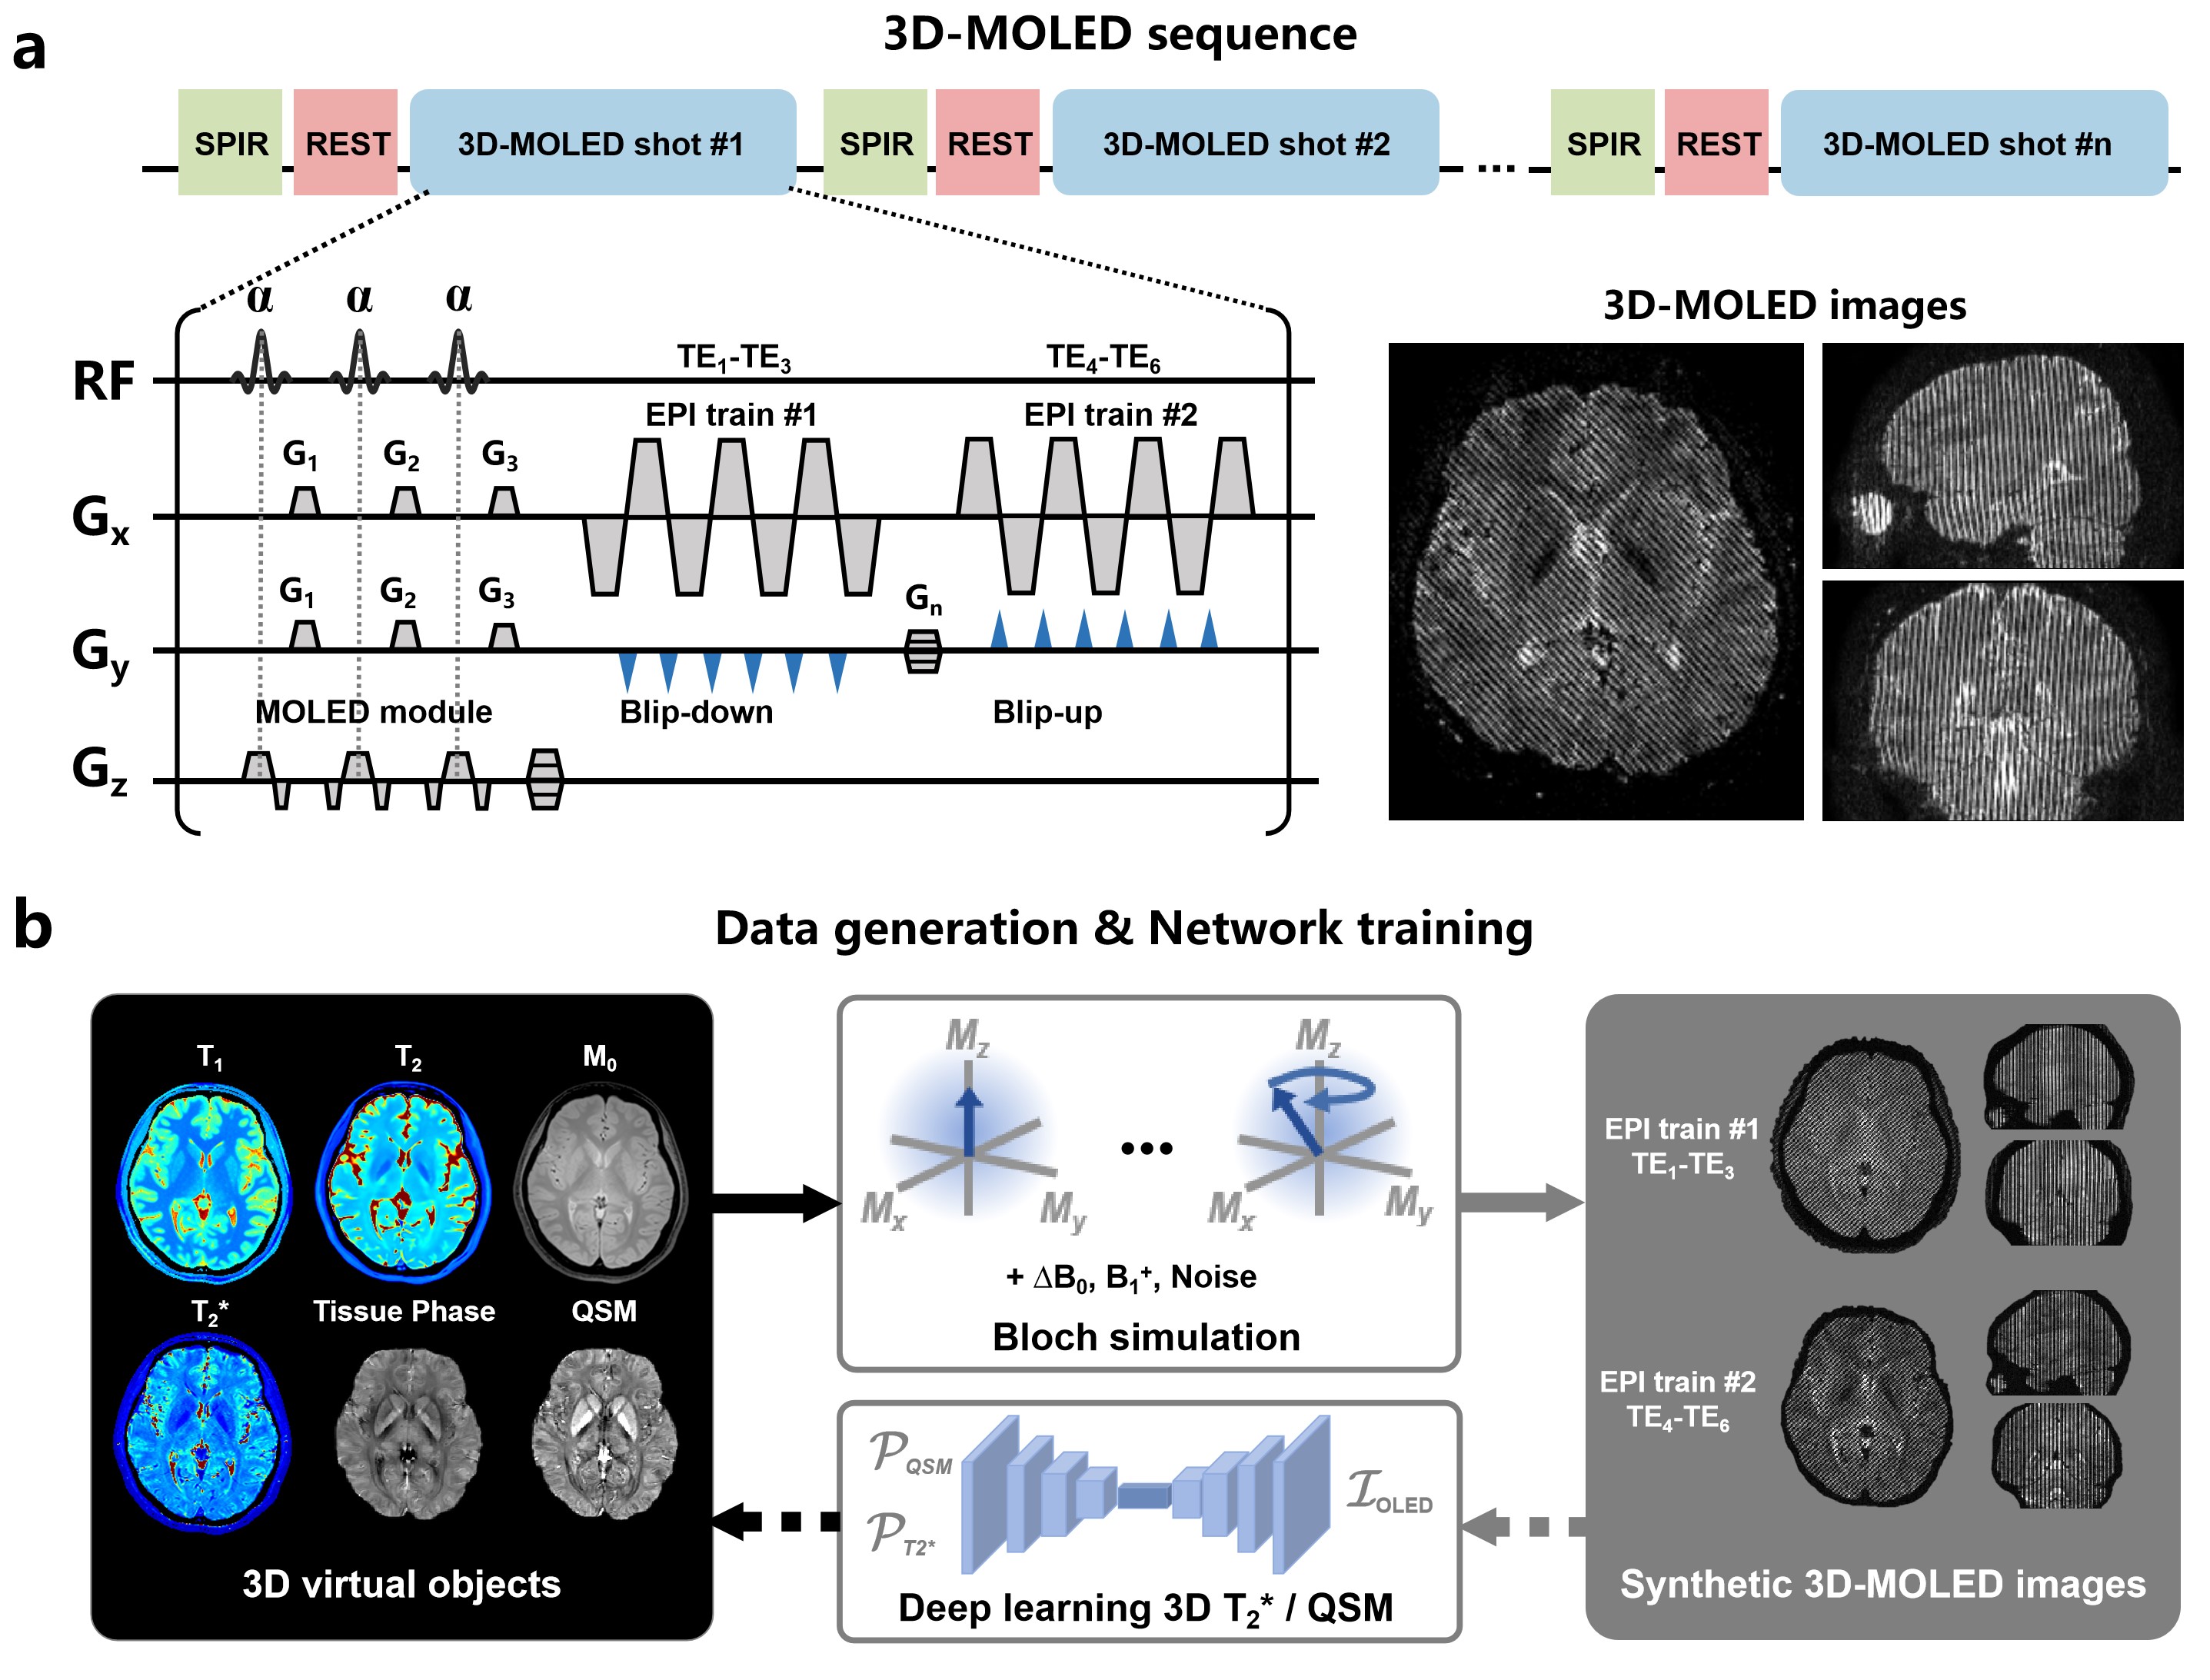
Pulse sequence: In the 3D-MOLED sequence (Figure 1a), three excitation pulses and two EPI readout trains are applied. The echo-shifting gradients G1-G3 enable echo-specific phase modulation to simultaneously acquire multiple echo signals with different evolution times during EPI readout. Opposite blip polarity is used on the two EPI trains for single-scan distortion correction, and therefore, the gradient Gn is used to shift echoes. Before 3D-MOLED acquisition, the SPIR and REST modules were used for fat suppression and regional saturation, respectively.In vivo experiments: All experiments were conducted on a 3T whole-body MRI system with a 32-channel head coil (Ingenia CX; Philips Healthcare). The data of 3D-MOLED were acquired with the following parameters: FOV = 224×224×128 mm3, spatial resolution = 1.0×1.0×1.0 mm3, slice number = 128, flip angle = 10°, TE (EPI train #1) = 11.4, 22.6, 33.7 ms, TE (EPI train #2) = 49.4, 51.6, 53.8 ms, TR = 88.0 ms, EPI factor = 27, SENSE acceleration factor = 2×2, acquisition time = 32 s. The 3D multi-echo GRE sequence used for reference T2* mapping at 1.0×1.0×1.0 mm3 resolution was acquired with six echo times (5, 12, 19, 26, 33, 40 ms) and TR = 52 ms. The acquisition time of GRE was 12 min.
Deep learning parametric mapping: A 3D-UNet was applied to handle the 3D parametric mapping from 3D-MOLED data. To obtain training data for supervised learning, we first created a batch of 3D virtual objects from a public database (https://osf.io/y6rc3/) and then generated synthetic 3D-MOLED images through Bloch simulation.8 During data generation, the noise and inhomogeneous B0/B1 fields were considered to match real-world non-ideal imaging conditions. Finally, 576 pairs of 3D samples were generated for network training. Once the network was trained, the complex-valued 3D-MOLED volumes were reconstructed to 3D T2* and susceptibility maps. For comparison, the reference susceptibility maps were calculated in an open-source STI Suite with the iLSQR algorithm.
Results
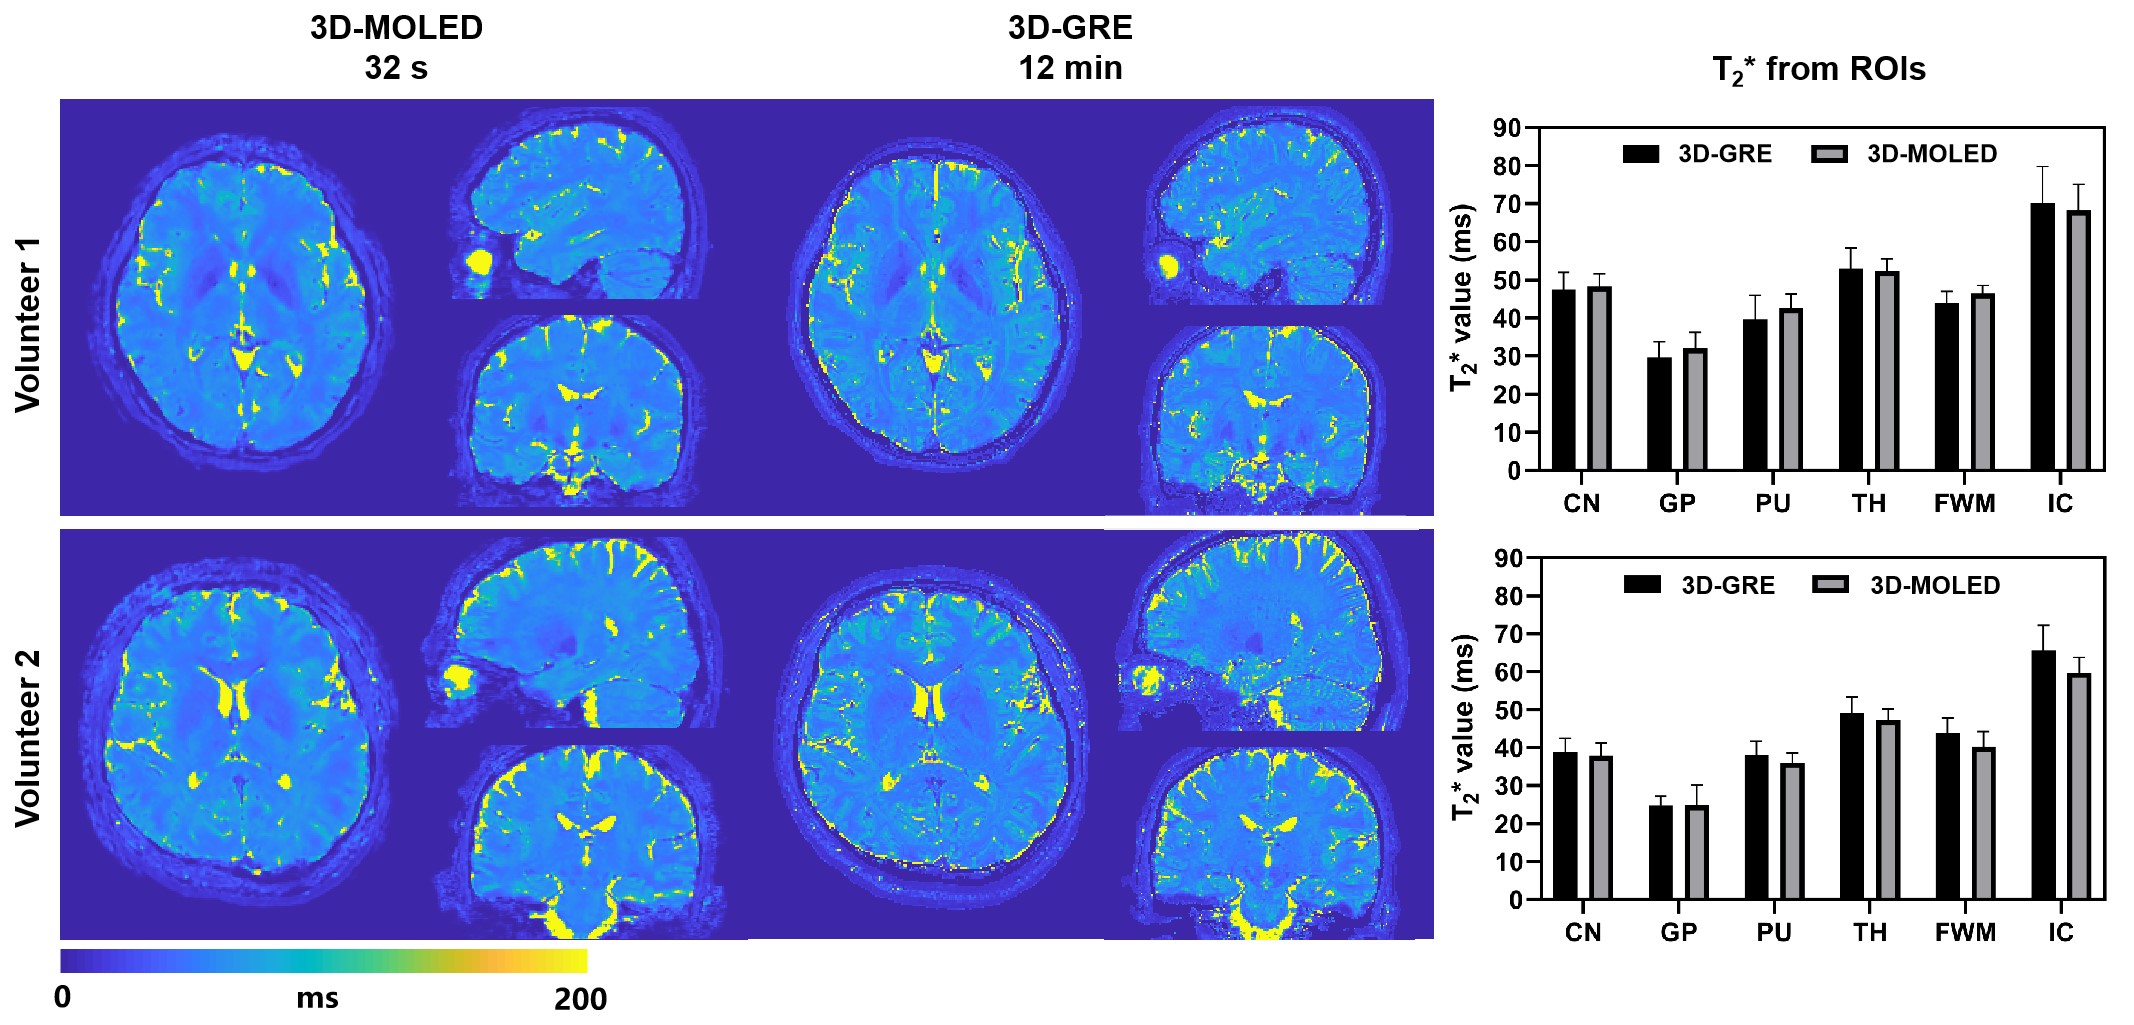
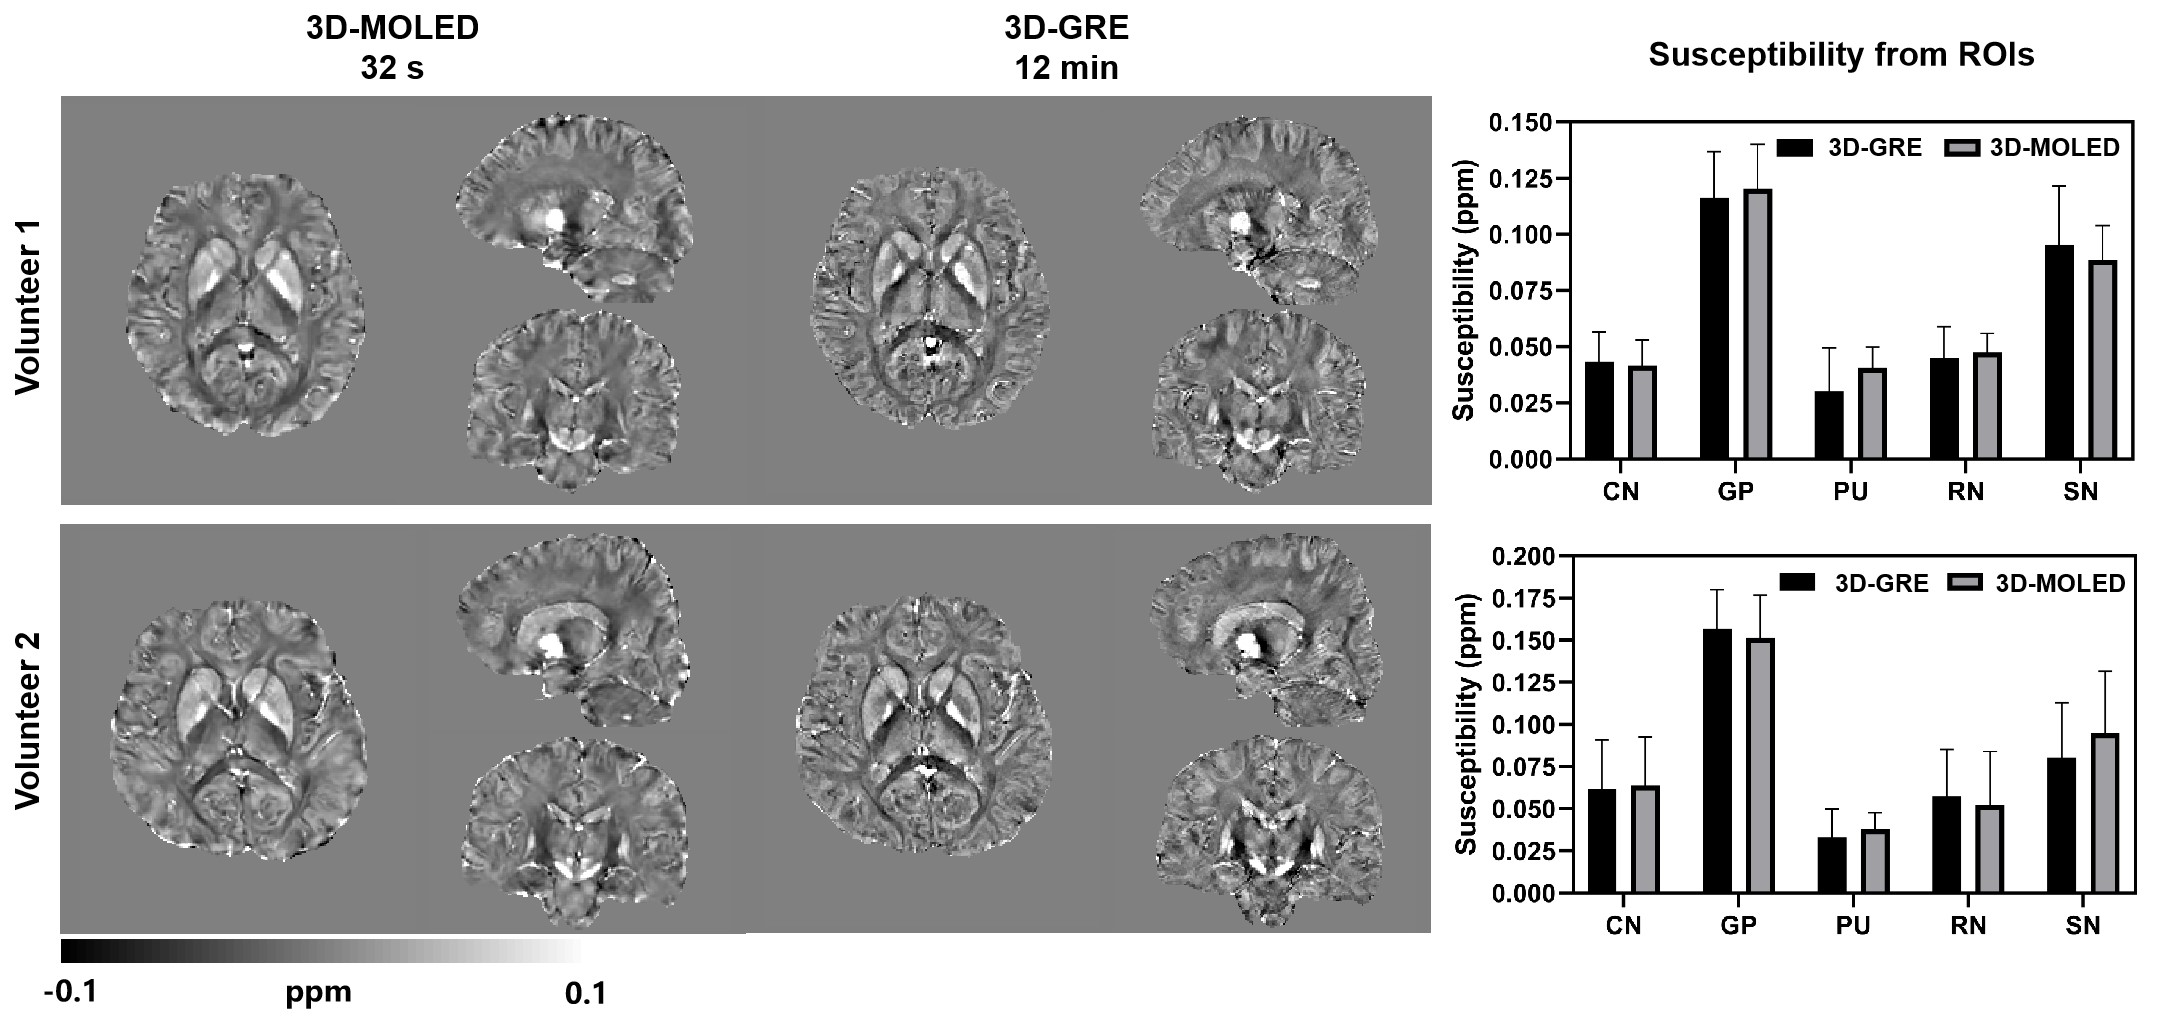
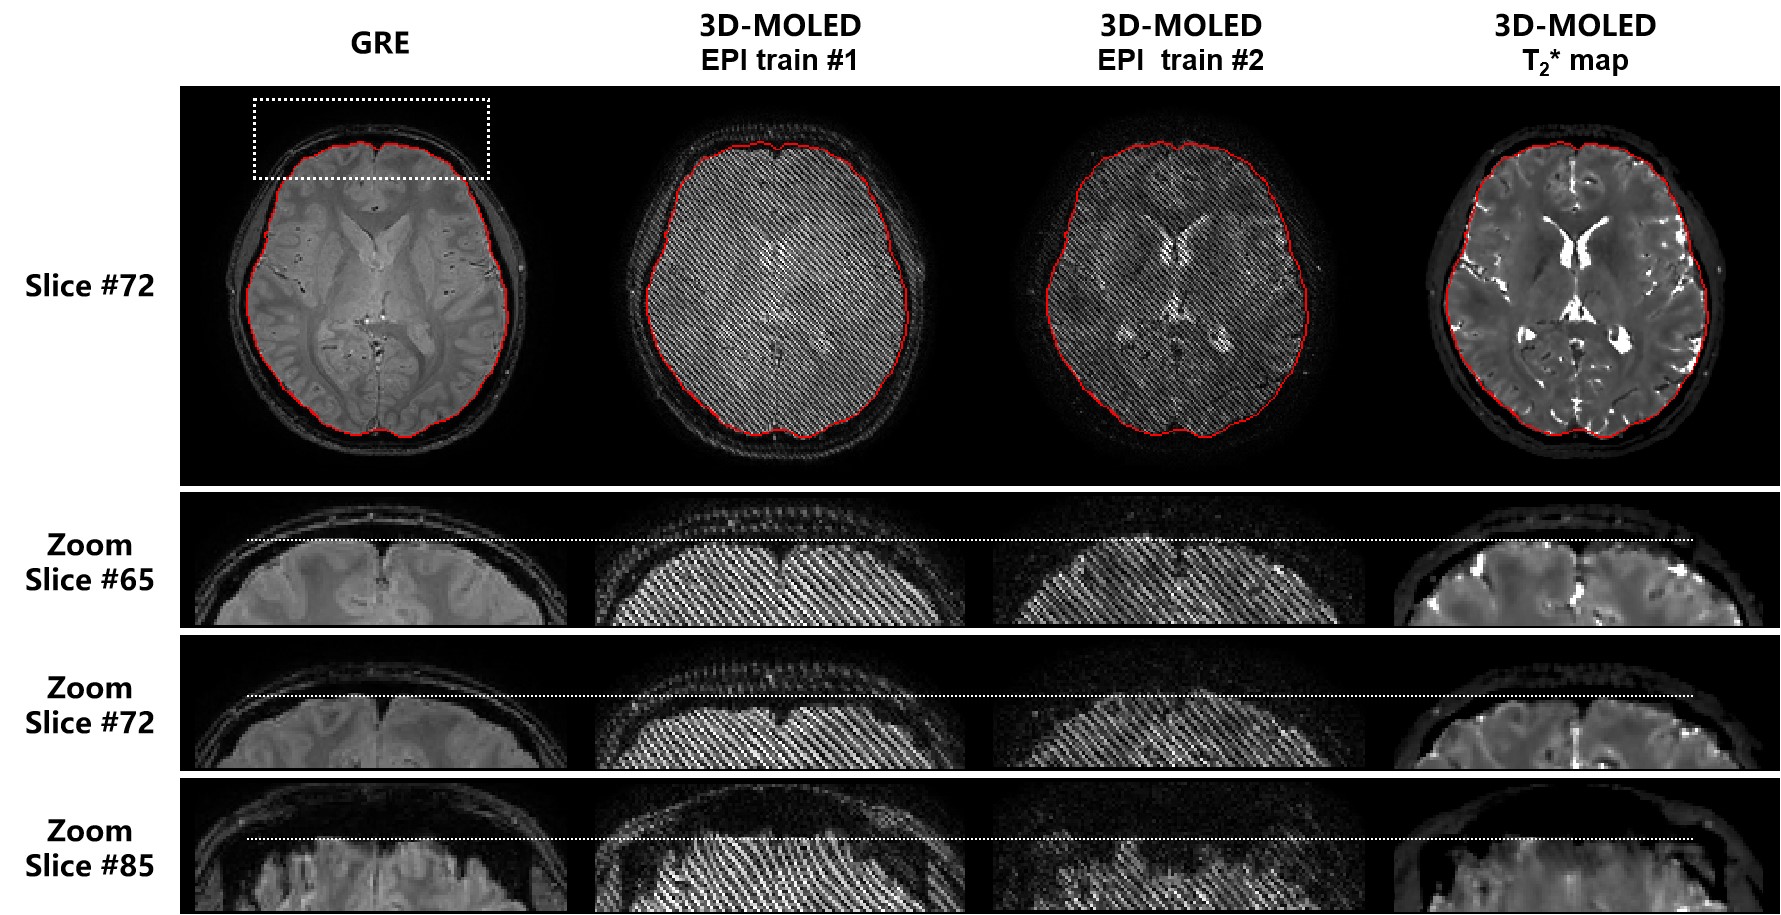
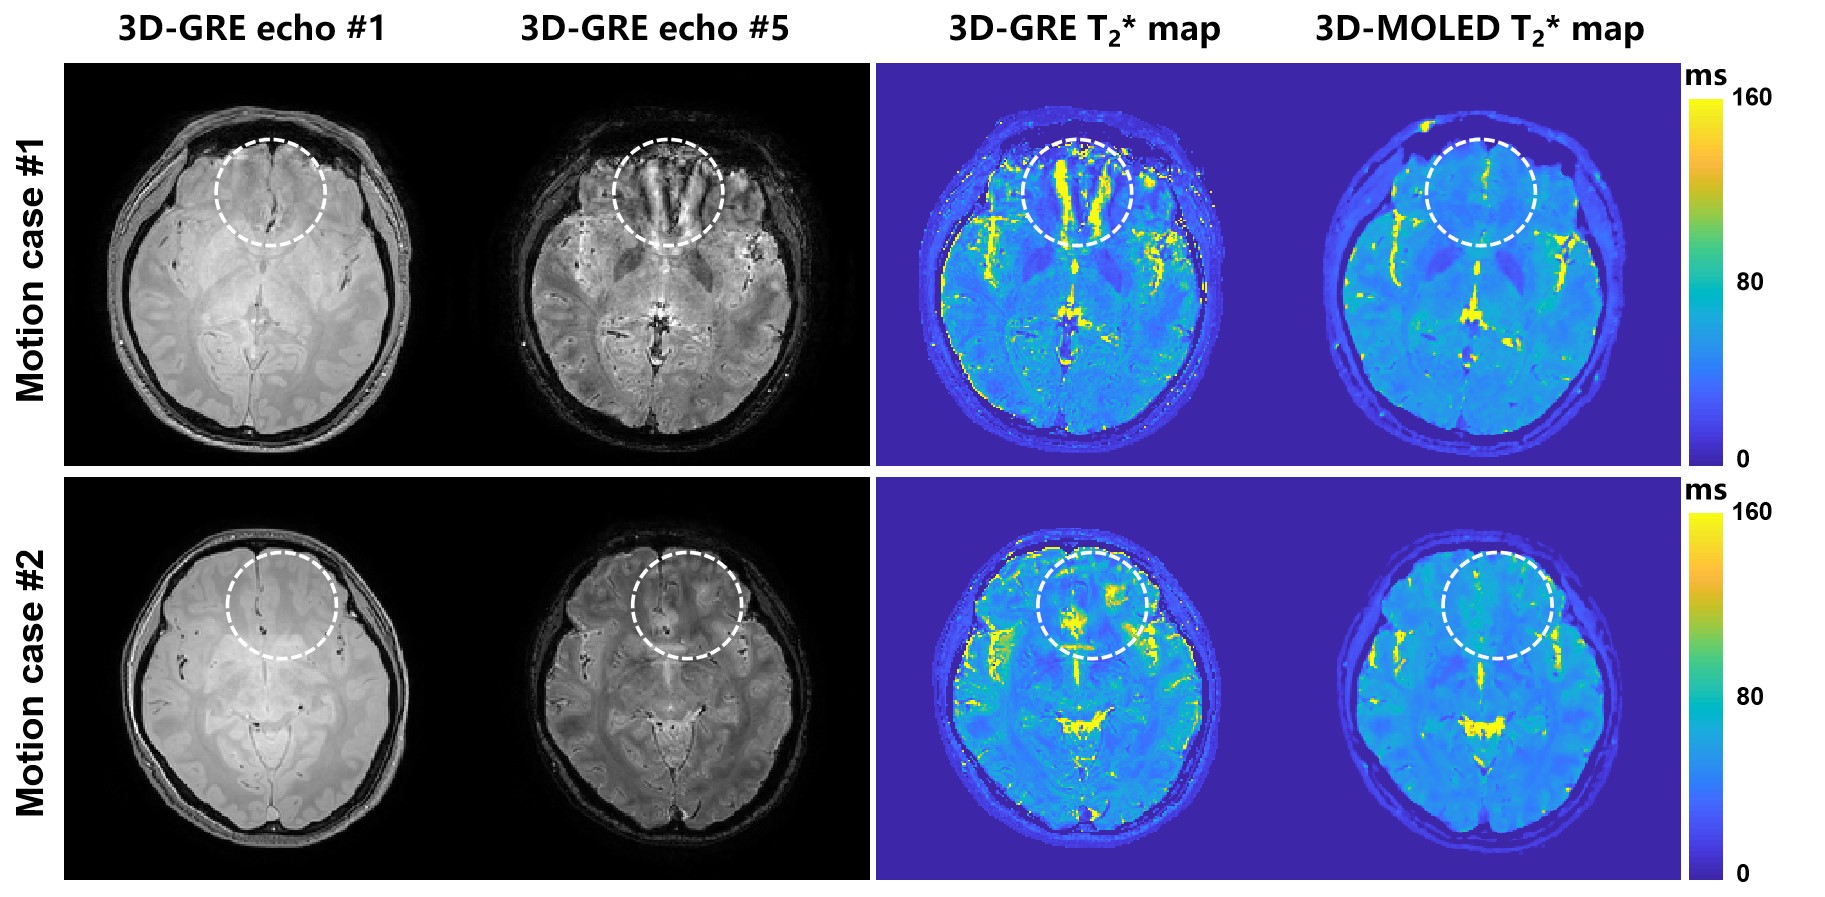
Figures 2 and 3 compare the results of T2* and susceptibility maps at isotropic 1.0 mm resolution using 3D-MOLED and 3D-GRE acquisitions. We can see that 3D-MOLED provides high-fidelity T2* and susceptibility maps with minimal image distortions and aliasing artifacts in 32 seconds, close to the results of 3D-GRE, and achieves high accuracy in ROI analysis. The Pearson’s correlation coefficient of T2* and susceptibility maps was 0.983 and 0.986, respectively. Figure 4 shows the distortion correction capability of 3D-MOLED with blip-up-down EPI trains. Geometric distortions can be seen on the original 3D-MOLED images, whereas the reconstructed T2* maps are distortion-corrected and comparable to GRE images. As shown in Figure 5, the comparison of motion robustness between the two methods demonstrates that 3D-MOLED is significantly more robust than 3D-GRE. The white dotted circle marks the area affected by motion artifacts. We can see that the visible artifacts in the multi-echo GRE images result in overestimation of the T2* maps, whereas 3D-MOLED images do not suffer from any visible motion-related degradation.Discussion and conclusion
This study demonstrates that 3D-MOLED can provide whole-brain T2* and susceptibility maps comparable to conventional 3D-GRE with extremely high efficiency and motion robustness. MOLED encoding enables the collection of more echo signals to achieve robust parameter quantification. Blip-up-down acquisition of two echo trains further realizes distortion correction in a single scan. In addition, unlike conventional QSM reconstruction methods, our proposed method utilizes deep learning to mine susceptibility distribution directly from the acquired overlapping-echo images, avoiding errors introduced by phase unwrapping or background field removal. Future work includes applying 3D-MOLED to patients to explore its potential clinical value.Acknowledgements
This work was supported in part by the National Natural Science Foundation of China under grant numbers 12375291, 82071913 and 22161142024.References
1. Wang F, Dong Z, Reese T, et al. 3D Echo Planar Time-resolved Imaging (3D-EPTI) for ultrafast multi-parametric quantitative MRI. Neuroimage 2022; 250:118963.
2. Linck PA, Kuchcinski G, Munsch F, et al. Neurodegeneration of the substantia nigra after ipsilateral infarct: MRI R2* mapping and relationship to clinical outcome. Radiology.2019;291:437-447.
3. Wang Y, Liu T, Quantitative susceptibility mapping (QSM): decoding MRI data for a tissue magnetic biomarker. Magn Reson Med. 2015:73:82-101.
4. Langkammer C, Bredies K, Poser B, et al. Fast quantitative susceptibility mapping using 3D EPI and total generalized variation. Neuroimage 2015; 111: 622-630.
5. Chen Z, Liao C, Cao X, et al. 3D-EPI blip-up/down acquisition (BUDA) with CAIPI and joint Hankel structured low-rank reconstruction for rapid distortion-free high-resolution mapping. Magn Reson Med. 2023; 89: 1961-1974.
6. Cai CB, Wang C, Zeng YQ, et al. Single-shot T2 mapping using overlapping-echo detachment planar imaging and a deep convolutional neural network. Magn Reson Med. 2018;80:2202-2214.
7. Yang QQ, Ma L, Zhou Z, et al. Rapid high-fidelity T2* mapping using single-shot overlapping-echo acquisition and deep learning reconstruction. Magn Reson Med. 2023;89:2157-2170.
8. Yang QQ, Lin YH, Wang JC, et al. Model-based synthetic data-driven learning (MOST-DL): application in single-shot T2 mapping with severe head motion using overlapping-echo acquisition. IEEE Trans Med Imaging. 2022;41:3167-3181.
Figures