2773
Ultra-High Field 2D TOF MRA of Pelvis and Lower Extremity: Comparison of 5T and 3 T1Institute of Science and Technology for Brain-Inspired Intelligence, Fudan University, Shanghai, China, Shanghai, China, 2Radiology, Zhongshan Hospital, Fudan University, Shanghai, China, Shanghai, China, 3United Imaging Healthcare, Shanghai, China, Shanghai, China, 4Central Research Institute, United Imaging Healthcare Group, Shanghai, China, Shanghai, China
Synopsis
Keywords: Vessels, Blood vessels
Motivation: The introduction of ultra-high field 5 tesla (T) system provides brand-new opportunities in whole-body MR that can potentially be applied in peripheral MR angiography (MRA).
Goal(s): This study performed two-dimensional (2D) time-of-flight (TOF) MRA of the lower body in ten healthy volunteers for both 3T and 5T systems.
Approach: MRA with high spatial resolutions (true voxel sizes, 1$$$\times$$$1.25$$$\times$$$2) from different field strengths were evaluated quantitively and qualitatively.
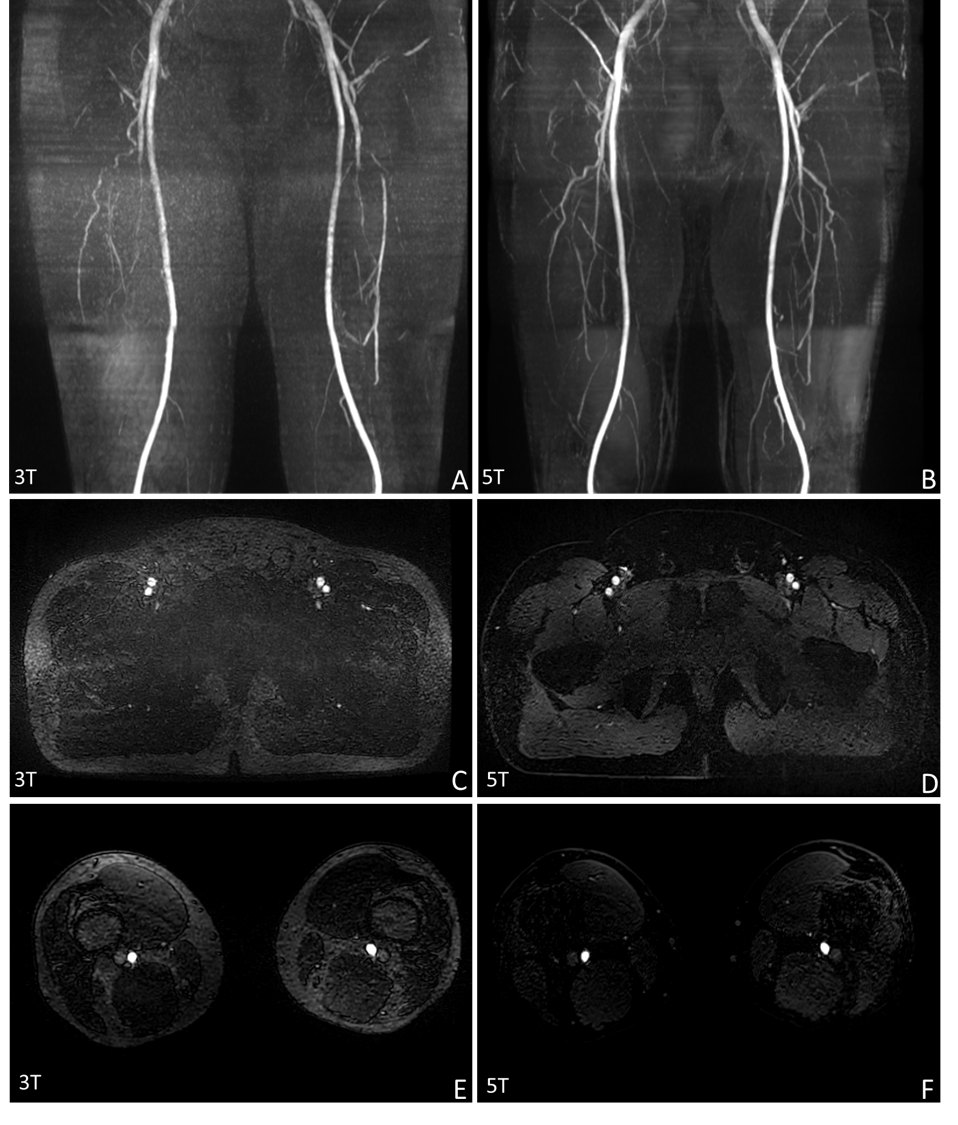
Results: 2D TOF MRA at 5 T is capable of providing superior vessel delineation and image quality (in both quantitative and subjective assessment) to 3 T.
Impact: This comparative study demonstrated the superiority of 5T to 3T in TOF MRA for pelvis and lower extremities. 5T TOF MRA provides a possible alternative for the clinical assessment of peripheral arteries.
Introduction
Electrocardiography (ECG)-gated 2D time of flight (TOF) technique is commonly used for evaluating pelvis and lower extremity arteries without the injection of contrast agents1, 2. Previous studies have demonstrated that the increase in field strength improves the delineation of vessel structures and diagnostic accuracy in TOF MRA3-6. While body imaging poses challenges for the 7 T system, the introduction of an ultra-high field whole-body MR system at 5 T opens up new opportunities for peripheral MRA, with further improved image quality.This study aims to investigate the efficacy of peripheral NCE-MRA at 5 T. 2D TOF was optimized for 5 T field strength, while keeping scanning time and resolution the same as those used at 3 T. The performance was evaluated on ten healthy volunteers and compared with the results obtained at 3 T.
Method
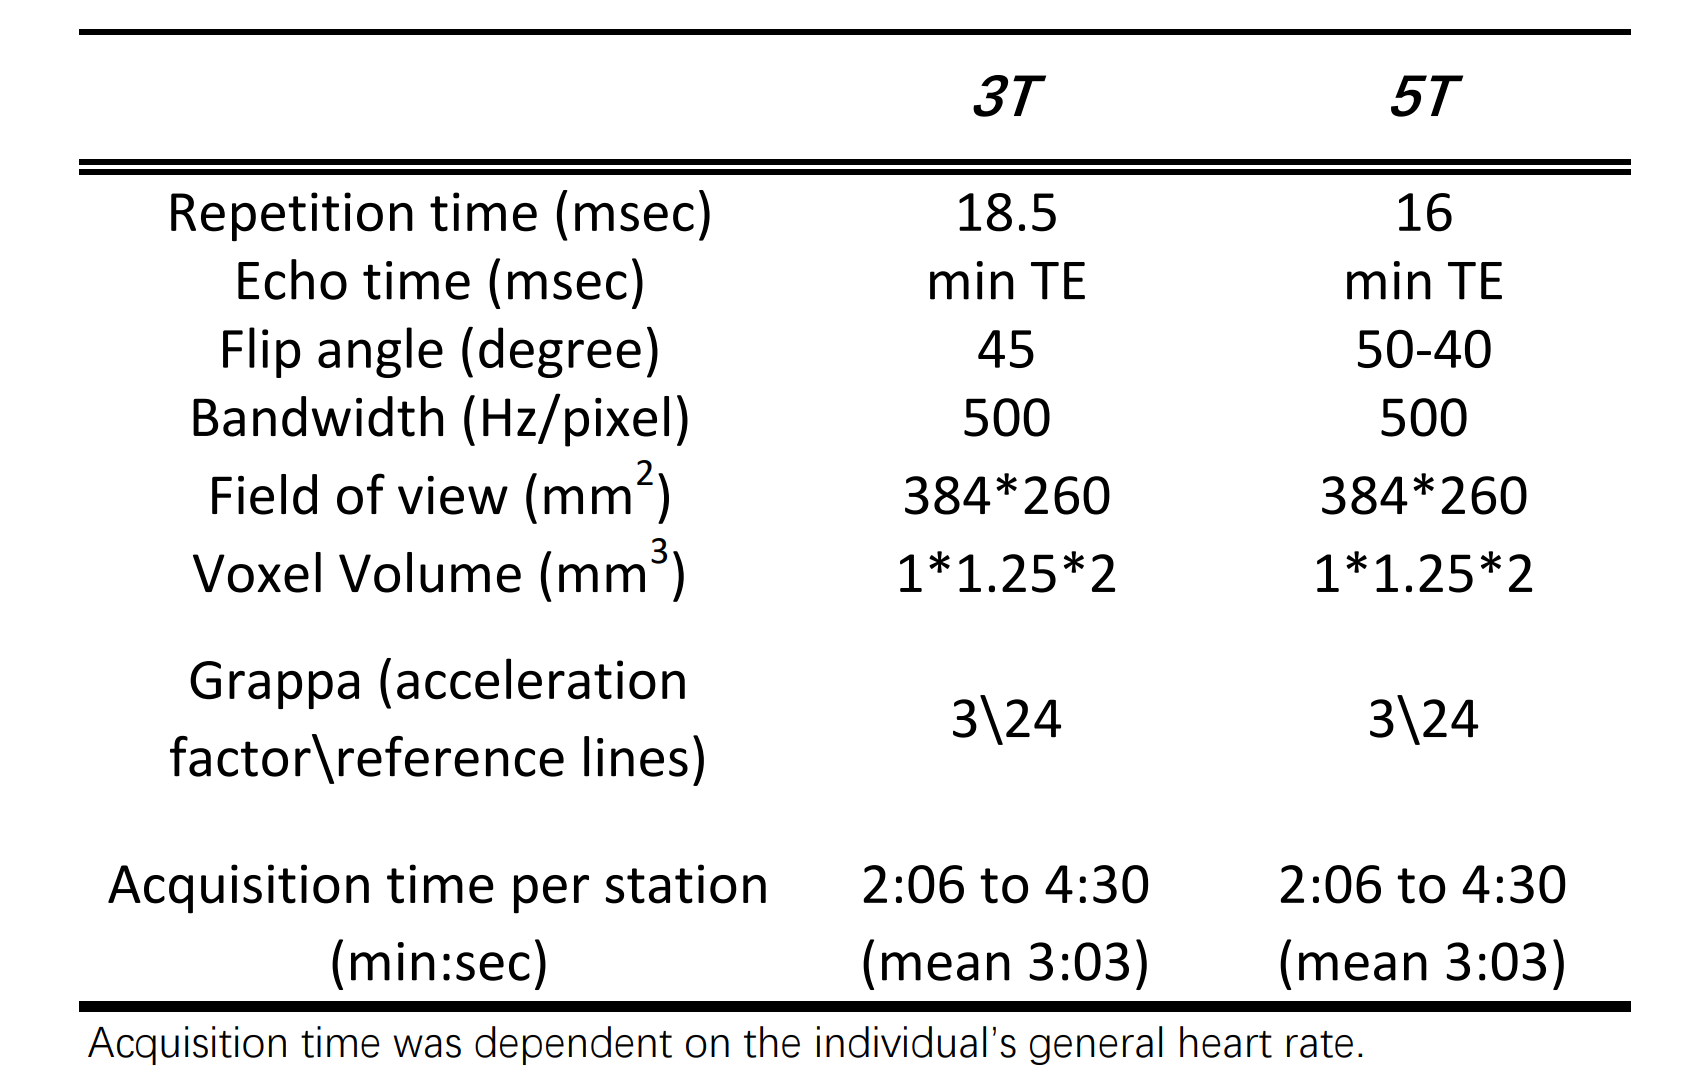
Image Acquisition2D TOF MRA of the lower body was performed using a 5 T whole-body MRI system (uMR Jupiter, United Imaging Healthcare) and a 3 T whole-body MRI system (uMR 790, United Imaging Healthcare) in ten healthy volunteers (6 men, 4 women; mean age 41$$$ \pm $$$8 years). Most of the acquisition parameters were kept consistent between 3 T and 5 T (summarized in Table 1). A total of 70 transversal slices were acquired per station with 10% overlap between each station. Twenty-nine phase encoding steps are acquired per heartbeat, and three R-R intervals are required to image a single slice.
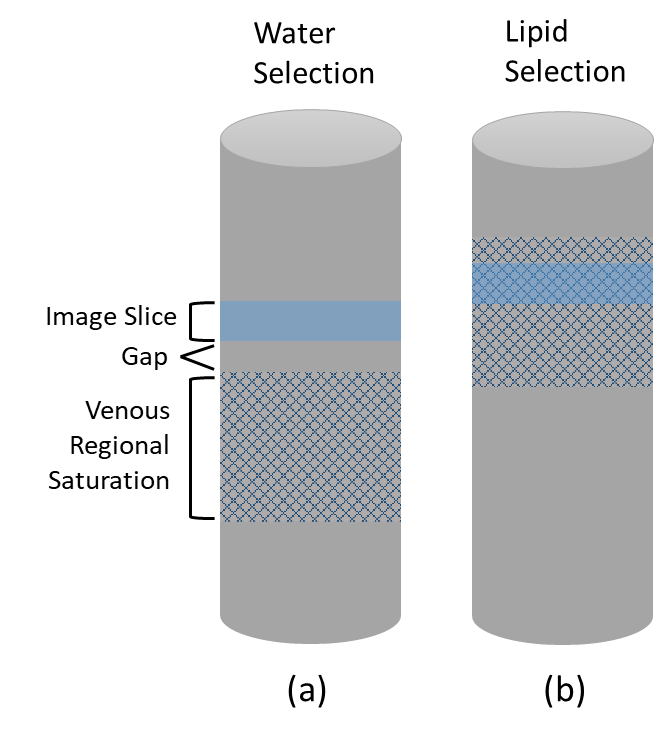
SLIP (spatially separated lipid presaturation) technique is incorporated into 5 T 2D TOF sequence7. By carefully manipulating the amplitude and polarity of the slice selection gradient, the chemical shift effect can result in a large displacement of the venous saturation slab and a small displacement of the image slice in the slice-selection direction (Figure 1)7. This displacement causes an overlap of the “lipid slice” and the “lipid slab” to suppress the lipid signal without impacting the water signal. SLIP was not implemented in TOF at 3 T due to insufficient chemical shift effect.
Imaging Analysis
The arterial tree was classified into 33 segments for qualitative and quantitative evaluation. TOF MRA images were graded by an experienced radiologist, who was blinded to the acquisition technique and the field strength. The evaluation was performed on coronal and sagittal maximum intensity projections according to vessel delineation, and the presence of image noise and artefacts by using a four-point scale. The pairwise comparison of radiologist scoring between 3 T and 5 T was conducted by the Wilcoxon signed-rank test with false discovery rate (5%).
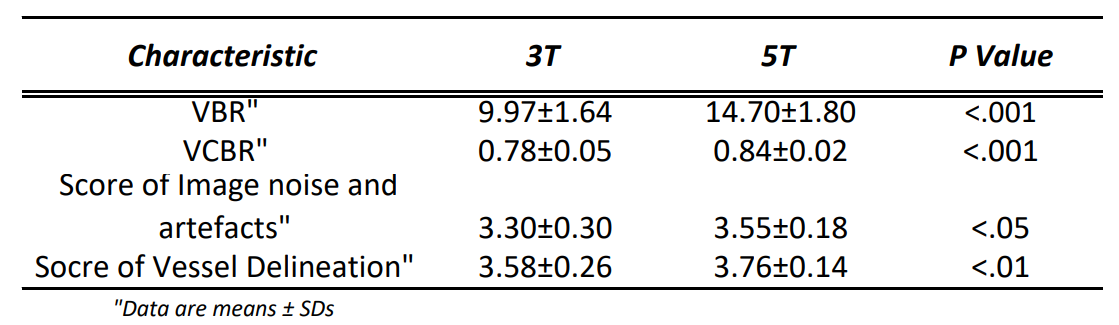
For quantitative evaluation, vessel-to-background ratio: $$VBR = Signal_{Vessel}/Signal_{Tissue}$$ and vessel contrast-to-background ratio: $$VCBR = ({Signal_{Vessel}-Signal_{Tissue}})/({Signal_{Vessel}+Signal_{Tissue}})$$ were calculated for each vessel segment. A pairwise one-sided t-test was performed to check for statistically significant differences between the different field strengths.
Results
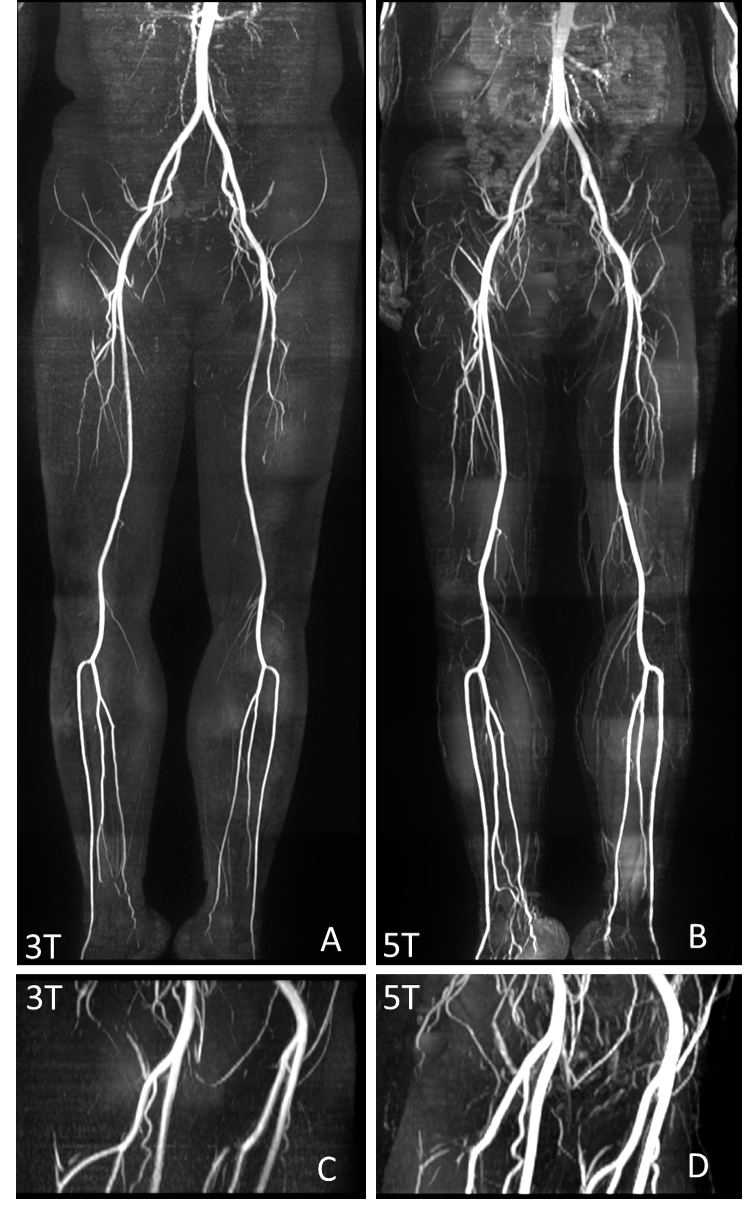
Figure 2 compares example maximum intensity projections (MIPs) of all acquired stations for one volunteer in 3 T and 5 T MRI system. Improved visualization of branch details and artery contrast can be observed at 5 T compared to 3 T. 5 T TOF sequence has also exhibited superior fat suppression capability than 3 T (Figure 3). As shown in Table 2, VBR as well as VCBR was significantly higher on 5 T images than on 3 T images (P< .001). Qualitative scores for vessel delineation and image quality at 5 T (3.76$$$ \pm $$$ 0.14 and 3.55$$$ \pm $$$0.18 respectively) are higher than that at 3 T (3.58$$$ \pm $$$ 0.26 and 3.30$$$ \pm $$$ 0.30 respectively) (P< .05).Discussion and Conclusion
This study compared peripheral 2D TOF MRA at 3 T and 5 T. The VBR and VCBR of 5 T is significantly higher than that of 3 T (P< .001), indicating signal gain comes with increased field strength. The radiology’s scores in terms of vessel delineation and image noise and artefacts at 5 T were also higher than that at 3 T (P< .05). Another advantage of 5 T is the easier implementation of the SLIP technique due to more pronounced chemical shift effect at higher field strength7. Future work will recruit patients with peripheral artery disease to explore the diagnostic accuracy of TOF at 5T.In conclusion, the increase in field strength from 3 T to 5 T bring signal gain in the blood signal, leading to improved arteries delineation in 2D TOF MRA for pelvis and lower extremities.
Acknowledgements
No acknowledgement found.References
1. Kaufman JA, McCarter D, Geller SC, Waltman AC. Two-dimensional time-of-flight MR angiography of the lower extremities: artifacts and pitfalls. AJR American journal of roentgenology. 1998;171(1):129-35.
2. Yucel EK, Kaufman JA, Geller SC, Waltman AC. Atherosclerotic occlusive disease of the lower extremity: prospective evaluation with two-dimensional time-of-flight MR angiography. Radiology. 1993;187(3):637-41.
3. Shi Z, Zhao X, Zhu S, Miao X, Zhang Y, Han S, Wang B, Zhang B, Ye X, Dai Y. Time-of-flight intracranial MRA at 3 T versus 5 T versus 7 T: Visualization of distal small cerebral arteries. Radiology 2023;306(1):207-217..
4. Ishisaki JY, Kato H, Zhang X, Kuwatsuru Y, Miyazaki H, Sato S, et al. Comparison of 1.5 T and 3 T non-contrast-enhanced MR angiography for visualization of uterine and ovarian arteries before uterine artery embolization. European Radiology. 2022;32(1):470-6.
5. Merkle EM, Dale BM, Barboriak DP. Gain in signal-to-noise for first-pass contrast-enhanced abdominal MR angiography at 3 Tesla over standard 1.5 Tesla: prediction with a computer model. Academic radiology. 2007;14(7):795-803.
6. Willinek WA, Born M, Simon B, Tschampa HJ, Krautmacher C, Gieseke Jr, et al. Time-of-flight MR angiography: comparison of 3.0-T imaging and 1.5-T imaging—initial experience. Radiology. 2003;229(3):913-20.
7. Doyle M, Matsuda T, Pohost GM. SLIP, a lipid suppression technique to improve image contrast in inflow angiography. Magnetic resonance in medicine. 1991;21(1):71-81.
Figures