2772
Assessment of transplant renal artery stenosis renal function with ASL-MRI and IVIM-MRI1Third Affiliated Hospital of Soochow University, Department of Radiology, Changzhou, China, Changzhou, China, 2Philips Healthcare, Shanghai, China, Shanghai, China
Synopsis
Keywords: Kidney, Perfusion
Motivation: Noninvasive assessment of renal function is necessary in transplanted renal artery stenosis (TRAS), which significantly impacts graft function and prognosis.
Goal(s): The purpose was to evaluate renal function in patients with TRAS using ASL-MRI and IVIM-MRI.
Approach: We used ASL-MRI and IVIM-MRI to evaluate renal blood flow (RBF), D, D*, and f in TRAS, and analyzed their correlation with eGFR.
Results: Renal allograft in the stenosis group displayed notably lower RBF and f, both of which were positively associated with eGFR. This research highlights the importance of noninvasive techniques like ASL-MRI and IVIM-MRI in the clinical management of TRAS.
Impact: This study demonstrates that TRAS reduces renal perfusion, thereby affecting transplanted kidney function. ASL-MRI and IVIM-MRI can indirectly and noninvasive reflect renal function impacted by TRAS, providing valuable information for treatment decisions and active monitoring.
Introduction
Transplant renal artery stenosis (TRAS) is the most frequent vascular complication after kidney transplantation1. The treatment options for TRAS range from conservative to invasive endovascular procedures, depending on the severity of stenosis, renal perfusion and function2. Arterial spin labeling-MRI (ASL-MRI) reflects tissue perfusion, while intravoxel incoherent motion-MRI (IVIM-MRI) reflects tissue water molecule diffusion and microcirculation perfusion3, 4. There are limited clinical studies on the use of ASL-MRI and IVIM-MRI for TRAS. The purpose of this study was to explore whether ASL-MRI and IVIM-MRI can evaluate tissue perfusion and diffusion changes of TRAS and their correlation with transplanted kidney function.Material and Methods
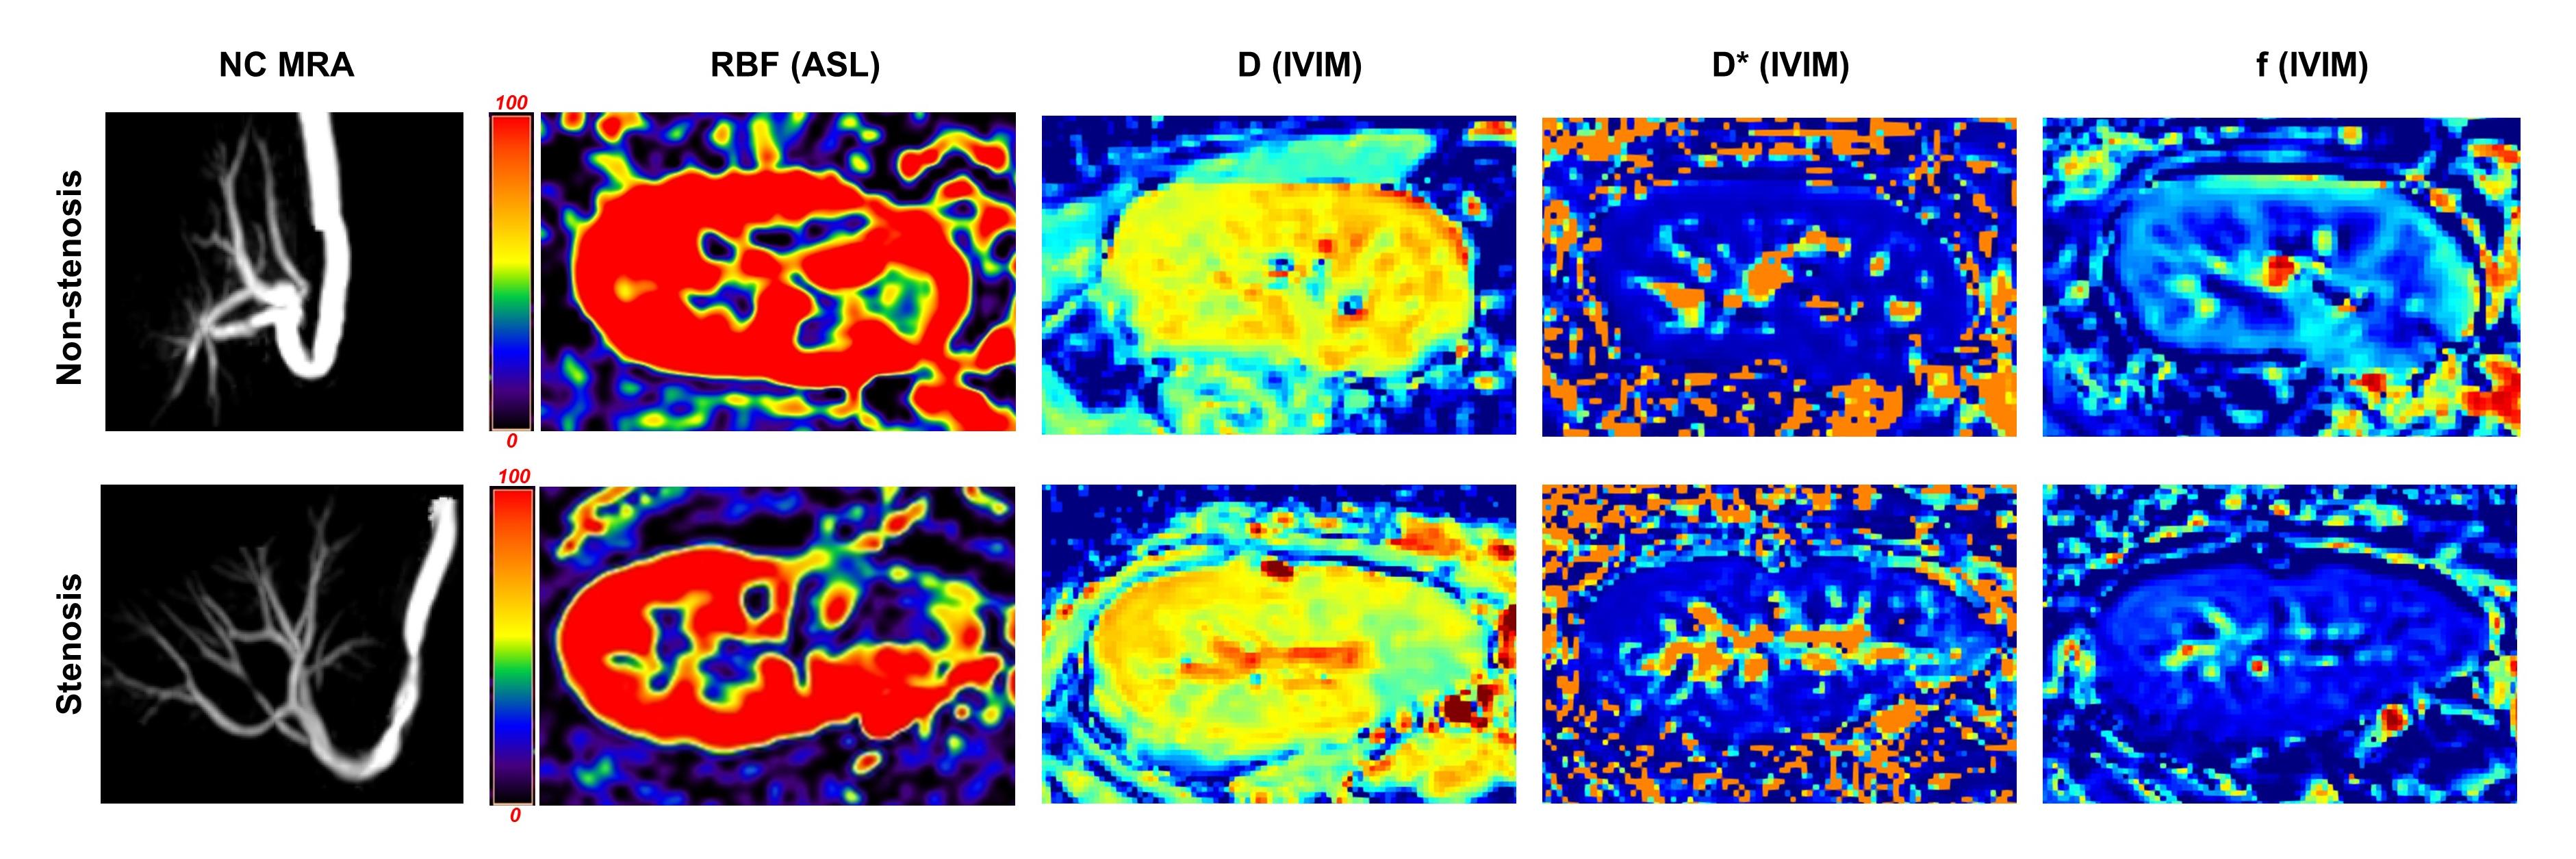
Seventy-nine patients (54 males and 25 females; age range, 22-66 years; median age, 44 years) who underwent allograft renal transplantation between June 2019 and February 2023 were included in this study. All the patients underwent conventional MRI on a 3.0T scanner (Ingenia, Philips Healthcare, Best, the Neterlands), sequences including non-contrast-enhanced magnetic resonance angiography (NC-MRA), ASL-MRI and IVIM-MRI5, 6, 7. The detailed parameters for the ASL-MRI were: three-dimensional pseudo continuous ASL; field of view, 353×275×84 mm3. Acquisition voxel size: 3×3×6 mm3; echo time / repetition time: 12 ms/ 4500 ms; label distance: 90 mm; label duration: 1800 ms; post label delay: 1600 ms. For IVIM-MRI, field of view: 353×275 mm2; voxel size: 3×3 mm2; slice thickness: 4 mm; 20 slices; echo time / repetition time: 77 ms/ 4000 ms; b values were 0, 10, 20, 40, 60, 80, 100, 150, 200, 500, 800 s/mm2. The degree of TRAS (non-stenosis group and stenosis group) was evaluated in NC-MRA images8. Renal blood flow (RBF), which reflects renal allograft perfusion, was evaluated in ASL images. Slow diffusion coefficient (D), fast diffusion coefficient (D*), and perfusion fraction (f), which reflect tissue water molecule diffusion and microcirculatory perfusion, were evaluated in IVIM images (Figure 1). Differences in ASL-MRI and IVIM-MRI parameters between the stenosis and non-stenosis groups were analyzed using the independent samples t-test. The relationship between ASL and IVIM parameters with estimating glomerular filtration rate(eGFR) was analyzed by Pearson correlation coefficient.Results
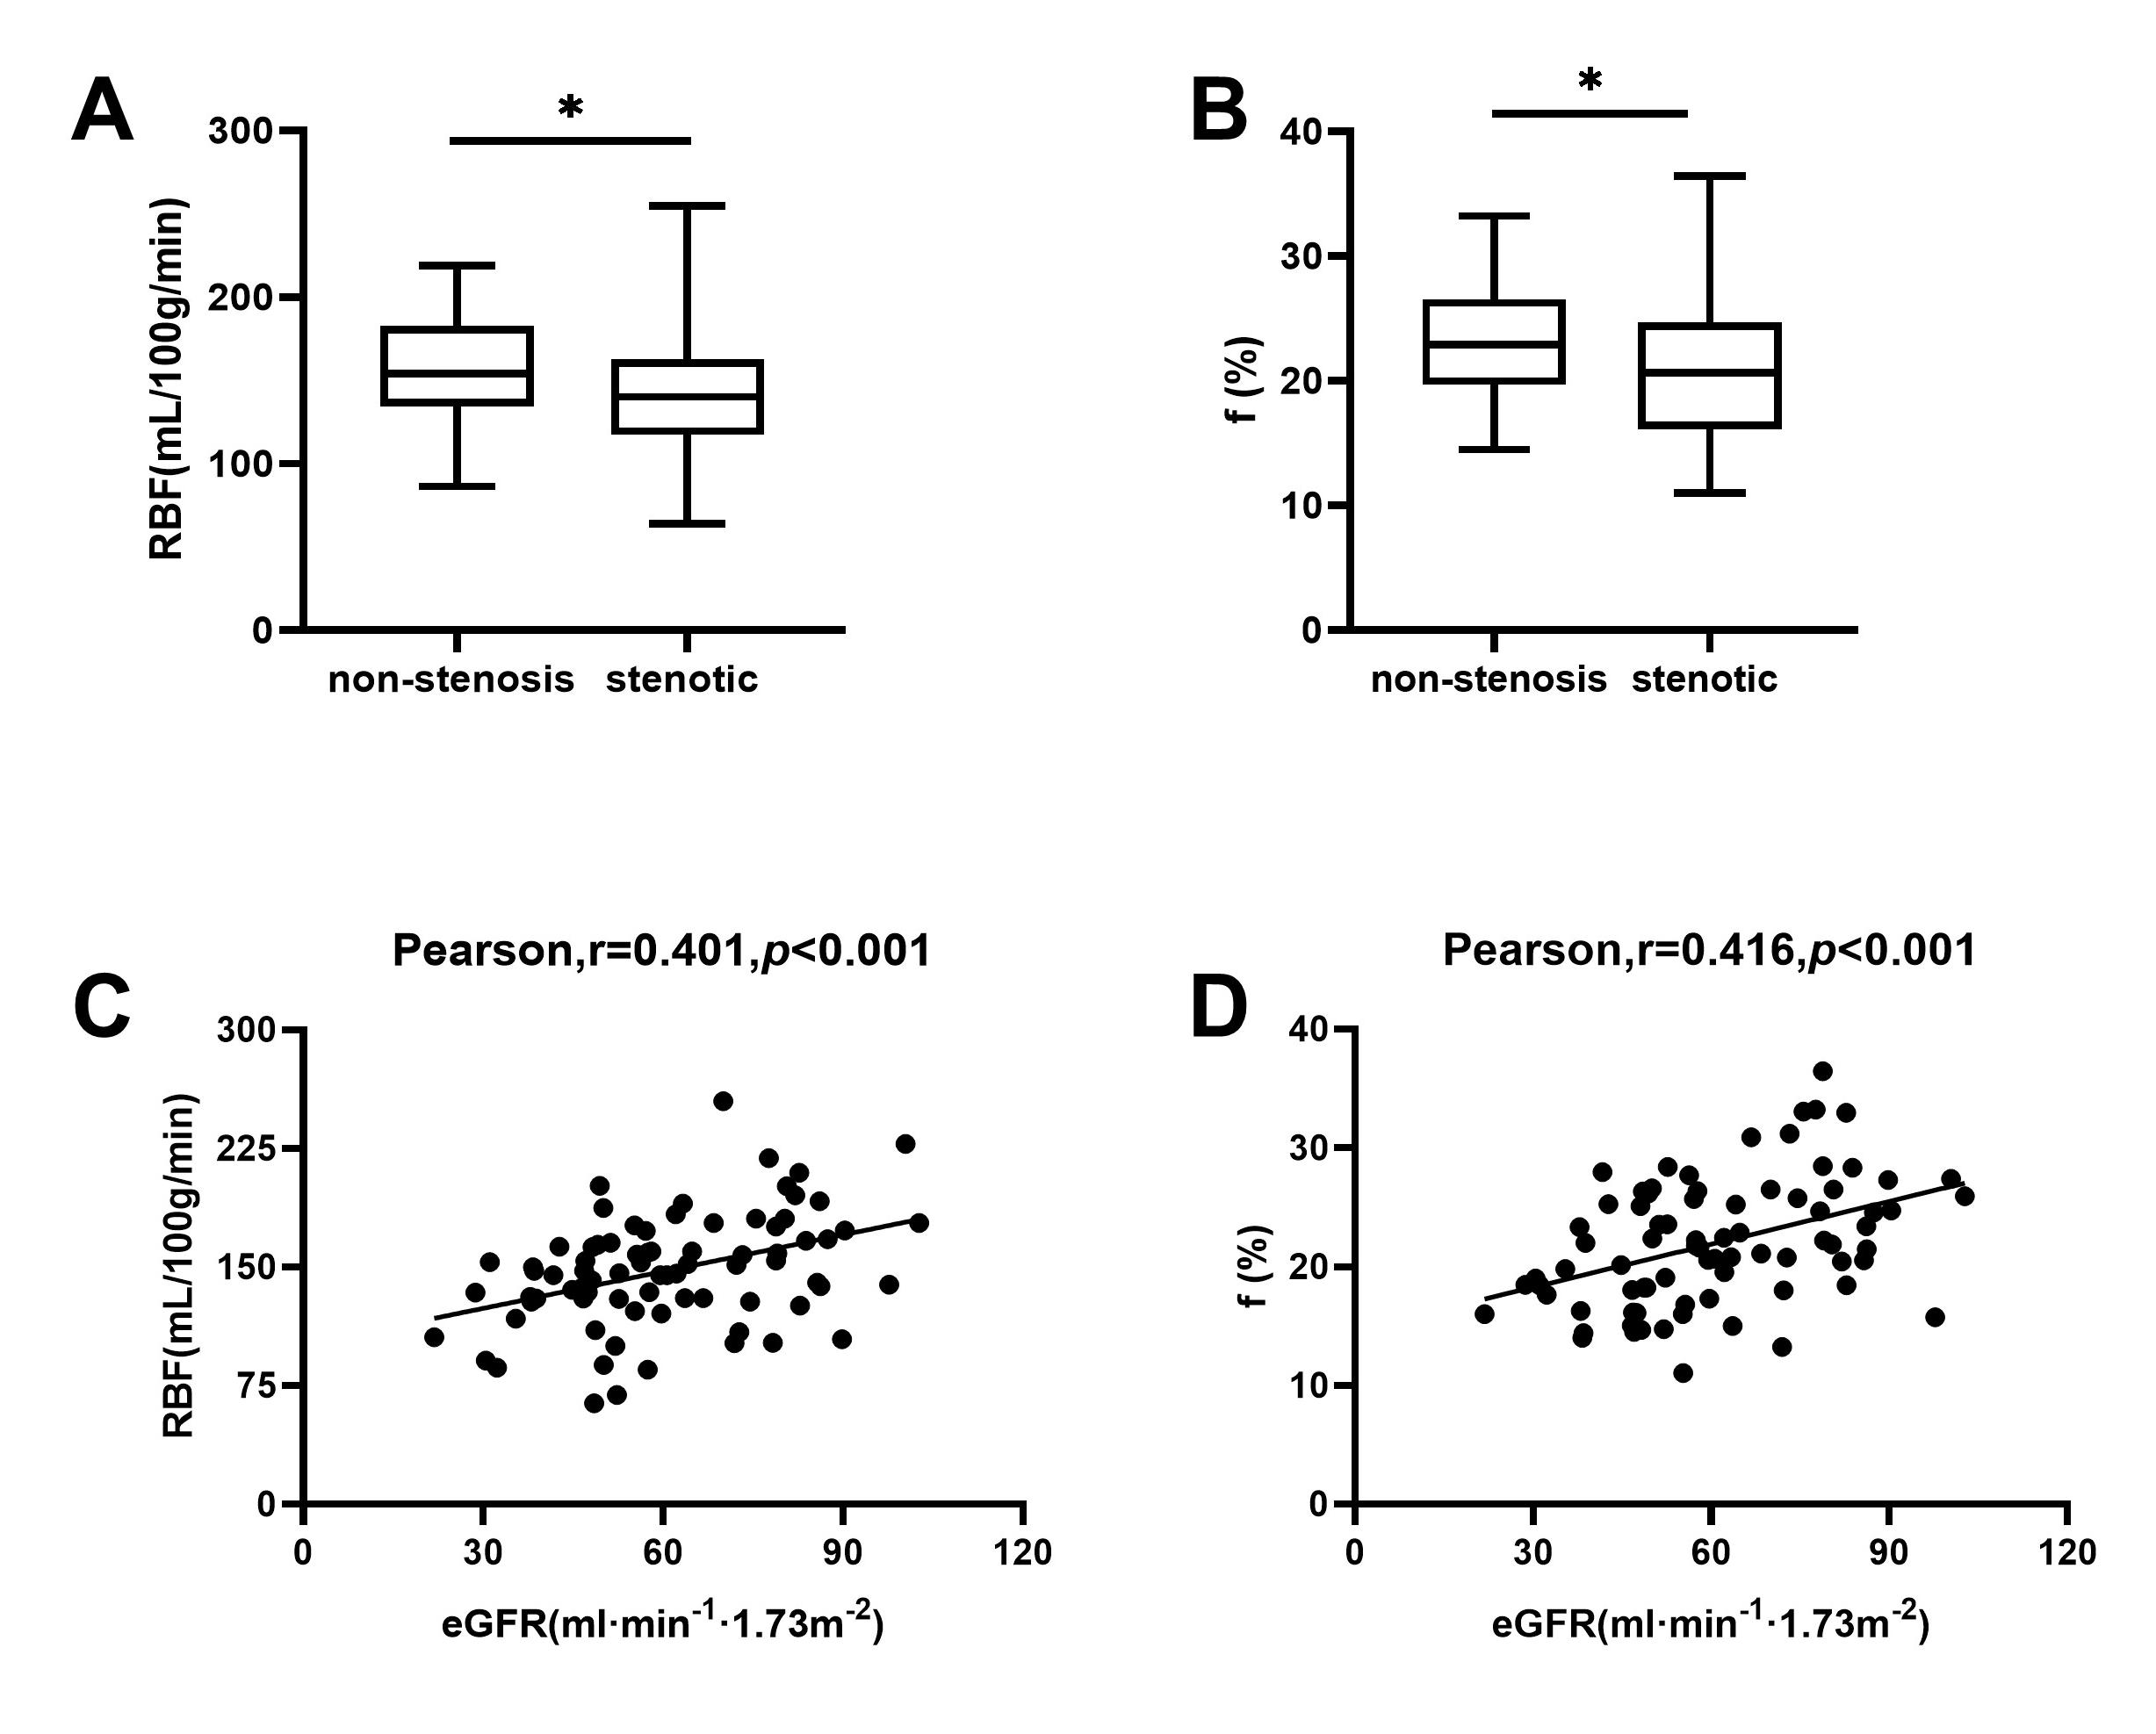
For non-stenosis group, the renal allograft perfusion was (157.18±31.46) mL/100 g/min, the mean D was (1.88±0.11) ×10-3 μm2/ms, the mean D* was (2.89±1.05) ×10-2 μm2/ms, and the mean f was (0.24±0.05)%. For stenosis group, the renal allograft perfusion was (140.10±37.10) mL/100g/min, the mean D was (1.86±2.06) ×10-3 μm2/ms, the mean D* was (3.22±1.37) ×10-2 μm2/ms, and the mean f was (0.21±0.05)%. These results are shown in Figure 2. RBF and f were lower in the stenosis group than in the non-stenosis group, and the difference was statistically significant (P=0.03, P=0.02). The eGFR was positively correlated with both RBF and f (r=0.401, P<0.001; r=0.416, P<0.001).Discussion
Compared to the non-stenosis group, the stenosis group showed a decrease in RBF and f values. This may be due to varying degrees of damage to the glomeruli and tubular structures within the transplanted kidney in the event of TRAS, resulting in varying degrees of reduction in the perfusion of transplanted kidneys.Conclusion
ASL-MRI and IVIM-MRI can be indirectly reflect transplanted kidney function by non-invasively assessing tissue perfusion and diffusion of TRAS.Acknowledgements
No acknowledgement found.References
1. Nicholson ML, Yong C, Trotter PB, et al. Risk factors for transplant renal artery stenosis after live donor transplantation. Br J Surg, 2019; 106(3): 199-205.2. Gunawardena T, Sharma H. Transplant Renal Artery Stenosis: Current Concepts. Exp Clin Transplant, 2022; 20(12): 1049-1057.
3. Zhang JL, Lee VS. Renal perfusion imaging by MRI. J Magn Reson Imaging, 2020, 52(2): 369-379.
4. Le Bihan D. What can we see with IVIM MRI? Neuroimage, 2019, 187: 56-67.
5. Zhang LJ, Peng J, Wen J, et al. Non-contrast-enhanced magnetic resonance angiography:a reliable clinical tool forevaluating transplant renal artery stenosis. EurRadiol, 2018; 28(10): 4195-4204.
6. Li X, Wang W, Cheng D, et al. Perfusion and oxygenation in allografts with transplant renal artery stenosis:Evaluation with functional magnetic resonance imaging. Clin Transplant, 2022, 36(11): e14806.
7. Cheng ZY, Feng YZ, Hu JJ, et al. Intravoxel incoherent motion imaging of the kidney: The application in patients with hyperuricemia. J Magn Reson Imaging, 2020, 51(3): 833-840.
8. Huang Y, Zhang B, Zheng J, et al. Diagnostic Performance of Magnetic Resonance Angiography for Artery Stenosis After Kidney Transplant: A Systematic Review and Meta-Analysis. Acad Radiol, 2023, 30(9): 2021-2030.
Figures