2767
Pulmonary Perfusion via Magnetic Resonance Imaging is Associated with hospitalization for COVID-191Johns Hopkins University, Baltimore, MD, United States, 2Johns Hopkins University, Ba, MD, United States, 3Canon Medical Systems, Baltimore, MD, United States, 4Canon Medical Systems, Tokyo, Japan
Synopsis
Keywords: Lung, COVID-19, Lung
Motivation: COVID-19's persistent respiratory effects are well-documented, but the long-term pulmonary consequences, particularly after severe illness, remain inadequately understood.
Goal(s): To identify enduring perfusion deficits in the lungs of individuals previously hospitalized with COVID-19, using dynamic contrast-enhanced (DCE) MRI.
Approach: The study recruited adults post-COVID-19 for a comprehensive pulmonary assessment. Dynamic contrast enhanced MRI was used to quantify lung perfusion and relating them to COVID-related hospitalization.
Results: The study found a significant correlation between MRI perfusion parameters and previous hospitalization for COVID-19. It indicated that patients with a history of hospitalization due to COVID-19 might experience persistent alterations in lung perfusion.
Impact: Our research, through dynamic contrast-enhanced MRI, reveals persisting lung perfusion deficits in post-hospitalized COVID-19 patients, notably related to severity of initial disease. This aids in understanding post-COVID pulmonary sequelae, guiding future patient management and research on long-term COVID-19 impact.
Introduction
Coronavirus Infectious Disease 2019 (COVID-19), caused by Severe Acute Respiratory Syndrome Coronavirus 2 (SARS-CoV-2), affects the respiratory system and frequently results in severe respiratory distress and disturbances in pulmonary blood flow 1. Patients with this disease often develop coagulation disorders, forecasting worse prognoses. 2 3 4.The long-standing pulmonary consequences of COVID-19, especially in individuals who don't completely recover, are not fully understood, despite significant research. Traditional lung perfusion assessment methods like Single-Photon Emission Computerized Tomography (SPECT) 5 and Positron Emission Tomography (PET) 6 7 provide accuracy but come with disadvantages such as radiation exposure and limited resolution. This has prompted the shift to MRI, a safer, innovative technique for assessing lung perfusion 8-11.
Inspired by prior studies demonstrating MRI's precision in measuring pulmonary perfusion 12, our study uses dynamic contrast-enhanced (DCE) MRI to investigate COVID-19's enduring effects on lung health, especially relevant to those with pulmonary diseases like COPD, which increases the risk of severe COVID-19 complications. We hypothesized that hospitalized COVID-19 patients might experience persistent perfusion deficits in the lungs.
Methods
In our research, we targeted individuals with known COVID-19 infection based on tests at Johns Hopkins hospital, recruiting adults 3-6 months post-infection. We conducted an in-depth pulmonary evaluation, including lung perfusion by MRI and an anatomical CT.Using a Canon Galan 3T scanner, we captured perfusion images post-Gadavist contrast administration. Quantitative (blood flow (BF) (ml blood per min and 100 ml lung), blood volume (BV) (ml blood per min and 100 ml lung), mean transit time (MTT) (s)) and semi-quantitative (time to max upslope (TMU )(s), time to 50% max intensity (T50M)(s), relative upslope (RU) (s)) analyses were performed on these images.
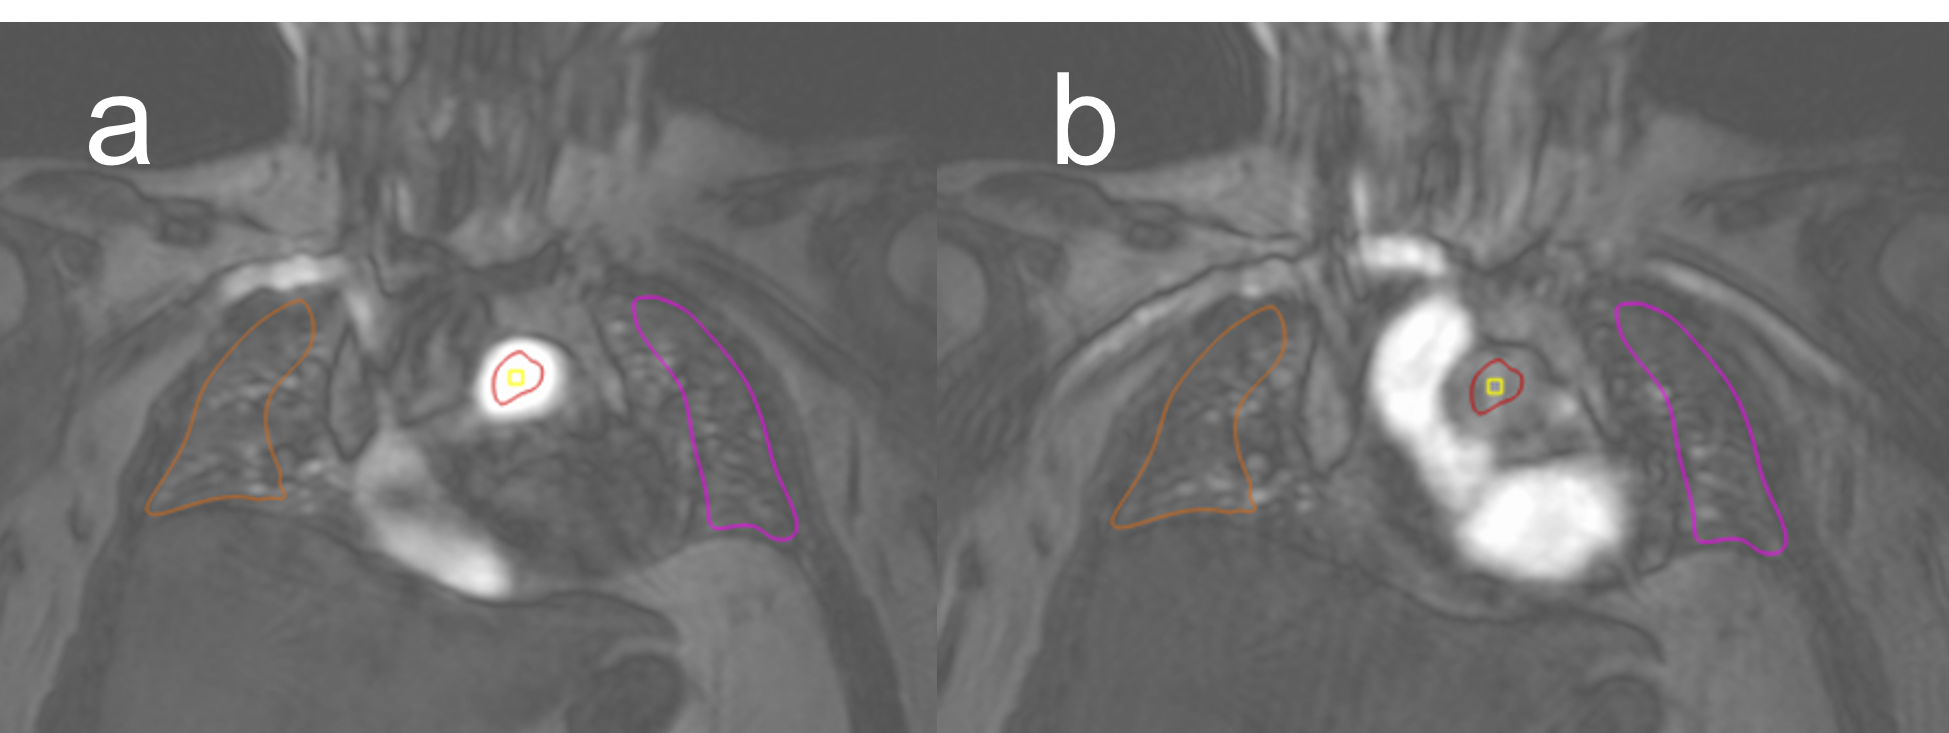
For semi-quantitative analysis, we utilized QMass 8.1 software to evaluate pulmonary perfusion, carefully placing regions of interest (ROIs) to measure arterial input and parenchymal perfusion while excluding larger vessels. Enhancement curves were derived from which parameters were derived as previously described (Figure 1).
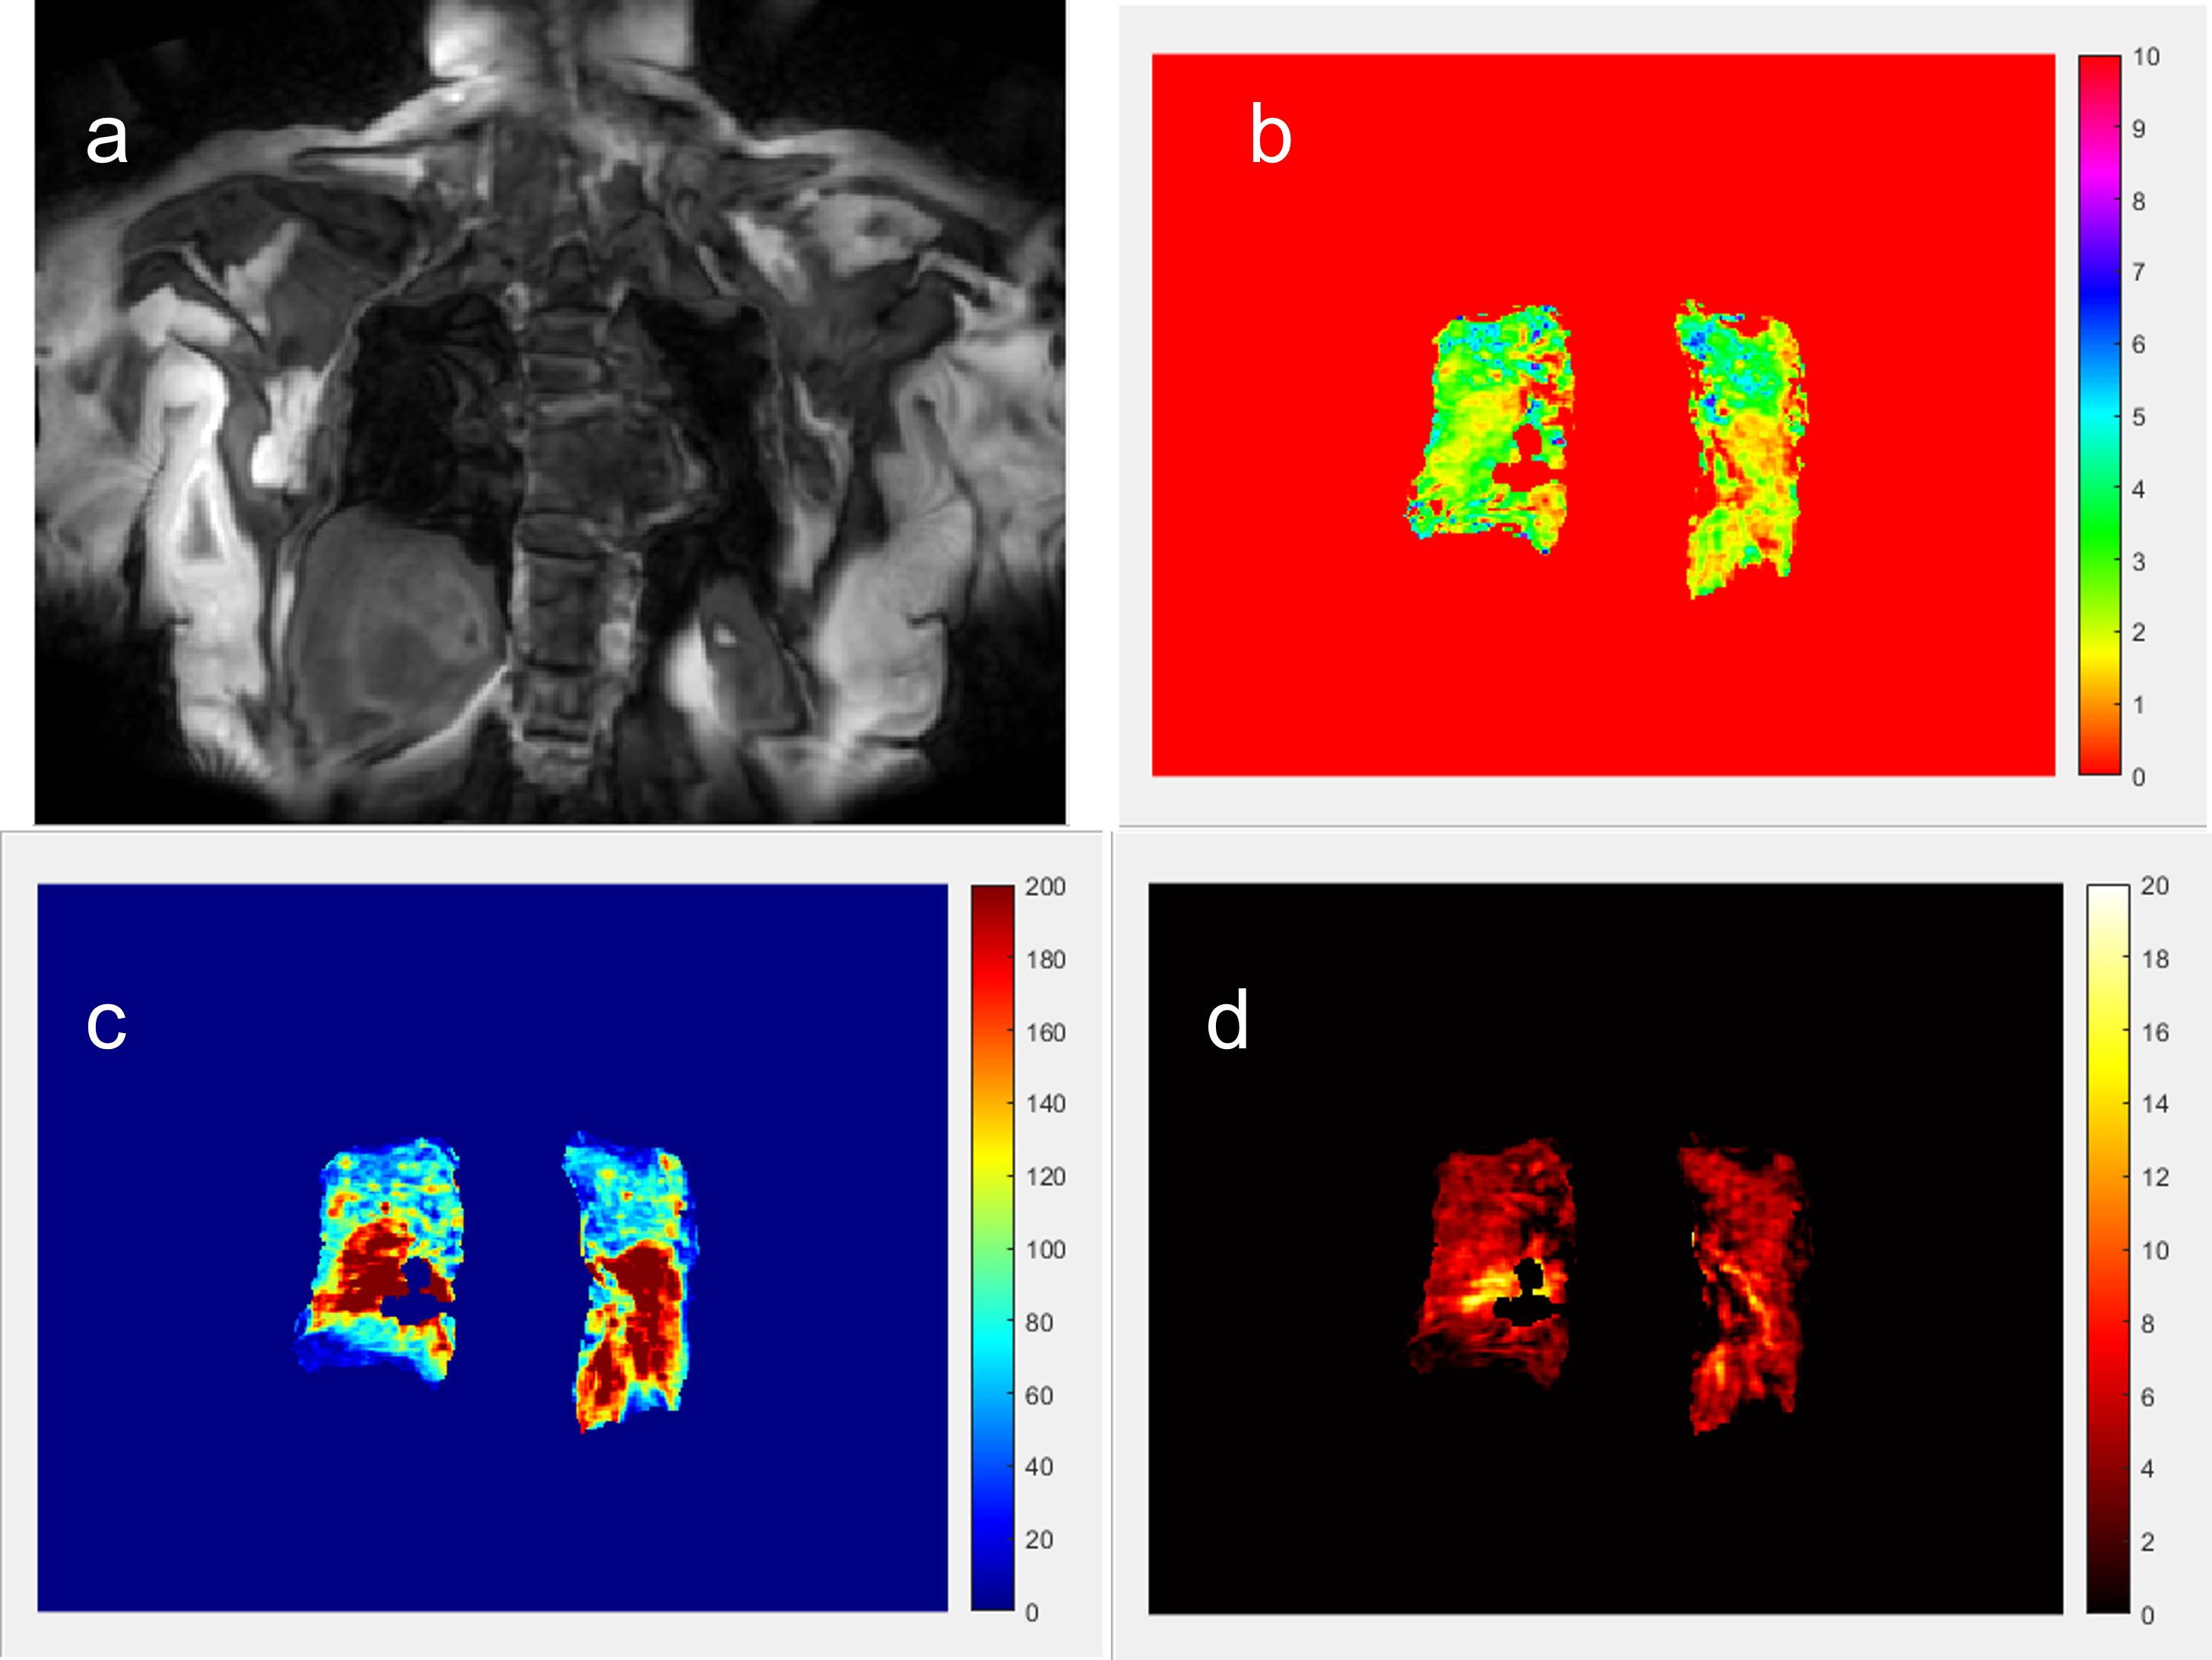
We used an in-house MATLAB based tool that performed the following steps for the quantitative perfusion analysis: (1) registration of the 3D images over the time frames to ensure that all the images were corrected for motion; (2) a deep learning-based tool was used for the segmentation of the lungs using 3D Unets. This algorithm was trained/validated on a subset of 30 participants and then applied to the remaining cases. After the automated segmentation manual correction was performed if needed; (3) The user then drew an ROI for the arterial input function encompassing a coronal slice showing the main pulmonary artery; (4) Then a Fermi deconvolution algorithm was used to obtain the quantitative metrics of BF, BV and MTT on a pixel-by-pixel basis (Figure 2).
We investigated the relationships of perfusion metrics with hospitalization and post-COVID symptoms, after adjustments for age, sex, BMI, and vaccination status.
Results
93 participants met inclusion criteria and underwent CMR imaging and pulmonary perfusion analysis. They were aged 54±12 years old, 50% female, and 18% with a history of pulmonary disease (COPD: 2%, asthma: 9.6%, sleep apnea: 6.4%). 23 participants were hospitalized and 41 had symptoms of Long-COVID. The average BMI was 28.47 ± 5.45 kg/m2. Pulmonary Artery Blood Pool: Time to max upslope [mean: 4.00 ± 2.2s]; time to 50% max intensity [mean 4.5 ± 1.6s]; and relative upslope [mean 4.01 ± 1.6%].Quantitative and semiquantitative MRI parameters were closely correlated (MTT vs RU: r = 1.1, p=0.04; BF vs RU: r=1.6, p=0.04). Among quantitative parameters, MTT was associated with hospitalization (β = 0.47, p = <0.001) after adjustment for age, gender and BMI. Among semi-quantitative variables associations were found between hospitalization status and T50M (s) (β = 1.855, p = <0.001) and TMU (s), (β = 1.62, p = <0.001), after adjustments for demographic variables and clinical characteristics. Long-COVID symptoms were not linked to any lung perfusion parameters. Presence of ground glass opacities on CT at the time of MRI were associated with T50M intensity (s) (β = 1.2, p =0.02) and relative upslope (β = 1.2, p =0.02).
Discussion
This study shows a correlation between both slower transpulmonary contrast transit and lower peak parenchymal enhancement with severe illness leading to hospitalization. It is unclear whether the associations found here are because of underlying comorbidities and subclinical diseases. Further studies are needed to better understand the reason for the prevalent lower lung perfusion in those with COVID hospitalization.Conclusion
Lung perfusion by MRI can potentially aid in advancing our understanding of post-COVID sequelae and identifying patients with subclinical pulmonary damage.Acknowledgements
No acknowledgement found.References
1. World Health Organization. WHO Coronavirus (COVID-19) Dashboard: WHO; 2023 [Available from: https://covid19.who.int/ accessed 7 November 2023.
2. Colling ME, Kanthi Y. COVID-19-associated coagulopathy: An exploration of mechanisms. Vasc Med 2020;25(5):471-78. doi: 10.1177/1358863x20932640 [published Online First: 20200619]
3. Loo J, Spittle DA, Newnham M. COVID-19, immunothrombosis and venous thromboembolism: biological mechanisms. Thorax 2021;76(4):412-20. doi: 10.1136/thoraxjnl-2020-216243 [published Online First: 20210106]
4. Herrmann J, Mori V, Bates JHT, et al. Modeling lung perfusion abnormalities to explain early COVID-19 hypoxemia. Nat Commun 2020;11(1):4883. doi: 10.1038/s41467-020-18672-6 [published Online First: 20200928]
5. Jögi J, Ekberg M, Jonson B, et al. Ventilation/perfusion SPECT in chronic obstructive pulmonary disease: an evaluation by reference to symptoms, spirometric lung function and emphysema, as assessed with HRCT. Eur J Nucl Med Mol Imaging 2011;38(7):1344-52. doi: 10.1007/s00259-011-1757-5 [published Online First: 20110302]
6. Mintun MA, Ter-Pogossian MM, Green MA, et al. Quantitative measurement of regional pulmonary blood flow with positron emission tomography. J Appl Physiol (1985) 1986;60(1):317-26. doi: 10.1152/jappl.1986.60.1.317
7. Musch G, Layfield JD, Harris RS, et al. Topographical distribution of pulmonary perfusion and ventilation, assessed by PET in supine and prone humans. J Appl Physiol (1985) 2002;93(5):1841-51. doi: 10.1152/japplphysiol.00223.2002
8. Ter-Karapetyan A, Triphan SMF, Jobst BJ, et al. Towards quantitative perfusion MRI of the lung in COPD: The problem of short-term repeatability. PLoS One 2018;13(12):e0208587. doi: 10.1371/journal.pone.0208587 [published Online First: 20181210]
9. Schiebler ML, Parraga G, Gefter WB, et al. Synopsis from Expanding Applications of Pulmonary MRI in the Clinical Evaluation of Lung Disorders: Fleischner Society Position Paper. Chest 2021;159(2):492-95. doi: 10.1016/j.chest.2020.09.075 [published Online First: 20200914]
10. Schiwek M, Triphan SMF, Biederer J, et al. Quantification of pulmonary perfusion abnormalities using DCE-MRI in COPD: comparison with quantitative CT and pulmonary function. Eur Radiol 2022;32(3):1879-90. doi: 10.1007/s00330-021-08229-6 [published Online First: 20210922]
11. Ingrisch M, Maxien D, Schwab F, et al. Assessment of pulmonary perfusion with breath-hold and free-breathing dynamic contrast-enhanced magnetic resonance imaging: quantification and reproducibility. Invest Radiol 2014;49(6):382-9. doi: 10.1097/rli.0000000000000020
12. Hueper K, Parikh MA, Prince MR, et al. Quantitative and semiquantitative measures of regional pulmonary microvascular perfusion by magnetic resonance imaging and their relationships to global lung perfusion and lung diffusing capacity: the multiethnic study of atherosclerosis chronic obstructive pulmonary disease study. Invest Radiol 2013;48(4):223-30. doi: 10.1097/RLI.0b013e318281057d
Figures