2764
A Preliminary Study of 3D Dynamic Enhanced MRI for Evaluation of the Vascular Architecture of Solid Solitary Pulmonary Nodules in the Lung1Radiology department, The First Affiliated Hospital of Guangxi Medical University, nanning, China, 2MR Research Collaboration, Siemens Healthineers Ltd., wuhan, China
Synopsis
Keywords: Lung, Lung, DCE-MRI
Motivation: DCE-MRI were used to valuate the vascular construction of solid solitary nodules (SPN) to help the qualitative clinical diagnosis.
Goal(s): To evaluate the value of DCE-MRI in the vascular architecture of solid SPN.
Approach: 32 patients with SPN underwent chest DCE-MRI. Pathological specimens and vascular structural parameter MVD and MPI were evaluated by immunohistochemical markers CD31, VEGF, and SMA.
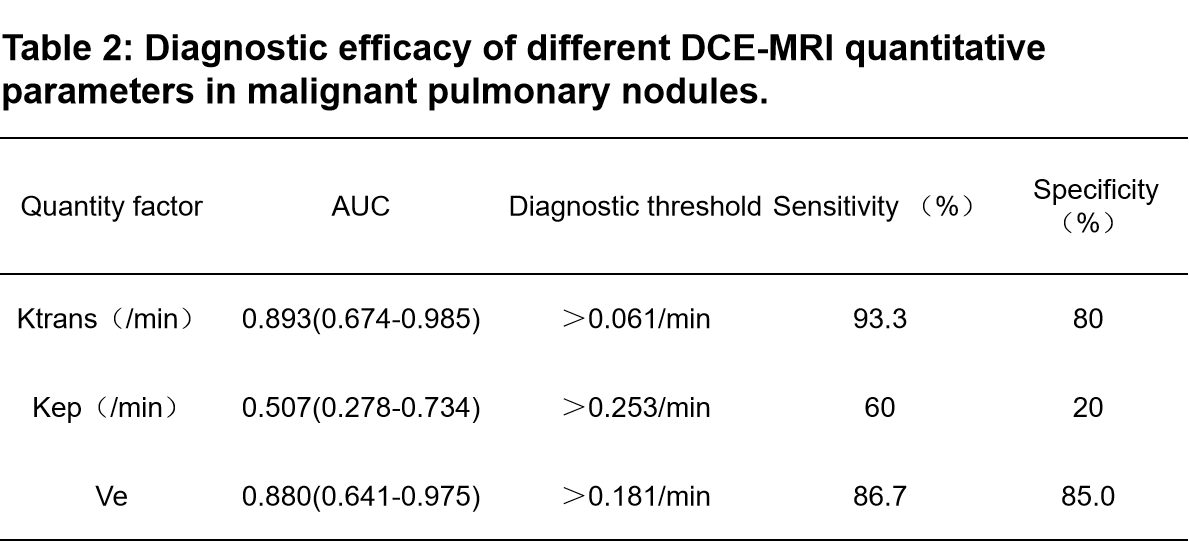
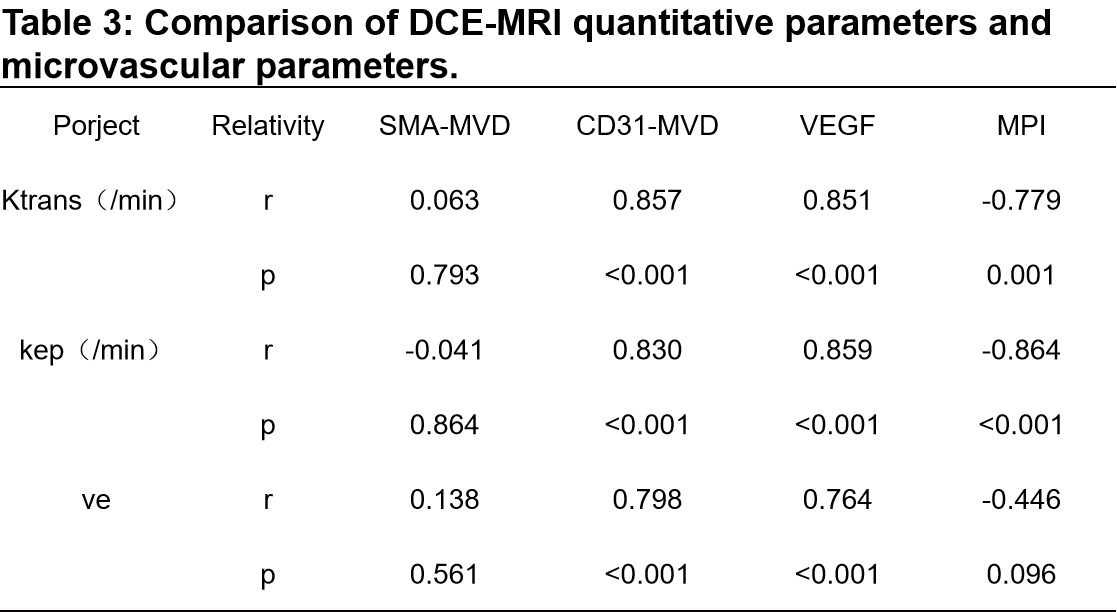
Results: Ktrans and Ve from DCE-MRI had significant differences between benign and malignant SPN, and high diagnostic efficacy with AUC of 0.893 and 0.880. Ktrans and Kep were significantly positively correlated with CD31-MVD and VEGF, while negatively correlated with MPI.
Impact: Dynamic enhancement Magnetic resonance imaging can be used as an effective auxiliary means to distinguish benign and malignant pulmonary nodules.
Introduction
This study aimed to explore the value of DCE-MRI quantitative parameters between benign and malignant solitary pulmonary nodules (SPN), as well as the relationship between DCE-MRI parameters and the pathological indices of vascular architecture, to provide effective imaging indicators for the diagnosis, treatment and prognostic evaluation of clinically isolated pulmonary nodules.Methods
Inclusion criteria: ①solid nodular lesions in the lung (≥1cm, ≤3cm) confirmed by chest CT examination;②The density of lesions is uniform, without calcification or cavity in general, without surrounding satellite lesions, and without atelectasis and surrounding lymph node enlargement. Finally, 32 patients (age: 51.03 ±10.38 years; rang,18-66 years, and 11 males) were included, with 24 malignant nodules and 8 benign nodules.Conventional chest MRI scan and DCE-MRI scan were performed with a 3T MRI (MAGNETOM Prisma, Siemens Healthineers, Germany). The parameters of DCE-MR were as follows: 3D-T1-VIBE sequence, TR=4.1 ms, TE=1.41 ms, BW=260 Hz/pixel, slice thickness=3.6 mm, gap=1.2 mm, FOV=380×380 mm, Matrix=138×192. Gadolinium injection of meglumine with dose of 0.2 mmol/kg and rate of 0.2 ml/s. After 30 seconds of injection, the tuberous region was scanned continuously for 30 periods, with a total scanning time of 04:58.
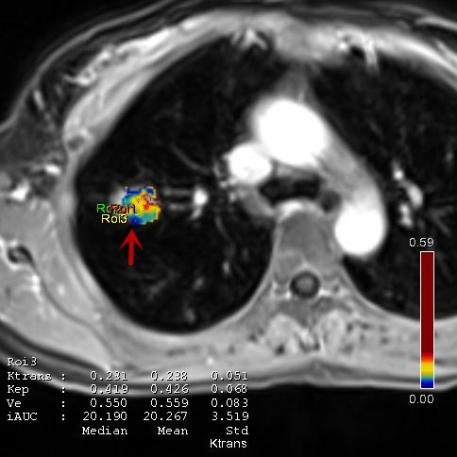
Two diagnostic radiologists measured DCE-MRI quantitative parameters (Ktran, Kep, and Ve) calculated Tofts two-compartment haemodynamic model, and their average values were taken to determine the final data. With reference to conventional T1WI and T2WI images, the 3 ROIs (0.3–0.5 cm2 each ROI) were manually delineated in the solid part of the maximum level of the lesion cross-section in DCE images (Figure 1), and calcification, necrosis, cystic degeneration and bleeding were avoided as much as possible.
The MVD count was adopted the method reported in the literature by Weidner N and Wang HC[1-2], and was co-labeled with CD31 and SMA antibodies, namely CD31-MVD and SMA-MVD. MPI was the ratio of SMA-MVD to CD31-MVD. The expression of VEGF-positive cells was ranked 0~6 points according to the staining area percentage and intensity[3].
SPSS 24.0 and MedCalc 15.2.8 were used for statistical analysis. DCE-MRI quantitative permeability parameters between benign and malignant nodules were compared using independent sample T tests, their correlations with angioarchitecture parameters was evaluated by Pearson correlation analysis. ROC curves were to evaluate the diagnostic efficiency of DCE-MRI quantitative parameters. P<0.05 was considered statistically significant.
Results
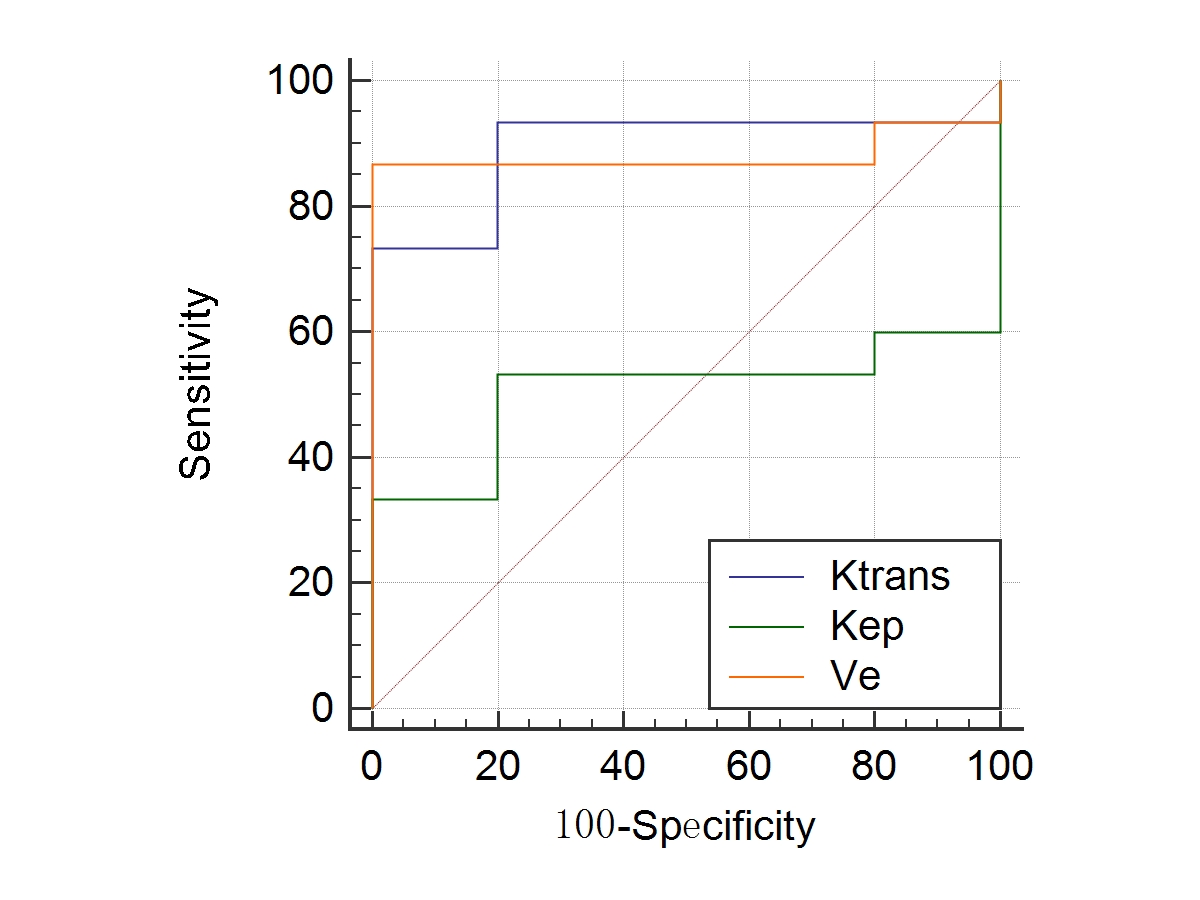
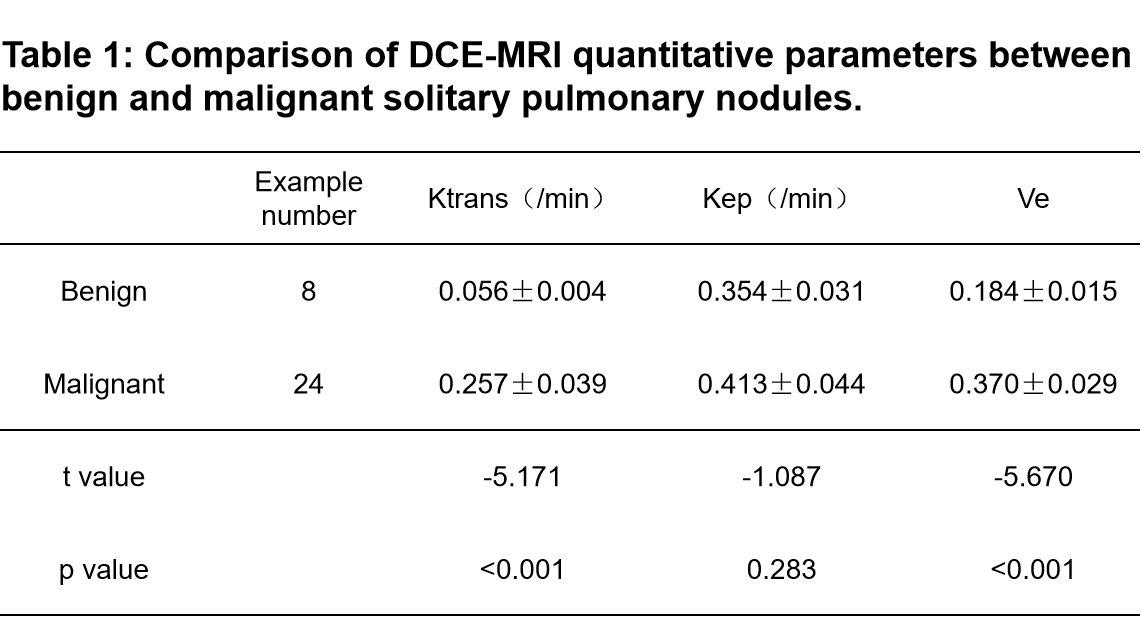
The Ktrans and Ve in the malignant group were significantly higher than those in the benign group (p<0.05), but Kep had no significant difference (P =0.283) (Table 1). The areas under the ROC curve (AUC) for Ktrans, Kep and Ve were 0.893, 0.507 and 0.880 in differentiating malignant from benign group, respectively (Table 2 and Figure 2). Ktrans, Kep and Ve were all significantly positively correlated with pathological microvascular parameters CD31-MVD and VEGF, but only Ktrans and Kep negatively correlated with MPI. The detailed results are shown in Table 3.Discussion
DCE-MRI is mainly based on angiogenesis and changes in the tumour neovascularization permeability of tumour and nodular lesions. Due to the differences in microvessels between benign and malignant tumours and inflammatory nodules, the value of blood perfusion parameters in MR dynamic scanning exhibits certain differences. Our Ktrans and Ve results suggest that malignant lung nodules exhibit increased microvascular density, increased blood flow, and rapid tumour growth, which is consistent with the research results of Zhen-Shen Ma et al[4].A large number of studies have shown that the expression of MVD and VEGF in malignant tumours is significantly increased[5-6]. The expression level of MPI in microvascular pericytes is closely related to the maturity of blood vessels within the tumour, and the larger the value is, the larger the proportion of mature blood vessels[7-10]. Our results showed that Ktrans, Kep and Ve in pulmonary nodules were all closely related to the expression of MVD and VEGF, which was consistent with the research results for breast cancer[11], proving that Ktrans, Kep and Ve can indirectly quantify the amount of pulmonary tumour angiogenesis. The Ktrans and Kep values were closely negatively correlated with the expression of MPI, suggesting that Ktrans increased as the mature vessels of lesions decreased. There was no correlation between the Ve value and MPI. According to the results of Tofts[12], instability may be caused by the influence of oedema around the lesion, and the specific reasons need to be further studied.
Conclusion
DCE-MRI can indirectly quantify and reflect the amount of microvessel generation, microvessel maturity, and blood perfusion characteristics of isolated SPN, which has certain value and potential in evaluating the vascular architecture of pulmonary nodules.Acknowledgements
We thank Siemens engineer Chenghui Li for debugging the scan sequence, and Tang Cheng, Lei Yiwu, technologists in our department, and Liting Yang, pathologist, for their work performing measurements for this study.References
[1] Weidner N. Current pathologic methods for measuring intratumoral microvessel density within breast carcinoma and other solid tumors. Breast Cancer Res Treat. 1995;36(2):169-180.
[2] Wang HC, Wang BD, Chen MS, et al. An Underlying Pathological Mechanism of Meningiomas with Intratumoral Hemorrhage: Undifferentiated Microvessels. World Neurosurg. 2016;94:319-327.
[3] Wu X, Mao X, Huang Y, Zhu Q, Guan J, Wu L. Detection of proteins associated with the pyroptosis signaling pathway in breast cancer tissues and their significance. Int J Clin Exp Pathol. 2020;13(6):1408-1414.
[4] Ma ZS, Wang DW, Sun XB, et al. Quantitative analysis of 3-Tesla magnetic resonance imaging in the differential diagnosis of breast lesions. Exp Ther Med. 2015;9(3):913-918.
[5] Chen J, Chen C, Xia C, et al. Quantitative free-breathing dynamic contrast-enhanced MRI in hepatocellular carcinoma using gadoxetic acid: correlations with Ki67 proliferation status, histological grades, and microvascular density. Abdom Radiol (NY). 2018;43(6):1393-1403.
[6] Ntellas P, Dadouli K, Perivoliotis K, et al. Microvessel Density and Impact of Angiogenesis on Survival of Resected Pancreatic Cancer Patients: A Systematic Review and Meta-analysis. Pancreas. 2019;48(2):233-241.
[7] Lindahl P, Hellström M, Kalén M, Betsholtz C. Endothelial-perivascular cell signaling in vascular development: lessons from knockout mice. Curr Opin Lipidol. 1998;9(5):407-411.
[8] Selective ablation of immature blood vessels in established human tumors follows vascular endothelial growth factor withdrawal. J Clin Invest.1999;103(2):159-165.
[9] Barron L, Gharib SA, Duffield JS. Lung Pericytes and Resident Fibroblasts: Busy Multitaskers. Am J Pathol. 2016;186(10):2519-2531.
[10] Lindahl P, Johansson BR, Levéen P, Betsholtz C. Pericyte loss and microaneurysm formation in PDGF-B-deficient mice. Science. 1997;277(5323):242-245.
[11] Li L, Wang K, Sun X, et al. Parameters of dynamic contrast-enhanced MRI as imaging markers for angiogenesis and proliferation in human breast cancer. Med Sci Monit. 2015;21:376-382.
[12] Tofts PS. Modeling tracer kinetics in dynamic Gd-DTPA MR imaging. J Magn Reson Imaging. 1997;7(1):91-101.
Figures