2763
Flip Angle Optimisation for Quantitative Assessment of Pulmonary Ventilation and Perfusion at 3T1Sir Peter Mansfield Imaging Centre, University of Nottingham, Nottingham, United Kingdom, 2NIHR Nottingham Biomedical Research Centre (BRC), Respiratory Medicine, School of Medicine, University of Nottingham, Nottingham, United Kingdom
Synopsis
Keywords: Lung, Quantitative Imaging
Motivation: The optimum flip angle which provides a trade-off between ventilation and perfusion signal in free-breathing proton MRI (3 T) of the lung is unknown.
Goal(s): To optimise the acquisition of free-breathing pulmonary proton MRI to maximise both ventilation and perfusion signals.
Approach: Assessment of the flip angle in a 2D fast field echo (FFE) sequence in healthy volunteers utilising voxel-wise lung ventilation (VOLVE) analysis.
Results: Increasing the flip angle tends to reduce the ventilation signal but increase the perfusion signal. A flip angle higher than the Ernst angle for lung parenchyma is recommended when assessing both perfusion and ventilation.
Impact: Demonstration of the dependence of 2D FFE proton MRI ventilation and perfusion signal on flip angle to inform future studies. A flip angle greater than the parenchyma Ernst angle maintains a strong ventilation signal without supressing the perfusion signal.
Introduction
Proton (1H) functional pulmonary MRI provides lung ventilation and perfusion information from a single scan. Ventilation metrics are calculated from the local proton density variations in the lung parenchyma during respiration, while the time-of-flight effect provides signal from which to estimate perfusion. Generally, a 2D fast field echo (FFE) sequence is used with low flip angles of 3-5° close to the Ernst angle given the relatively long T1 of lung parenchyma (~1000ms at 3T)[1]. However, a low flip angle reduces the contrast between the lung tissue and the pulmonary vasculature. This is potentially problematic for eliminating perfusion signals from parenchyma ventilation analysis, as well as for the assessment of perfusion signals.Here, we assess in healthy individuals the effect of flip angle on ventilation and perfusion quantification from free-breathing proton MRI at 3T. VOxel-wise Lung VEntilation (VOLVE) analysis[2] (similar to FD/PREFUL but compares lung signal timeseries to navigator signal), was performed to quantify ventilation and perfusion correlation values.
Methods
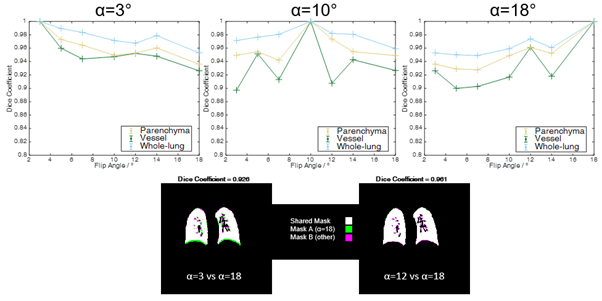
5 healthy volunteers were recruited to undergo 1H lung MRI on a 3T Philips Ingenia scanner. Images were acquired during free-breathing using a 2D fast field echo (FFE) sequence (TR/TE=1.9/0.57ms, 4.37 images/second) at a range of flip angles (α: 3°, 5°, 7°,10°, 12°, 14° and 18°). A single coronal slice placed approximately 1 cm posterior to the heart was imaged, with 512 images collected in 117s. Three repeats were collected for each flip angle.VOLVE analysis was performed in MATLAB (R2022b) for each flip angle dataset. All images were registered to a mid-ventilation image using a demons-based registration. The thoracic cavity was segmented for each image series via seeded region growing to generate a whole lung mask. The whole-lung masks for each flip angle were split into parenchyma and vessel masks via adaptive thresholding with manual corrections if needed, and common masks across all flip angles generated. To determine how well the masks could be created at each flip angle, the Sørensen–Dice coefficient was computed to assess the spatial overlap between whole lung, parenchyma and vessel masks generated at each flip angle.
The mean signal, SAvg, was computed voxelwise and averaged across the segmented masks for each flip angle. The VOLVE ventilation correlation coefficient (CCV) and perfusion correlation coefficient (CCQ) were computed by comparing the registered parenchyma timeseries values to a lung-diaphragm navigator signal, and an aorta or major pulmonary vessel-based cardiac signal timecourse, respectively[2]. Median CCV and CCQ values were computed within each mask for each flip angle.
For each subject, the median and interquartile range (IQR) of SAvg and CCV CCQ across the 3 repeats were computed and a linear model fit across all subjects.
Results
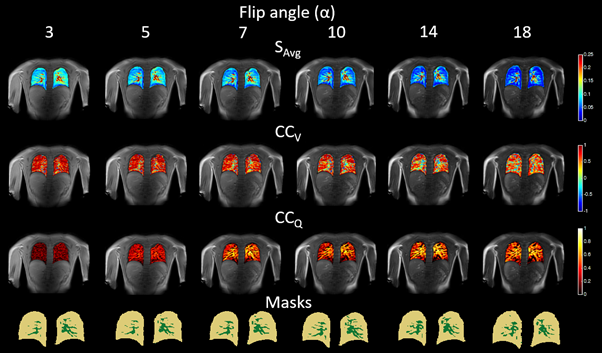
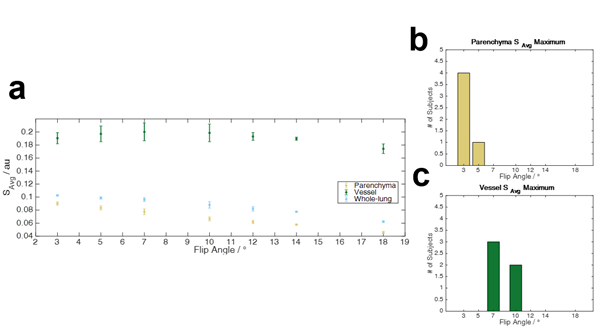
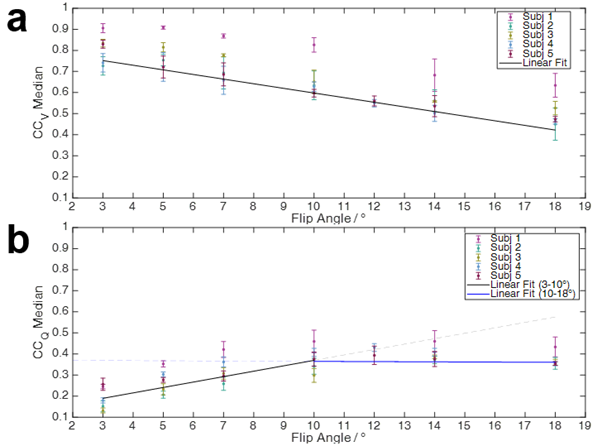
Figure 1 shows a trend for SAvg and CCV to decrease, and CCQ to increase in the parenchyma with increasing flip angle. Figure 2 shows the Dice coefficients between each of the masks generated at each flip angle. Spatial overlap was generally >0.9, with the vessel masks showing slightly lower overlap than parenchyma masks. Figure 3 shows the mean MR signal, SAvg, for each mask. Signal within the parenchyma decreased with increasing flip angle (Spearman r=-0.99, p=0.003), whilst the vessel mask was relatively constant for α≤10°.Figure 4 shows the CCV and CCQ within the parenchyma mask for all volunteers. For CCV, the maximum correlation is seen at 3° and this decreases with increasing flip angle. CCQ increases with increasing flip angle until reaching a plateau at ~10°-14°.Discussion
This work explored the impact of flip angle on ventilation and perfusion signals obtained from free-breathing proton lung MRI. While low flip angles close to the Ernst angle for the parenchyma elicit a strong CCV, this results in a lower CCQ (Figures 1 & 4). To trade-off the estimation of both parenchyma ventilation and perfusion signals a flip angle higher than the Ernst of α=7-12° may be appropriate.The reduced contrast between lung parenchyma and pulmonary vasculature at lower flip angles did not impede the segmentation of the vessel/parenchyma ROIs (Figure 2) using adaptive thresholding (this could alternatively be achieved using the voxel-wise cardiac power spectrum). SAvg in the vessel mask was generally more variable than the parenchyma masks for all values of α (Figure 3), since as expected the vessels had a larger dynamic signal range. SAvg in parenchyma was consistent between repeats for all volunteers.
Conclusion
The need for a trade-off between obtaining a strong ventilation signal whilst not suppressing the parenchyma perfusion signal is demonstrated. Verification in lung disease is required, such as in diseases where parenchyma T1 may be increased [3].Acknowledgements
No acknowledgement found.References
1. Gai et al. Three-dimensional T1 and T2* mapping of human lung parenchyma using interleaved saturation recovery with dual echo ultrashort echo time imaging (ITSR-DUTE). Journal of Magnetic Resonance Imaging, vol. 45, no. 4, pp. 1097-1104 (2017)
2. Peggs et al. Functional Pulmonary Proton MRI: Voxel-wise Linear-fitting Ventilation (VOLVE) Assessment in Chronic Obstructive Pulmonary Disease (COPD) [abstract]. In: Proceedings of the 32nd Joint Annual Meeting of the ISMRM-ESMRMB & ISMRT; 2023 June 3-8; Toronto, CA. Abstract # 4662.
3. Mirsadraee et al. T1 characteristics of interstitial pulmonary fibrosis on 3T MRI—a predictor of early interstitial change? Quant Imaging Med Surg, vol. 6, no.1, pp.42-49 (2016)
Figures