2762
Effect of Bronchodilator Treatment on Pulmonary Artery Pulse Wave Velocity in COPD measured with PREFUL MRI1Institute of Diagnostic and Interventional Radiology, Hannover Medical School, Hannover, Germany, 2Biomedical Research in End-stage and Obstructive Lung Disease Hannover, German Center for Lung Research, Hannover, Germany, 3Department of Respiratory Medicine, Hannover Medical School, Hannover, Germany
Synopsis
Keywords: Lung, Lung
Motivation: Vascular stiffness and secondary pulmonary hypertension in COPD are common. Noninvasive measurement of pulse wave velocity as a marker of arterial stiffness by PREFUL MRI is feasible. The effect of bronchodilators on PWV is unclear.
Goal(s): To determine the effect of bronchodilators on pulmonary artery stiffness as measured by PWV derived using PREFUL MRI.
Approach: PREFUL MRI in 52 patients before and after placebo-controlled bronchodilator treatment.
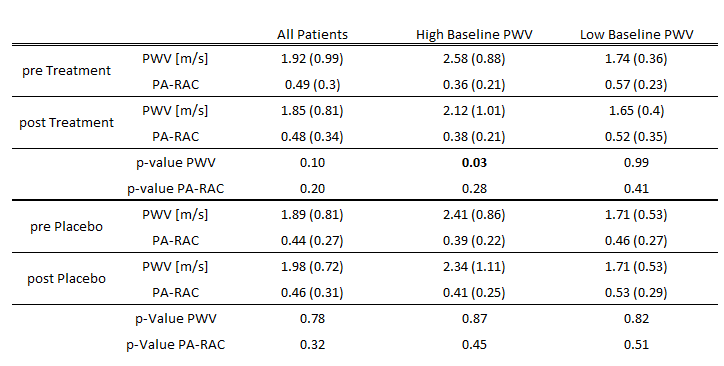
Results: In patients with elevated PWV, a significant decrease in PWV was measured after treatment. In the placebo control period and in the patients with normal baseline PWV, no significant changes were observed.
Impact: Pulmonary artery stiffness can be measured by PREFUL MRI-based pulse wave velocity (PWV) calculation. PREFUL MRI is a promising tool to monitor PWV changes after bronchodilator treatment.
Introduction
Arterial stiffening in the pulmonary circulation impedes the damping of the pulsatile flow to more continuous flow at the capillary level and has been associated with mortality (1). One marker for arterial stiffness is pulse wave velocity (PWV). In chronic obstructive pulmonary disease (COPD), arterial stiffening and pulmonary hypertension are common. It has been shown that bronchodilator can significantly improve pulmonary microvascular blood flow (PMBF) in COPD (2). This improvement might lead to decreased vascular resistance and thus arterial stiffness. However, the effect of bronchodilators on PWV has not yet been assessed. We hypothesize that a significant decrease in PWV due to bronchodilator treatment can be detected using phase-resolved functional lung (PREFUL) MRI-based PWV calculation.Methods
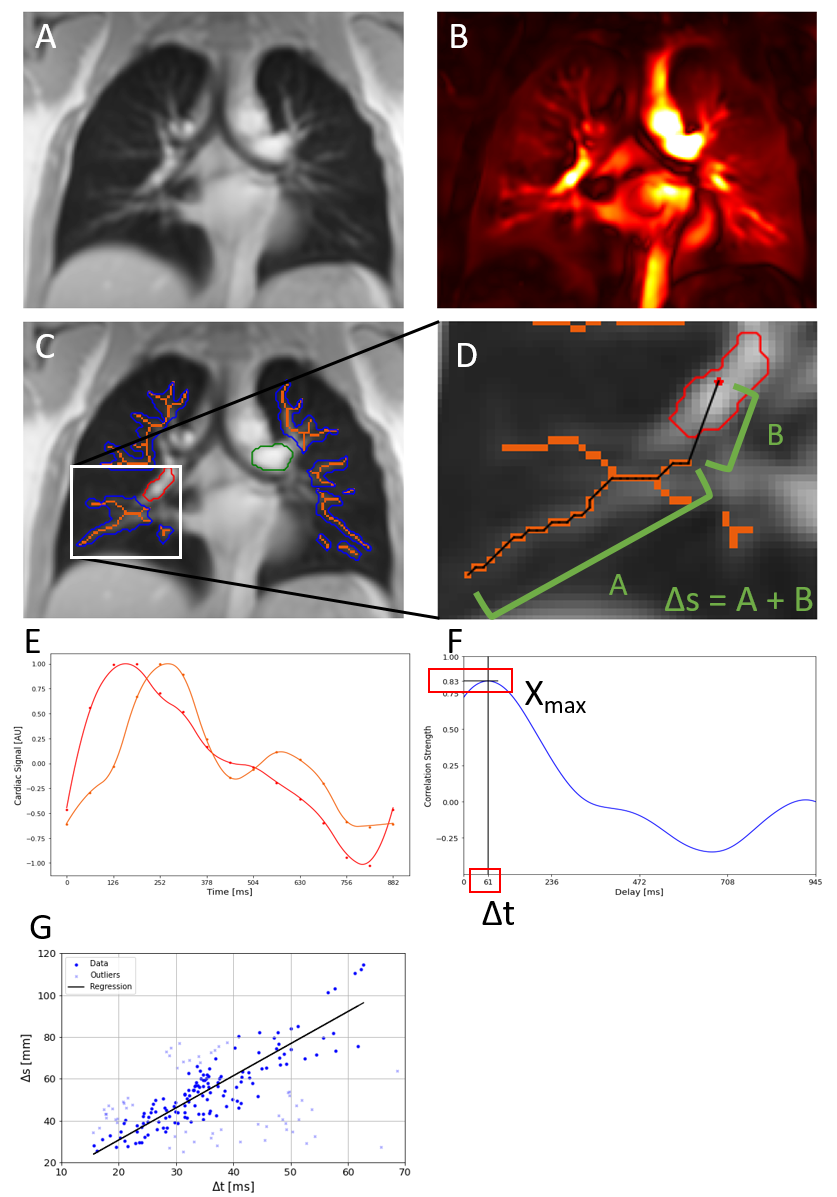
The CLAIM study (2) was a randomized, two-period crossover, placebo-controlled, single-center study to assess the effect of Indacterol/Glycopyrronium (IND/GLY) treatment on cardiac and pulmonary function in COPD. 52 patients were randomly assigned (1:1) to either receive an inhaled bronchodilator containing IND/GLY daily for 14 days, followed by a 14-day washout, then a matched placebo for 14 days, or to receive the same treatments in reverse order. Before and after each period, MRI was performed at 1.5T (MAGNETOM Avanto, Siemens Healthcare, Erlangen, Germany) in head-first supine position. A 2D spoiled gradient echo sequence with a 500x500mm field of view, 15mm slice thickness, 128x96 matrix size, 0.82ms echo time, 3ms repetition time, 5° flip angle and 1500Hz/px pixel bandwidth was used. 200 coronal plane images at the location of the carina were acquired in free breathing (figure 1a) and were analyzed with the PREFUL MRI method (3). Bodyplethysmography, spirometry and pulmonary artery relative area change (PA-RAC) measured by phase-contrast MRI at the baseline scan were also reported. Based on the PREFUL-derived cardiac cycle, PWV is calculated: After U-net based segmentation (4) of left and right pulmonary artery (LPA/RPA) and vasculature, a skeletonization algorithm is applied to the vasculature segment (figure 1c). For each voxel [i,j] on the skeleton, the distance Δsi,j to the respective reference region (RPA/LPA) and temporal delay Δti,j of the cardiac cycles is determined. For Δsi,j, the path distance along the skeleton to the skeleton-point closest to the LPA/RPA reference region is measured and the remaining euclidian distance to the centroid of the reference region is added (figure 1d). The interpolated cardiac cycle (figure 1e) in each voxel is cross-correlated to the cardiac cycle within the reference region, resulting in a maximum correlation strength Xmax,i,j at the temporary delay Δti,j (figure 1f). To exclude venous and partial volume voxel, a minimum Xmax,i,j of 0.8 is set. To derive PWV from the available data points of Δti,j and Δsi,j, ordinary least squares regression is used. Data points outside the 25-75 percentile range of PWVi,j = Δsi,j/Δti,j are excluded. The slope of the regression is reported as PWV (see figure 1g). Based on previous studies (5) , we separate the cohort into subcohorts with high (PWV > 2m/s) and low PWV at baseline.Results
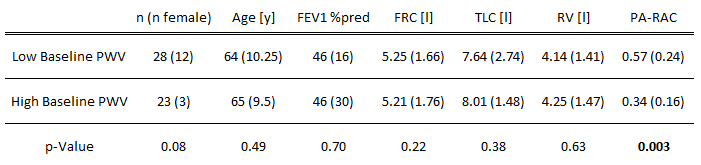
In the overall cohort, no significant change was observed. The two subcohorts did not show significant differences in age, spirometry or bodyplethysmography. PA-RAC was significantly lower in the high-PWV group (see table 1). In the high-PWV cohort, we observe a significant reduction of PWV after treatment but not after placebo. In the low-PWV group, no significant change was observed (see table 2). No significant change was observed in PA-RAC.Discussion
Unlike previous results on PMBF (2), no significant differences in PWV were observed in the overall cohort. However, patients with elevated baseline PWV showed a significant decrease in PWV with treatment, while no changes were observed over the placebo period or in the low-PWV group. No difference was observed in PA-RAC, likely due to the proximal measurement as compared to the distal measurement in PWV. The separation of the cohort was not associated with differences in age, spirometry or bodyplethysmography. However, the lower PA-RAC in the high-PWV subcohort confirms the difference in arterial stiffness between both groups. The lower PWV observed in the high-PWV subcohort after treatment may be due to lower pulmonary artery pressure in response to the improved PMBF (2) due to improved ventilation leading to reduced parenchymal hypoxia. The lack of evidence for an association of arterial stiffness with measures of hyperinflation confirms findings previously published (6). Limitations of this work lie in the weak evidence for the selection of the threshold to separate between the subcohorts, the monocentric design and the low number of patients.Conclusion
In COPD patients with arterial stiffness, IND/GLY treatment can significantly lower PWV measured by PREFUL MRI.Acknowledgements
No acknowledgement found.References
1. Hunter KS, Lammers SR, Shandas R: Pulmonary Vascular Stiffness: Measurement, Modeling, and Implications in Normal and Hypertensive Pulmonary Circulations. Compr Physiol 2011; 1:1413.
2. Vogel-Claussen J, Schönfeld CO, Kaireit TF, et al.: Effect of indacaterol/glycopyrronium on pulmonary perfusion and ventilation in hyperinflated patients with chronic obstructive pulmonary disease (CLAIM) a double-blind, randomized, crossover trial. Am J Respir Crit Care Med 2019; 199:1086–1096.
3. Voskrebenzev A, Gutberlet M, Klimeš F, et al.: Feasibility of quantitative regional ventilation and perfusion mapping with phase-resolved functional lung (PREFUL) MRI in healthy volunteers and COPD, CTEPH, and CF patients. Magn Reson Med 2018; 79:2306–2314.
4. Ronneberger O, Fischer P, Brox T: U-net: Convolutional networks for biomedical image segmentation. Lecture Notes in Computer Science (including subseries Lecture Notes in Artificial Intelligence and Lecture Notes in Bioinformatics) 2015; 9351:234–241.
5. Wernz M, Voskrebenzev A, Müller R, et al.: Feasibility of pulse wave velocity measurement in pulmonary arteries from phase-resolved functional lung MRI. In Proc Intl Soc Mag Reson Med 2023:1785. Toronto; 2023.
6. Liu CY, Parikh M, Bluemke DA, et al.: Pulmonary artery stiffness in chronic obstructive pulmonary disease (COPD) and emphysema: The Multi-Ethnic Study of Atherosclerosis (MESA) COPD Study. J Magn Reson Imaging 2018; 47:262–271.
Figures