2760
Early renal function assessment and follow-up after renal transplantation using various diffusion models1Tianjin First Center Hospital, Tianjin, China, 2MR Research Collaboration, Siemens Healthineers Ltd, Beijing, China, 3MR Application Predevelopment, Siemens Healthineers AG, Erlangen, Germany
Synopsis
Keywords: Kidney, Transplantation, kidney
Motivation: Although renal biopsy is the gold standard for the diagnosis of renal allograft dysfunction, it is an invasive procedure. Magnetic resonance imaging (MRI) can be used to evaluate renal allograft function in a noninvasive manner.
Goal(s): To investigate the utilities of various diffusion models in evaluating early renal allograft function.
Approach: Follow-up MRI was performed at 14, 30, and 90 days after renal transplantation to evaluate correlations between MRI parameters and estimated glomerular filtration rate, along with their abilities to measure renal function after transplantation.
Results: Various diffusion models can reflect changes in early renal function after transplantation.
Impact: Intravoxel incoherent motion and diffusion kurtosis imaging models may serve as useful tools to investigate early renal function after transplantation.
Introduction
The rate of survival among kidney transplant recipients is similar to the rate of graft survival. Magnetic resonance imaging (MRI) is a noninvasive technique with robust capacity to evaluate allograft function 1,2 3. Here, we investigated the utilities of various diffusion models in evaluating early renal allograft function and performing subsequent follow-up.Methods
From February 2019 to January 2020, 49 patients were prospectively recruited at 14 days after renal transplantation. Exclusion criteria were vascular complications, fluid collection, urologic complications, tumors, and simultaneous pancreatic-renal transplantation. Multi b-value diffusion weighted imaging (DWI) was performed at 14, 30, and 90 days after renal transplantation; serum creatinine levels were recorded up to 1 year post-transplantation. The Modification Of Diet In Renal Disease (MDRD) equation was used to calculate each patient’s estimated glomerular filtration rate (eGFR).MRI examinations were performed on a 3T MR scanner (MAGNETOM Prisma, Siemens Healthineers, Erlangen, Germany) with a 32-channel body coil. For all patients, multi-b-value DWI scans were acquired using an experimental single-shot echo-planar imaging sequence with integrated slice-by-slice shimming technique in the coronal plane under free-breathing conditions. The detailed parameters were as follows: repetition time/echo time=1500.0/60.0 ms, field of view=300×300 mm2, slice thickness=5 mm, matrix=128×128, 13 b-values (0, 10, 20, 30, 50, 100, 200, 300, 500, 800, 1000, 1500, and 2000 s/mm2), and three orthogonal directions for each b-value.
DWI data were processed and analyzed using investigational post-processing software (MR Body Diffusion Toolbox V1.6.0, Siemens Healthineers, Erlangen, Germany). DWI scans with all b-values were used to generate apparent diffusion coefficient (ADC) maps from the mono-exponential model. DWI scans with 10 b-values (0, 10, 20, 30, 50, 100, 200, 300, 500, and 800 s/mm2) were utilized to generate parametric maps (including pseudo diffusion coefficient [Dp], diffusion coefficient [D], and perfusion fraction [fp]) from the intravoxel incoherent motion (IVIM) model4. DWI scans with five b-values (0, 800, 1000, 1500, and 2000 s/mm2) were utilized to generate parametric maps (mean kurtsosis [MK] and mean diffusivity [MD]) from the diffusion kurtosis imaging model5.
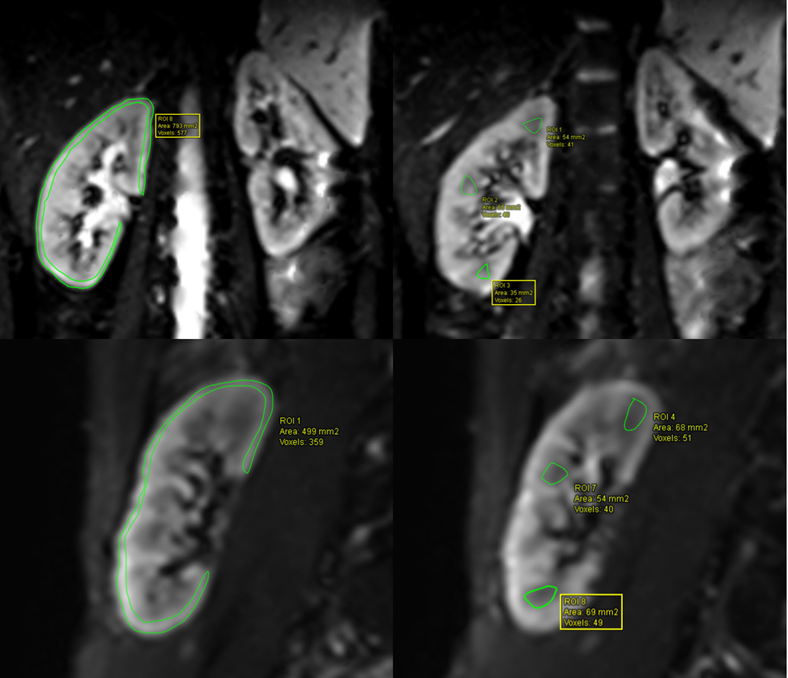
Regions of interest (ROIs) were delineated on the b=0 s/mm2 DWI images: one ROI in the renal cortex and three ROIs in the renal medulla at the upper, middle, and lower poles of the kidney (Figure 1). The ROIs were automatically transferred to the corresponding ADC, MD, MK, D, Dp, and fp maps. The values of renal cortex and medulla parameters in the allografts were independently measured by two radiologists with 12 and 3 years of experience.Statistical analyses were performed using SPSS 26.0 software (SPSS Inc., Chicago, IL, USA). Spearman correlation analysis was used to identify correlations between eGFR and parameters generated from multi-b-value DWI. The chi-squared test was used to evaluate differences in clinical characteristics among renal transplant recipients. Paired-sample t-tests were used to compare MRI parameters of the transplanted kidney cortex and medulla. Independent-sample t-tests and the Mann-Whitney U test were used to compare MRI parameters between patients with good and poor renal function. The diagnostic performances of the parameters were analyzed using receiver operating characteristic (ROC) curves. The DeLong test was used to compare areas under the curve between parameters.
Results
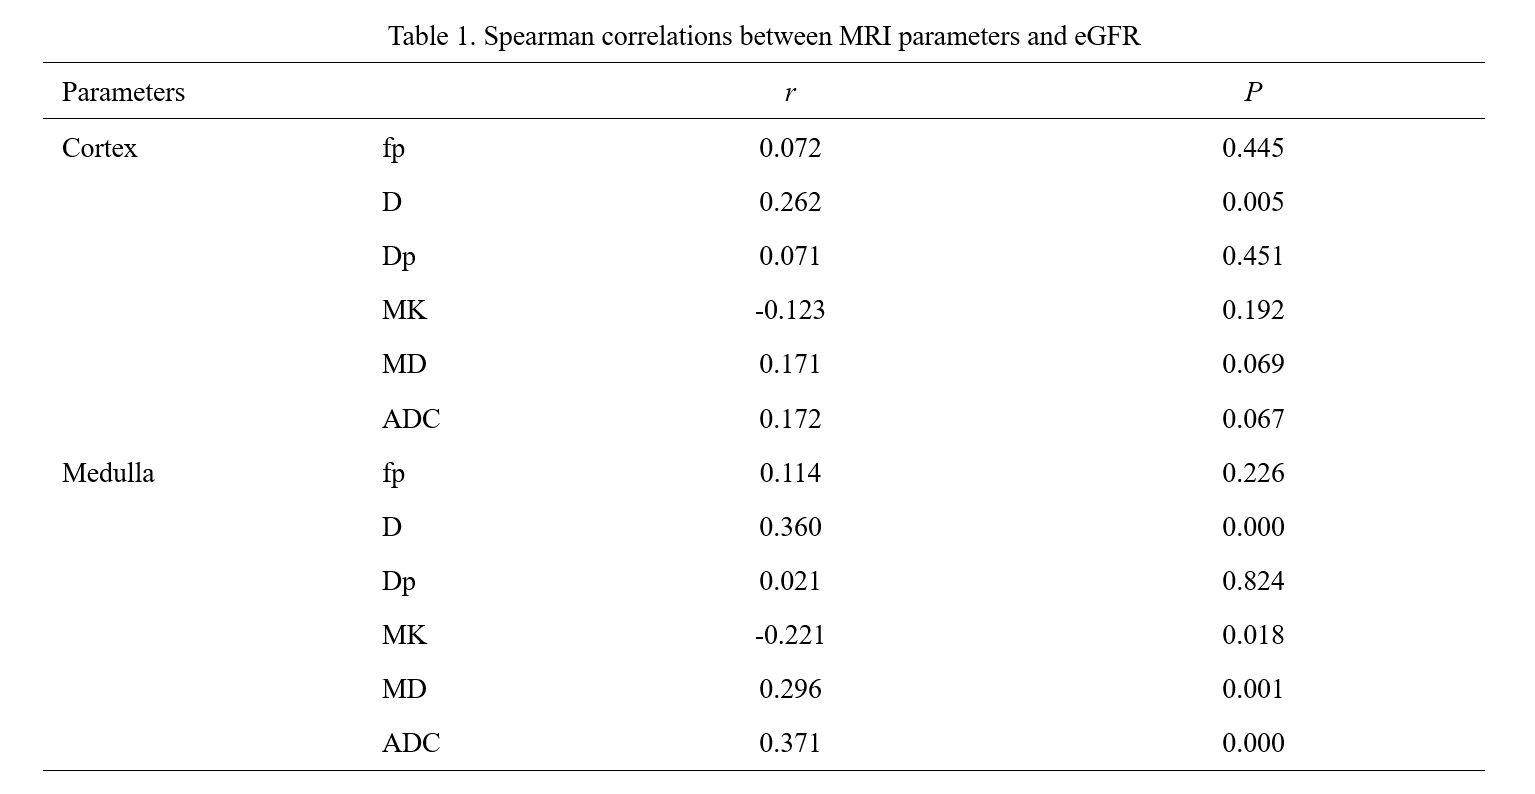
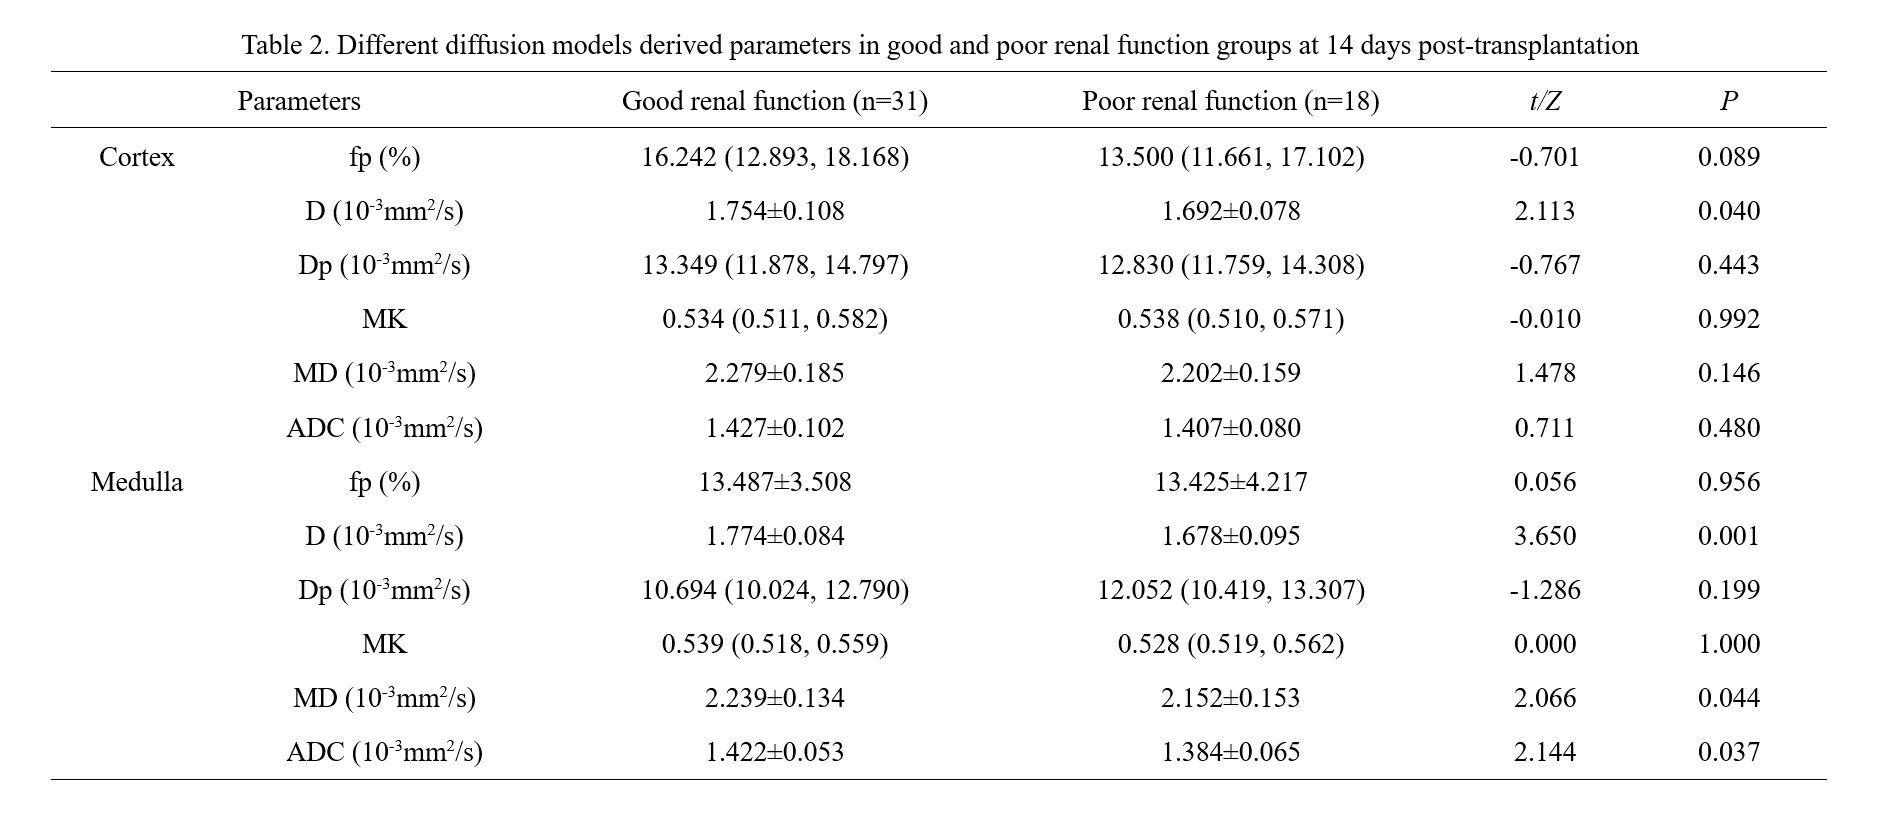
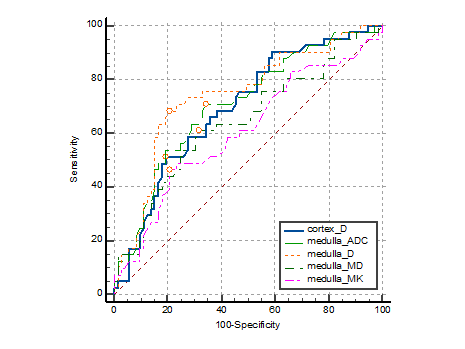
There were no statistically significant differences in clinical characteristics between patients with good and poor renal function. Spearman correlation analysis showed that cortical D, medullary D, MK, MD, and ADC values exhibited fair to moderate correlations with eGFR. In the group with consistently good function, the fp and Dp values of the cortex were higher than those values in the medulla during follow-up. In the group with consistently poor function, there was no significant difference in fp values of the cortex and medulla during the first follow-up period, whereas the fp and ADC values of the cortex were greater than those values in the medulla during the second follow-up period. The cortical D, medullary D, MD, and ADC values were higher in patients with good renal function than in patients with poor renal function. ROC curve analysis showed that the medullary D value had the highest diagnostic efficacy (area under the curve 0.741, 95% confidence interval 0.650-0.818), and the diagnostic threshold was 1.724 (sensitivity 68.3%, specificity 80.8%).Conclusion
Our study investigated the value of IVIM and diffusion kurtosis imaging techniques in reflecting renal function early after renal transplantation and its changes during follow-up. In our study, the parameters of IVIM and diffusion kurtosis imaging demonstrated good correlations with eGFR in renal transplant patients, indicating that they can reflect early renal function after transplantation.Acknowledgements
Ping Yang substantially contributed to the conception and design, acquisition of data, or analysis and interpretation of data; Lihua Chen drafted the article or revised it critically for important intellectual content; Jinxia Zhu, Robert Grimm, and Alto Stemmer finally approved the version to be published; and, Wen Shen agreed to be accountable for all aspects of the work in ensuring that the questions related to the accuracy or integrity of any part of the work are appropriately investigated and resolved.References
1. Van Eijs MJM, van Zuilen AD, de Boer A, Froeling M, Nguyen TQ, Joles JA, Leiner T, Verhaar MC. Innovative Perspective: Gadolinium-Free Magnetic Resonance Imaging in Long-Term Follow-Up after Kidney Transplantation. Front Physiol. 2017 May 16;8:296.
2. Wang W, Yu Y, Wen J, et al. Combination of functional magnetic resonance imaging and histopathologic analysis to evaluate interstitial fibrosis in kidney allografts. Clin J Am Soc Nephrol, 2019,14(9):1372-1380.
3. Vermathen P, Binser T, Boesch C, et al. Three-year follow-up of human transplanted kidneys by diffusion-weighted MRI and blood oxygenation level-dependent imaging[J]. J Magn Reson Imaging, 2012,35(5):1133-1138.
4. Ichikawa S, Motosugi U, Ichikawa T, et al. Intravoxel incoherent motion imaging of the kidney: alterations in diffusion and perfusion in patients with renal dysfunction. Magn Reson Imaging 2013;31:414-417.
5. Jensen JH, Helpern JA. MRI quantification of non-Gaussian water diffusion by kurtosis analysis[J]. Nmr Biomed, 2010,23(7): 698-710.
Figures