2759
Multi-Parametric MRI using Quantitative Non-Contrast Imaging for the Evaluation of Patients with Chronic Kidney Disease1Radiology, UT Southwestern Medical Center, Dallas, TX, United States, 2UT Southwestern Medical Center, Dallas, TX, United States
Synopsis
Keywords: Kidney, Kidney, CKD, ASL, DWI, BOLD, MRE
Motivation: Multiparametric (mp) MRI can enable functional characterization of entire kidneys for the assessment of patients with chronic kidney disease (CKD).
Goal(s): To evaluate quantitative mpMRI for functional characterization in CKD patients and compare against healthy volunteers.
Approach: Seven CKD patients and 6 healthy volunteers underwent MRI including ASL (perfusion), DWI (cellularity), BOLD (oxygenation), and MRE (fibrosis).
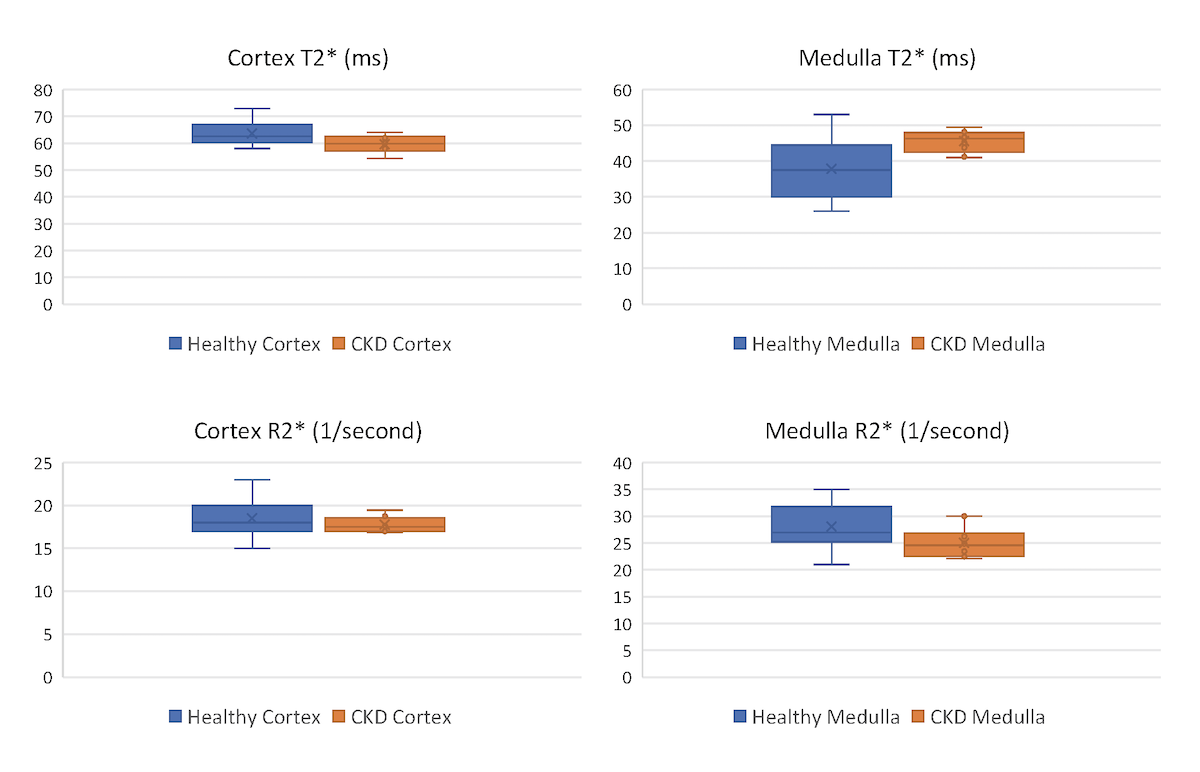
Results: ASL measured perfusion was significantly lower in CKD patients compared to healthy volunteers (P<0.05), while DWI measured ADC was not different (P=0.36). BOLD measurement was statistically different in Medulla (T2*: P=0.009; R2*: P=0.05), but was not different in cortex (T2*: P=0.08; R2*: P=0.32).
Impact: Multi-parametric MRI, particularly using ASL measured perfusion and BOLD measured R2* provides functional characterization of kidneys that could facilitate longitudinal monitoring and therapeutic interventions in CKD patients.
INTRODUCTION:
MRI serves as a powerful imaging method for functional characterization of the entire kidneys without using exogenous contrast agent. This is particularly important in patients with compromised renal function such as chronic kidney disease (CKD), acute kidney injury (AKI), or renal transplant. In recent years, substantial progress has been made for clinical translation of quantitative MRI for the assessment of kidney disease (1). Individual MRI methods provide distinct functional information such as perfusion using ASL, cellularity using DWI, oxygenation using BOLD, and fibrosis using MR Elastography (MRE). The purpose of this work was to implement a comprehensive non-contrast multi-parametric (mp) MRI protocol for the assessment of kidney function in CKD patients and compare against healthy volunteers.METHODS:
Subjects: In this ongoing prospective IRB-approved study, 6 healthy volunteers and 7 CKD patients were enrolled and included in this report. After written informed consent, all patients underwent research MRI on a 3T scanner (Achieva or Ingenia, Philips Healthcare) in supine and feet-first position. A 16‐channel anterior torso coil combined with 12-channel posterior coil embedded in the scanner table along with respiratory bellows were used for kidney imaging. CKD patients also underwent clinical biopsy, as standard of care. Image acquisition: Single slice 2D ASL were acquired in axial or coronal direction with single shot TSE readout: label duration/post-label delay = 1.5/1.5s, acquired resolution = 3x3x10 mm3, TR/TE = 6000/50ms, ETL = 67, echo-spacing = 2.8 ms, NSA = 16, scan time = 3 min 24 s with guided breathing. 2D BOLD with four slices were acquired in coronal direction with FFE readout: acquired resolution = 2x2x5 mm3, TR=75 ms, 16 echoes, first echo = 2.3 ms, echo-spacing = 2.2ms, scan time = 34 s with one breathhold. 2D DWI were acquired in or coronal direction with SE-EPI readout: acquired resolution: 2.5x2.5x5mm3, TR/TE=4800/407 ms, 7 b-values: 0, 30, 70, 100 (2 NSA), 200 (2 NSA), 400 (3 NSA), 800 (6 NSA), scan time = 1 min 26 s under free breathing. 2D MRE with four slices were acquired in coronal direction with FFE readout: acquired resolution = 1.5x4.5x10mm3, TR/TE=50/20 ms, scan time = 1 min 29 s, acquired in 4 breathholds (separate breathhold for each slice in ~20 seconds).RESULTS:
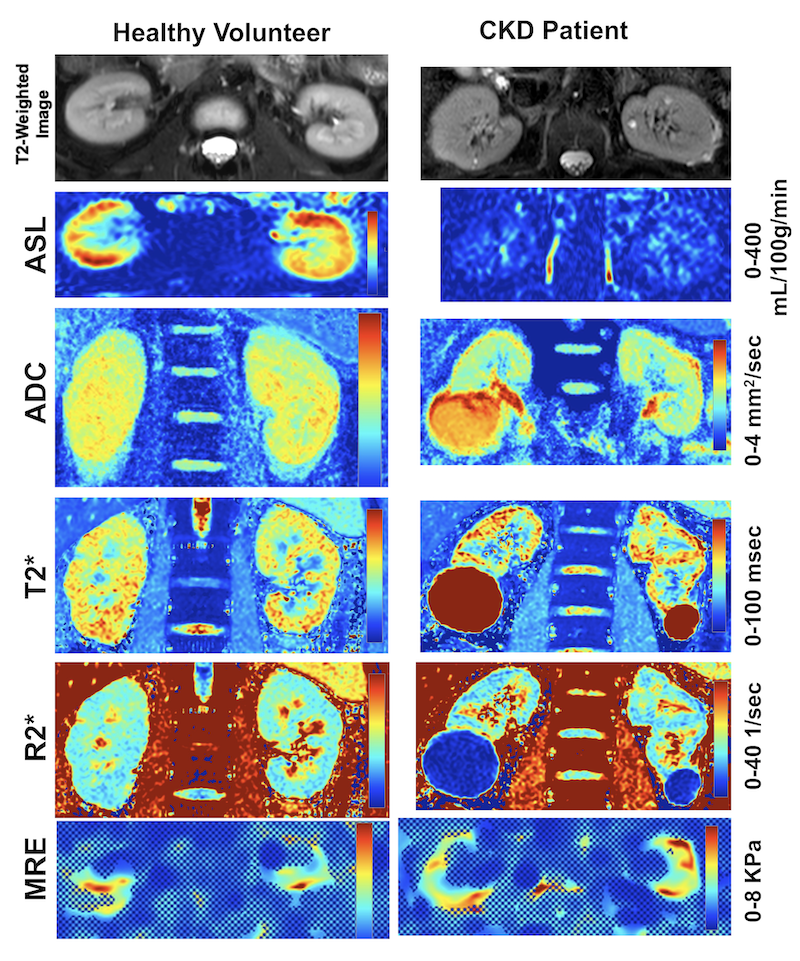
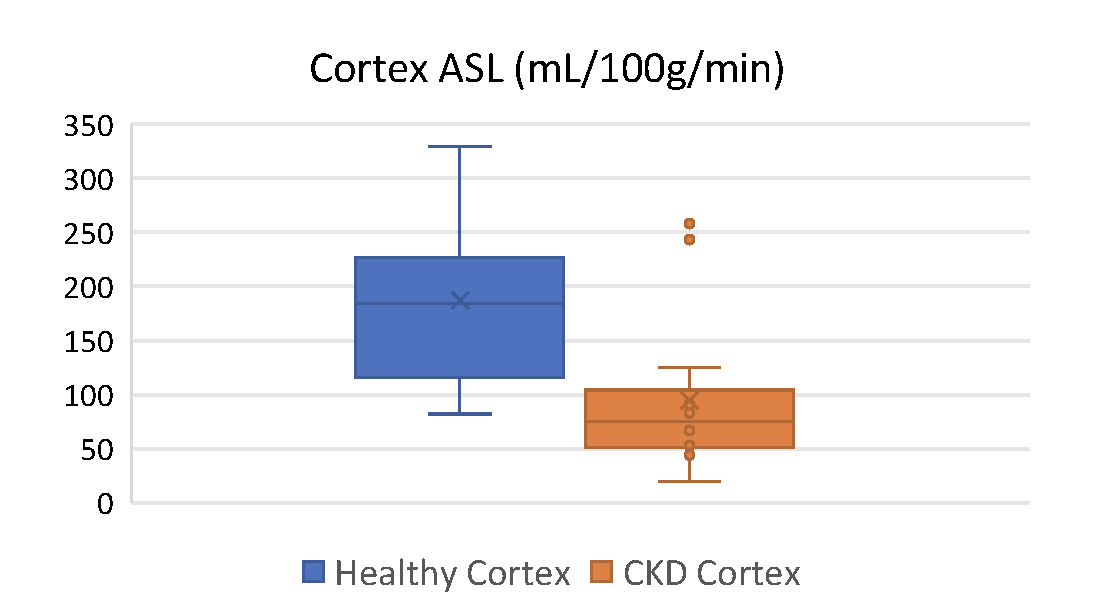
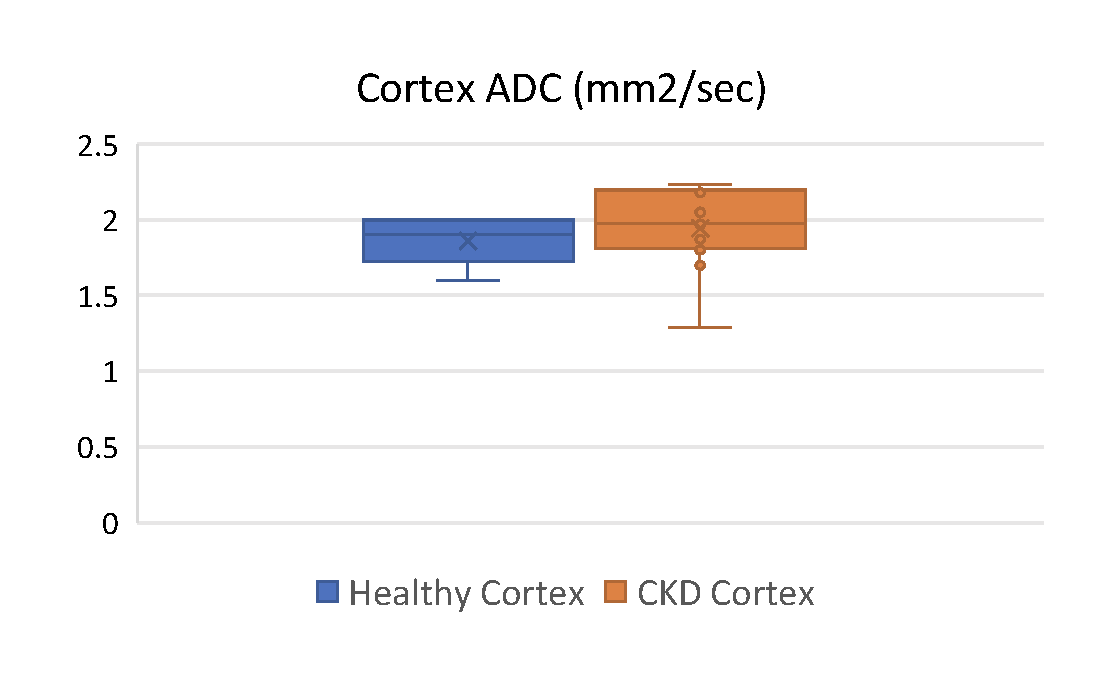
MRI was successfully performed in all subjects, however, some data were excluded due to technical challenges. ASL was included from all subjects (n=13); ADC was excluded from 1 CKD patient due to substantial motion artifacts (n=12); T2* and R2* from BOLD were excluded from a different CKD patient due to increased noise (n=12). MRE was performed on only 1 healthy volunteer and 5 CKD patients, for a total of n=6 measurements and hence were not included for comparison analysis. Fig. 1 demonstrates all quantitative maps in a representative healthy volunteer (left column) and a CKD patient (right column). Anatomical T2-weighted images show loss of corticomedullary differentiation in CKD patient. While there are subtle differences in quantitative parameters between the two subjects, the ASL measured perfusion is substantially lower in CKD patient. Across all subjects, ASL measured perfusion was statistically lower in CKD patients (104±72 mL/100g/min) compared to healthy volunteers (187±76 mL/100g/min) (P=0.012) (Fig. 2). DWI measured ADC was not statistically different between the two cohorts (CKD: 1.94±0.27 mm2/s and Healthy Volunteers: 1.86±0.16 mm2/s, P=0.36) (Fig. 3). BOLD measurement showed statistical difference in medulla with higher T2* (P=0.009) and lower R2* (P=0.05) in CKD patients compared to healthy volunteers, while it was not different in the cortex for both T2* (P=0.08) and R2* (P=0.32). MRE measured stiffness in the kidneys of CKD patients was 3.92 ± 0.96 KPa.DISCUSSION and CONCLUSION:
Among all quantitative parameters, ASL measured perfusion in renal cortex and BOLD measured T2* and R2* in renal medulla showed differences in CKD patients compared to healthy volunteers. These results are in agreement with earlier reports (2,3). DWI measured ADC did not show differences in our patient cohort with motion artifacts and geometric distortions contributing to additional challenges. MRE showed characterization but additional technical improvements are warranted to improve robustness. This study establishes a comprehensive non-contrast quantitative mpMRI protocol that shows differences in ASL measured perfusion and BOLD measured T2* and R2* in CKD patients and can facilitate longitudinal monitoring and therapeutic interventions.Acknowledgements
The authors thank all patients for their participation in the study.References
1. Francis ST et. al. Am J Kidney Dis. 82 (4): 491-504.
2. Nery F et. al. Magn Reson Med. 2019 May;81(5):2972-2984.
3. Prasad P et. al. Kidney Int Rep. 2023 Mar 7;8(5):1057-1067.
Figures