2758
Combining ASL and MRE to Investigate the Impact of Perfusion on Renal Stiffness in Patients with CKD: A Preliminary Study1Department of Radiology, Shenzhen Traditional Chinese Medicine Hospital (The Fourth Clinical Medical College of Guangzhou University of Chinese Medicine), Shenzhen, China, 2Shenzhen University, Shenzhen, China, 3MR Research Collaboration, Siemens Healthineers, Guangzhou, China, 4MR Application Predevelopment, Siemens Healthineers AG, Erlangen, Germany, 5MR Research Collaboration, Siemens Healthineers, Shanghai, China, 6MR Research Collaboration, Siemens Healthineers, Beijing, China
Synopsis
Keywords: Kidney, Arterial spin labelling, Magnetic resonance elastography, chronic kidney disease, perfusion assessment, renal stiffness
Motivation: The impact of renal perfusion on stiffness values is yet to be conclusively validated, which has hindered the diagnostic application of magnetic resonance elastography (MRE) in patients with chronic kidney disease (CKD).
Goal(s): To explore the characteristics of renal perfusion and stiffness values in patients with CKD and their correlation.
Approach: Renal MRE and arterial spin labeling (ASL) were used to measure renal stiffness and blood flow. The study employed t-test, receiver-operating characteristic curves, and Spearman correlation for data analysis.
Results: The two techniques were effective in diagnosing CKD, simultaneously confirming the influence of perfusion factors on stiffness.
Impact: This preliminary human study further supported the correlation between renal stiffness and perfusion, supporting the enhanced diagnostic efficacy of combining MRE and ASL for CKD, thus facilitating staging.
Introduction
Renal stiffness quantification via magnetic resonance elastography (MRE) and perfusion assessment through arterial spin labeling (ASL) enable noninvasive, early renal function evaluation in patients with chronic kidney disease (CKD)[1-2].A few studies[3-4] indicate that shear wave speed (SWS, m/s) is a marker for renal stiffness assessed by MRE and decreases with increased fibrosis, as opposed to the liver[5]. This negative correlation is likely due to perfusion variations of renal, which is rich in blood supply. However, the hypothesis that MRE results are impacted by perfusion has not been validated in human experiments. This study investigated the influence of perfusion on renal SWS in patients with CKD to elucidate the distinct behavior of renal stiffness values compared with liver stiffness values in fibrosis.Methods
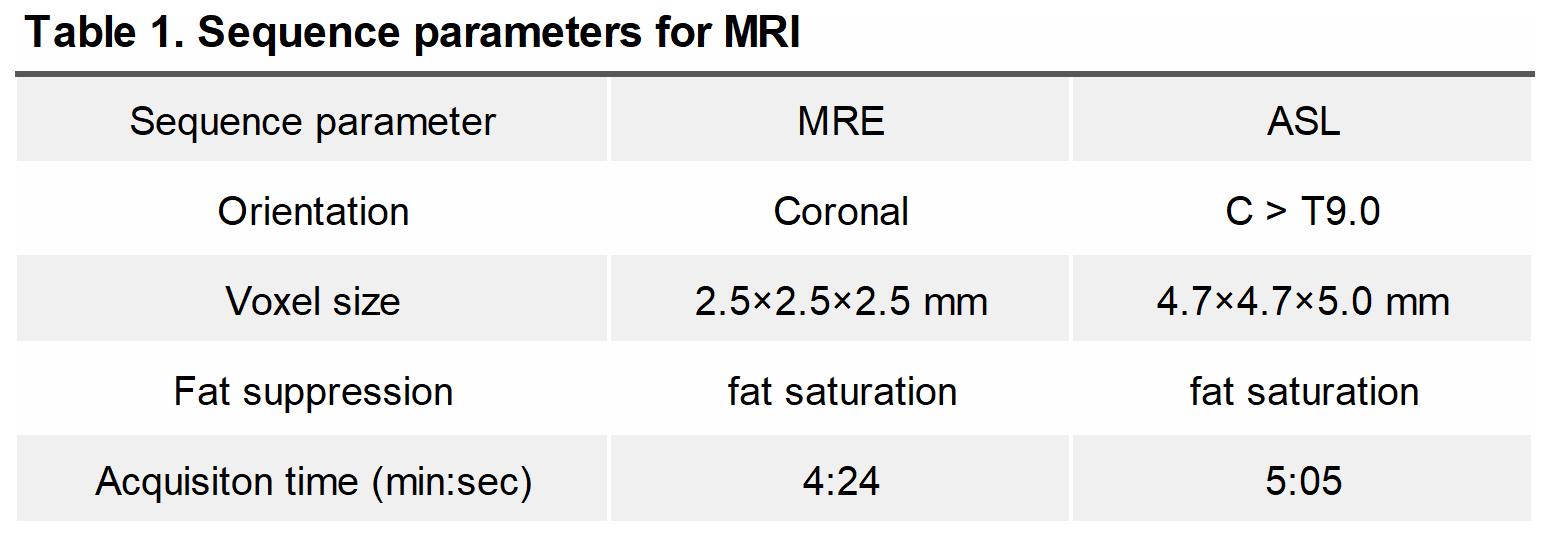
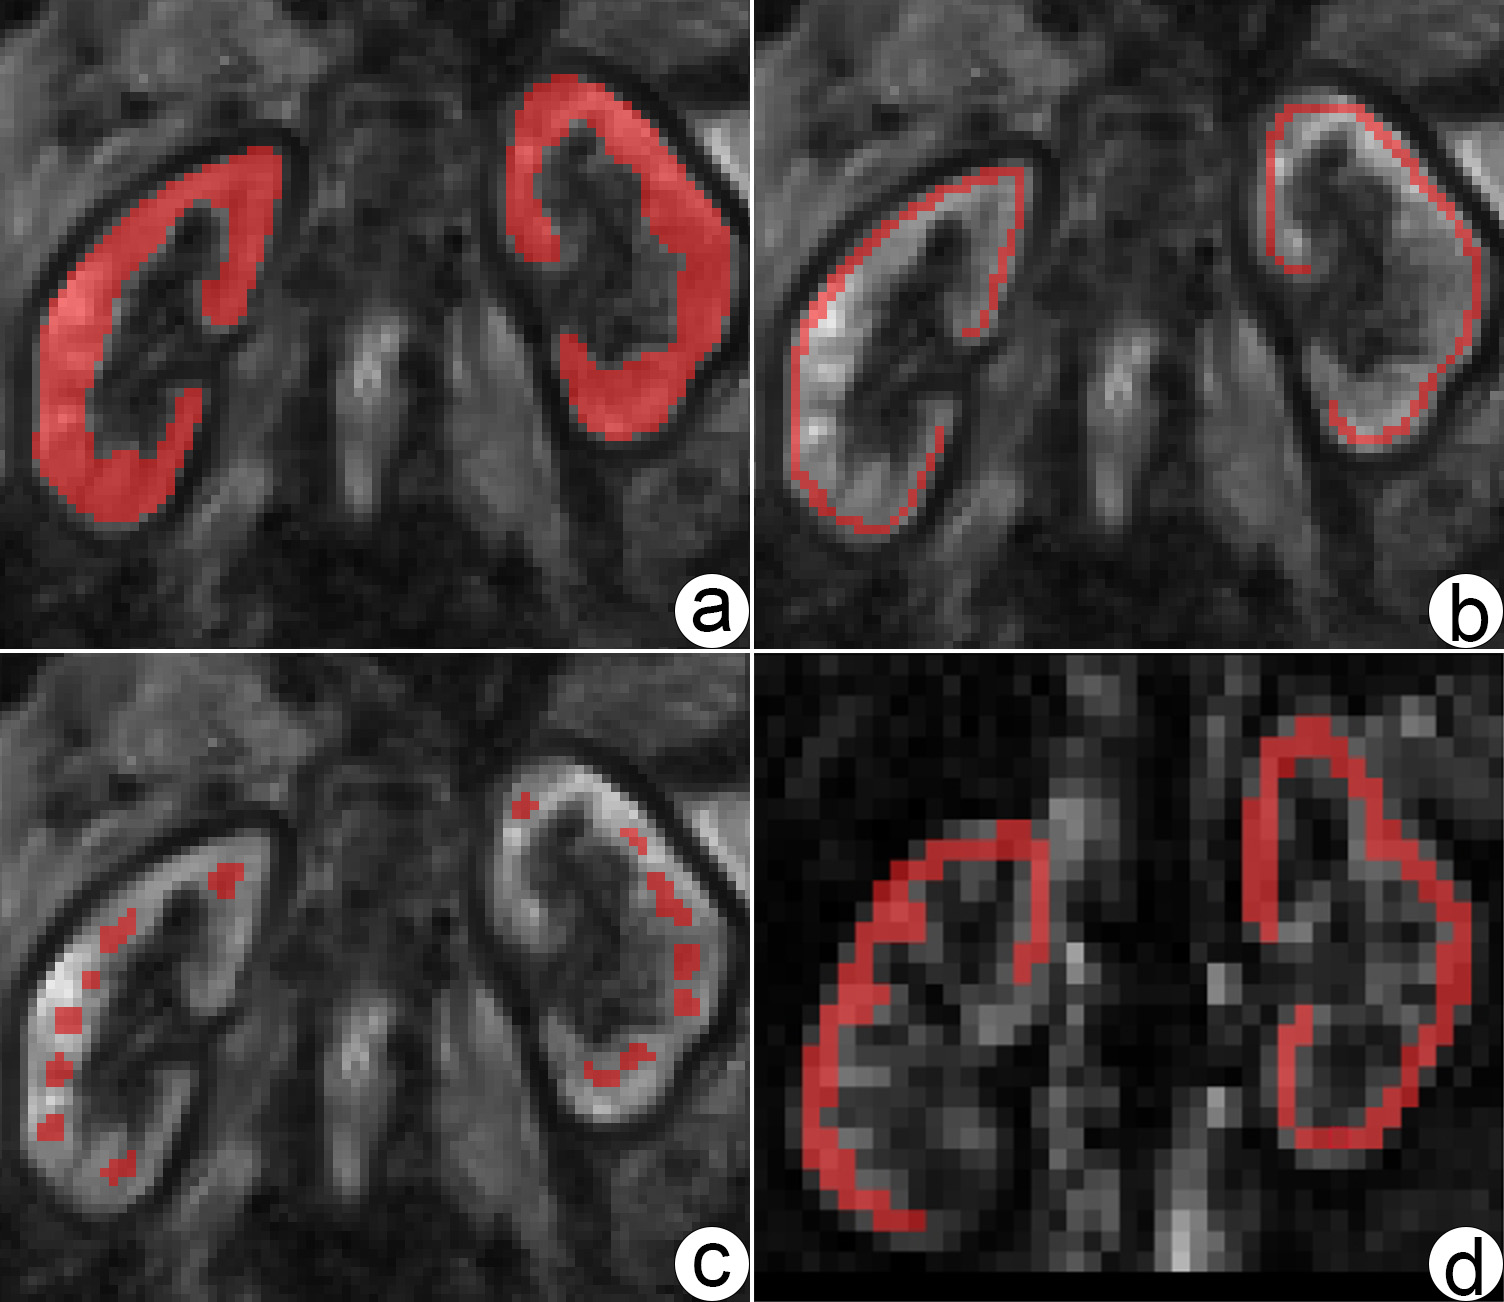
Nine healthy volunteers (HVs) and 9 patients with CKD undergoing MRE and a research ASL sequence on a 3T system (MAGNETOM Prisma, Siemens Healthineers AG, Erlangen, Germany) were recruited. The participants fasted for over 2 hours before the examination. During the examination, passive drivers were placed behind both kidneys. The scanning parameters are listed in Table 1.The raw MRE images were uploaded to the official elastography postprocessing website of Humboldt University, Germany (https://bioqic-apps.charite. de),and the kidney shear wave velocity C-map was obtained by postprocessing with wavenumber-based multifrequency dual elasto-visco (k-MDEV) inversion algorithm[6]. A radiologist (L.Q.M, with 3 years of experience in MRE of the kidney) manually delineated the ROIfor the quantitative analysis of renal stiffness value using C-map images and renal blood flow(RBF, mL/min/100g) usingrenal ASL images (see Fig. 1).The paired-samplet-test was used to compare the SWS measured in the renal cortex and medulla. The two-sample t-test was used to compare the differences in the MRI parameters measured in the renal of HVs and patients with CKD. The receiver-operating characteristic (ROC) curves were plotted to evaluate the diagnostic value of the two techniques for renal fibrosis. Spearman’s correlation was used to assess the relationship between clinical indicators and MRI parameters in patients with CKD, as well as the relationship between RBF and SWS of the unilateral renal cortex (without distinguishing HVsfrom patients with CKD).
Results
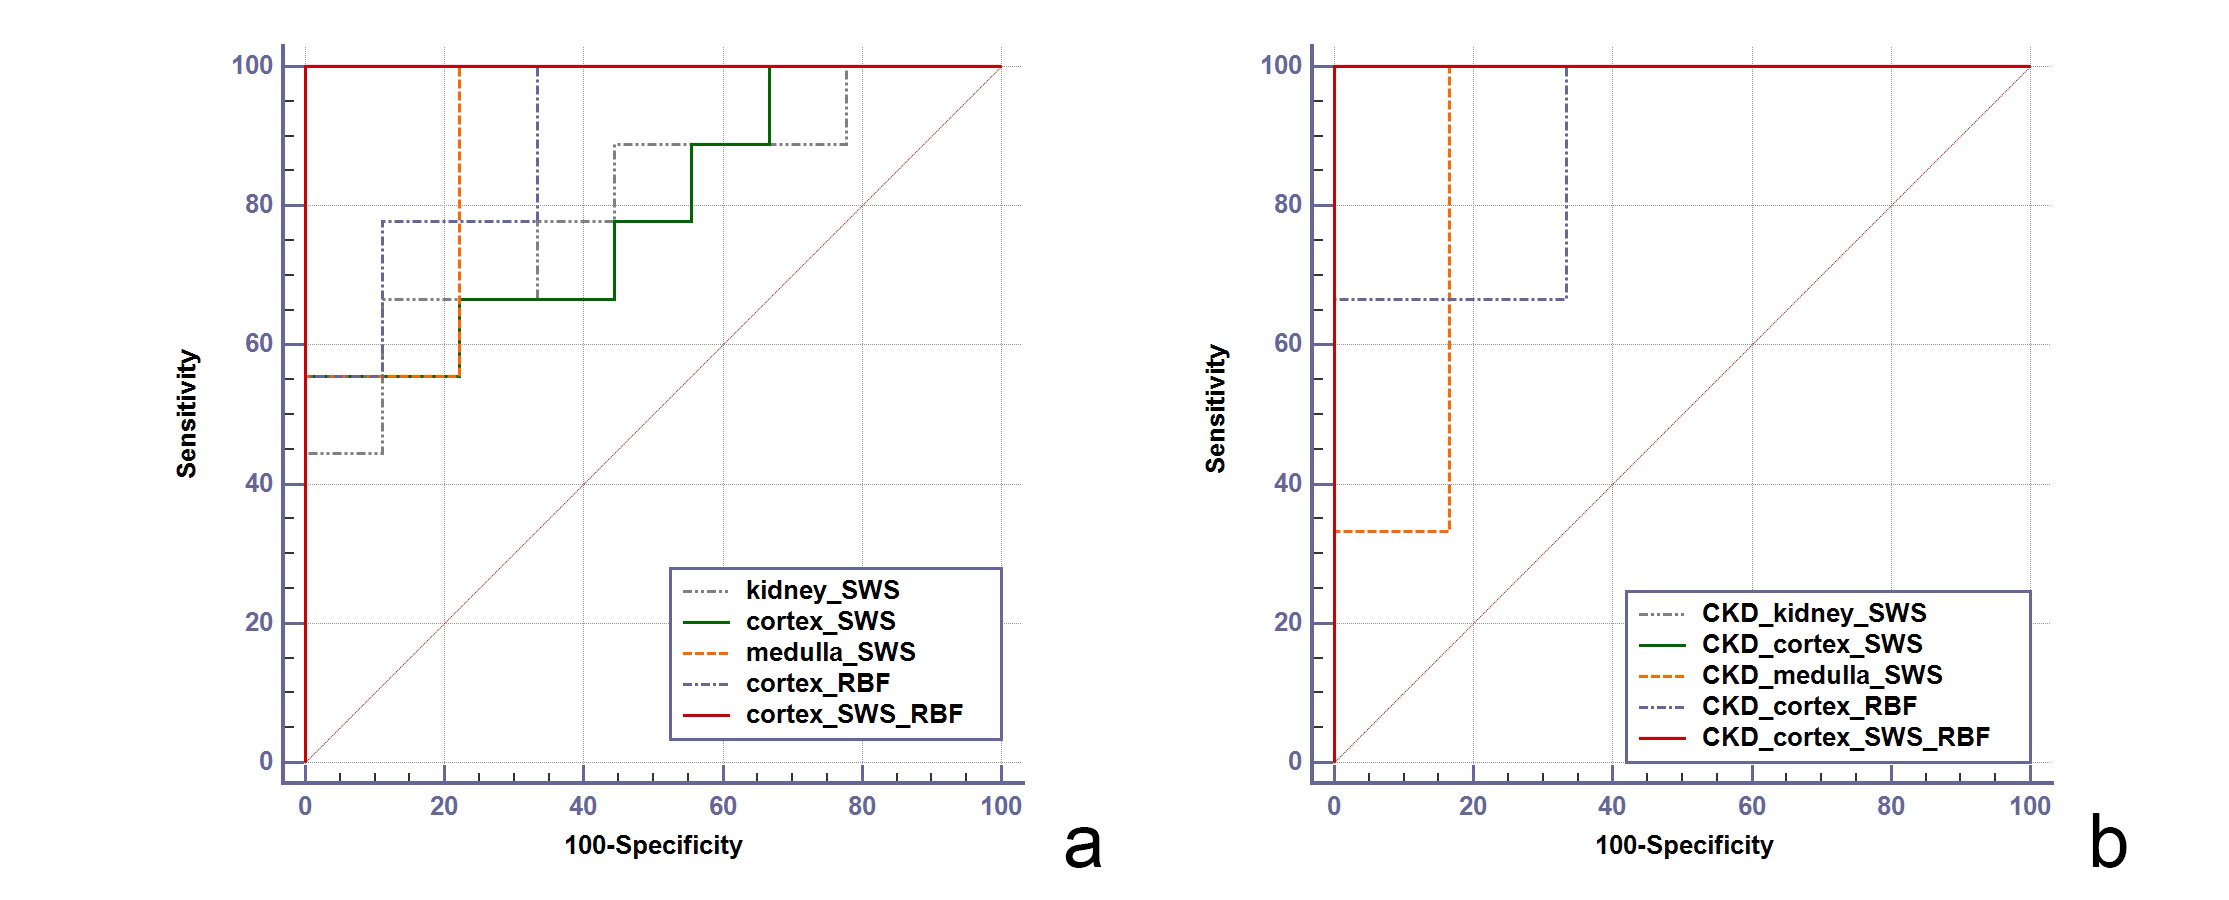
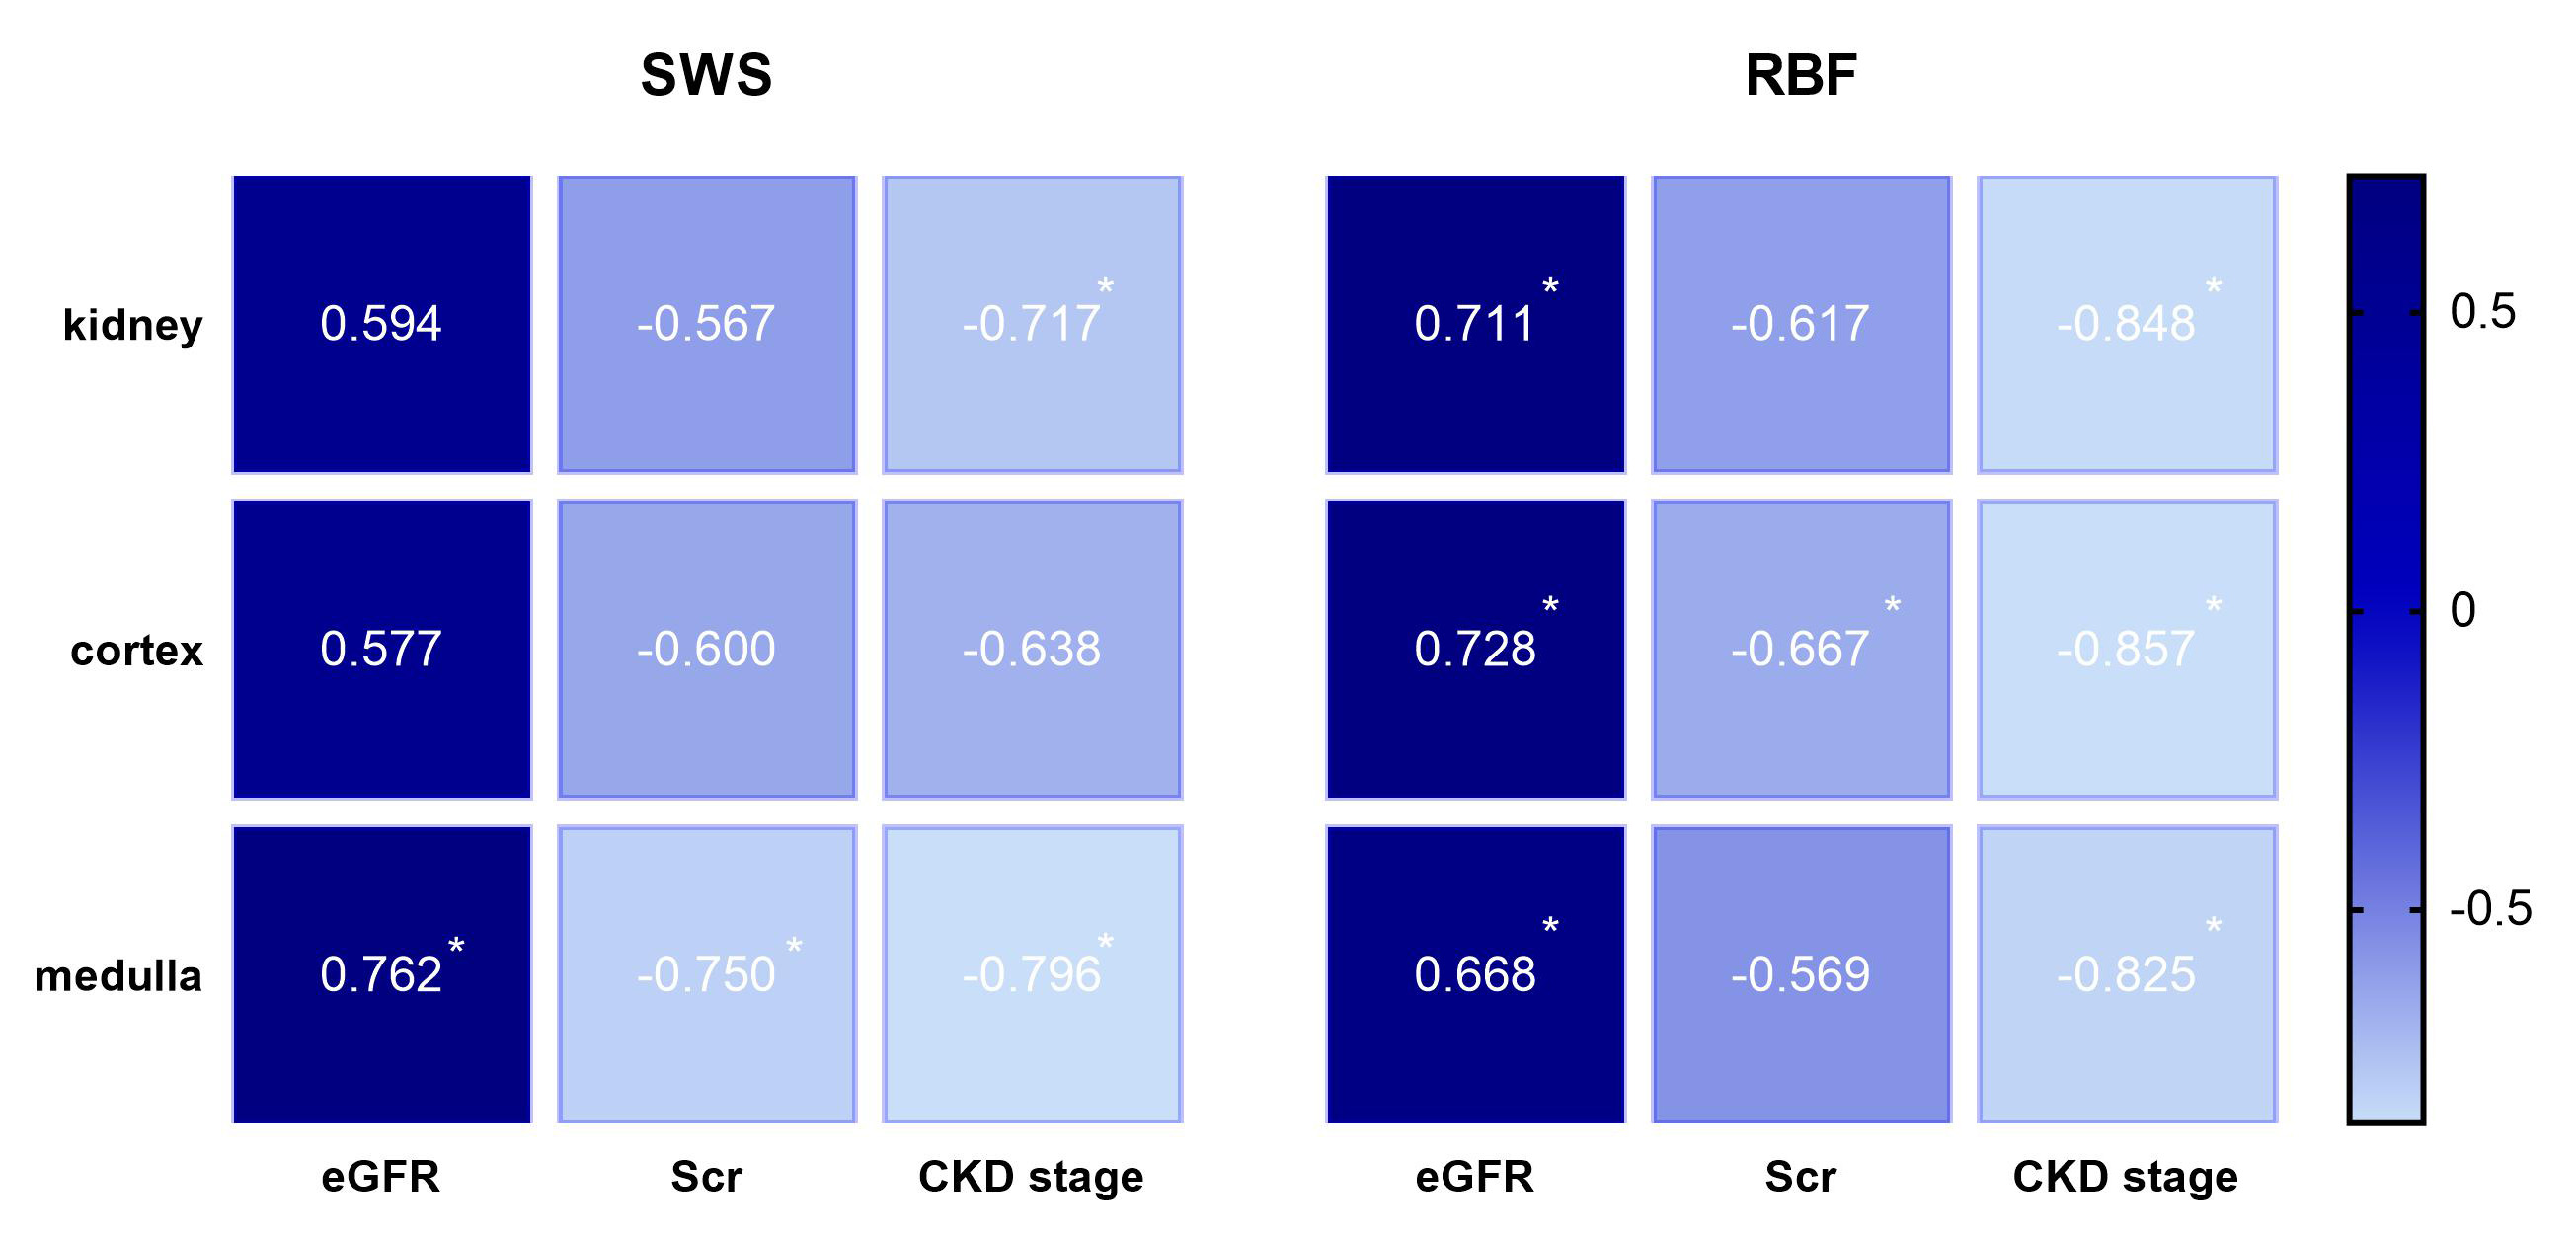
As depicted in Table 2, the paired-sample t-test revealed that SWS of the medulla was considerably lower than that of the cortex. The two-sample t-test revealed that the MRI parameters of the kidney in patients with CKD (SWS: whole kidney 2.43 ± 0.18 m/s, cortex 2.56 ± 0.20 m/s, and medulla 2.15 ± 0.15 m/s; RBF: cortex 151 ± 67 mL/min/100g) was lower than that in HVs (SWS: whole kidney 2.60 ± 0.10 m/s, cortex 2.80 ± 0.15 m/s, and medulla 2.31 ± 0.07 m/s; RBF: cortex 265 ± 61 mL/min/100g) (P =.030/.010/.014/.002). The area under the curve (AUC) of MRI parameters distinguishing different groups are illustrated in Figure 2. The relationship between clinical indicators and MRI parameters in patients with CKD were exhibited in Figure 3. The SWS of the unilateral kidney cortex (without distinguishing HVs from patients with CKD) was positively correlated with the RBF (r = 0.363, P = .030).Discussion and Conclusion
Both diagnostic techniques effectively distinguished HVs from patients with CKD. ASL slightly outperformed MRE, with higher combined diagnostic efficacy.Previous studies[3] have found that renal SWS is negatively correlated with the degree of renal fibrosis, which is consistent with this study, but contrary to the similar study on liver, it may be caused by the influence of perfusion on renal blood supply. The results showed that RBF of renal cortex was negatively correlated with the degree of renal fibrosis, and SWS of unilateral renal cortex was positively correlated with RBF, which further supported this hypothesis. In other words, the SWS in patients with CKD may be more significantly affected by perfusion than by fibrosis.
In summary, ASL and MRE demonstrated favorable diagnostic efficacy in distinguishing between HVs and patients with CKD, even have the potential to predict the stages of CKD. The combined diagnostic approach yielded even superior results. This preliminary study affirmed a positive correlation between renal stiffness values and renal perfusion capacity. Patients with CKD exhibited a reduction in SWS with the increase in the fibrotic degree, which was associated with their declining perfusion capacity. Hence, considering the influence of perfusion factors is essential when examining renal stiffness values in patients with CKD.
Acknowledgements
We thank Bingsheng Huang of Shenzhen University for his excellent help in data statistics. We thank Jing Guo of Humboldt University in Berlin, Germany for their excellent help in MRE post-processing and analysis.References
[1] Han JH, Ahn JH, Kim JS. Magnetic resonance elastography for evaluation of renal parenchyma in chronic kidney disease: a pilot study. Radiol Med. 2020 Dec;125(12):1209-1215.[2] Lu F, Yang J, Yang S, Bernd K, Fu C, Yang C, Xu H, Liu M, Zhan S, Wang C, Guo R, Wu Y. Use of Three-Dimensional Arterial Spin Labeling to Evaluate Renal Perfusion in Patients With Chronic Kidney Disease. J Magn Reson Imaging. 2021 Oct;54(4):1152-1163.
[3] Brown RS, Sun MRM, Stillman IE, Russell TL, Rosas SE, Wei JL. The utility of magnetic resonance imaging for noninvasive evaluation of diabetic nephropathy. Nephrol Dial Transplant. 2020 Jun 1;35(6):970-978.
[4] Korsmo MJ, Ebrahimi B, Eirin A, Woollard JR, Krier JD, Crane JA, Warner L, Glaser K, Grimm R, Ehman RL, Lerman LO. Magnetic resonance elastography noninvasively detects in vivo renal medullary fibrosis secondary to swine renal artery stenosis. Invest Radiol. 2013 Feb;48(2):61-8.
[5] Zou LQ, Chen J, Pan L, Jiang JZ, Xing W. Comparison of magnetic resonance elastography and diffusion-weighted imaging for staging hepatic fibrosis. Chin Med J (Engl). 2015 Mar 5;128(5):620-5.
[6] Meyer T, Marticorena Garcia S, Tzschätzsch H, et al. Comparison of inversion methods in MR elastography: An open-access pipeline for processing multifrequency shear-wave data and demonstration in a phantom, human kidneys, and brain [J]. Magn Reson Med, 2022, 88(4): 1840-50.
Figures