2756
MRE-derived Anisotropic Stiffness Estimation in Kidneys1The Ohio State University, Columbus, OH, United States
Synopsis
Keywords: Kidney, Kidney
Motivation: Magnetic Resonance Elastography (MRE) can determine tissue isotropic stiffness measurements to assess kidney disease and injury. Similarly, Diffusion Tensor Imaging (DTI) in combination with MRE can provide additional information regarding tissue health through anisotropic stiffness.
Goal(s): The goal of this study is to compute tissue isotropic and anisotropic stiffness of the cortex, medulla, and whole kidney to compare against both measurements.
Approach: 9 subjects were imaged for both MRE and DTI scans to estimate isotropic and anisotropic stiffness, respectively.
Results: Preliminary results indicate a good correlation between isotropic stiffness and anisotropic stiffness in all regions.
Impact: The application of MRI diffusion scans in conjunction with MRE shows promise in elucidating hard to detect disease and injury in human kidney.
Introduction
Kidney disease can be a debilitating health concern that requires difficult, lengthy, and potentially painful diagnosis. Kidney diseases, including Lupus Nephritis, may progress into renal fibrosis1,2. Through an increase in the extracellular matrix and decreasing number of tubules, renal fibrosis increases the stiffness and alters other tissue properties of the kidney3. Occurrence and progression of disease and injury can be assessed through these tissue properties, specifically tissue stiffness. Existing techniques for assessing kidney disease and subsequent renal fibrosis often involve invasive procedures. A non-intrusive and painless alternative is Magnetic Resonance Elastography (MRE). MRE is an MRI-based method that utilizes externally applied mechanical waves to generate stiffness maps of the imaged tissue. Isotropic stiffness estimates of the kidney using MRE have been conducted in healthy particpants4. Researchers have previously used MRE and diffusion tensor imaging (DTI) to assess anisotropic stiffness estimates in the brain and skeletal muscle5,6. MRE and DTI can be used as an effective biomarker for diagnosing kidney diseases based on anisotropic stiffness estimates. The aim of this study is to compute and compare tissue isotropic and anisotropic stiffnesses of the cortex, medulla, and whole kidney.Methods
All imaging was performed using a 3T MRI scanner (Prisma, Siemens Healthcare, Erlangen, Germany). Nine normal subjects were scanned after obtaining written informed consent. Coronal slices were obtained using a spin-echo echo planar (SE-EPI) MRE sequence. 60 Hz vibrations were introduced in the kidneys using two soft passive drivers that were placed on the participants lower back, positioned at the locations of the kidneys. MRE imaging parameters include: FOV = 500x500mm, matrix size = 256x256, TR = 1400ms, TE = 44ms, slice thickness = 3mm, slices = 14, MRE phase offsets = 4. DTI was performed using SE-EPI sequence in six directions. DTI imaging parameters included: FOV = 500x500mm, matrix size = 256x256, TR = 1800ms, TE = 38ms, slice thickness = 3mm, slices = 14, b values of 0 s/mm2 and 500 s/mm2. Total scan time was ~35 minutes. MRE images were masked to obtain each of the kidneys. Wave images were filtered using 4th order Butterworth bandpass filter in 8 directions to remove the longitudinal and reflected waves. Local frequency estimation (LFE) processing was then performed to obtain weighted isotropic stiffness maps. The DTI images were processed using FSL to obtain fiber direction. An Orthotropic anisotropic inversion was performed to determine to determine longitudinal (C11, C22, C33) and transverse (C44, C55, C66) component of stiffness measurements along and across the fibers obtained using DTI as described previously7,8. Three ROI’s of the cortex, medulla, and entire (whole) kidney for both kidneys were drawn to report the mean isotropic and anisotropic stiffness measurements along with the standard deviation.Results
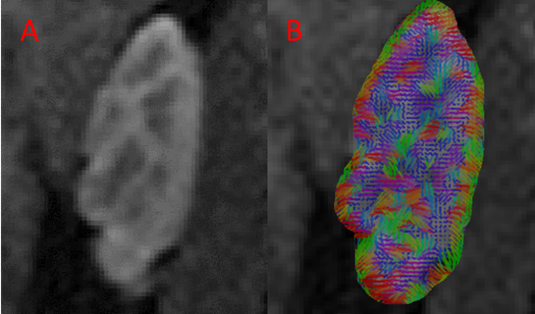
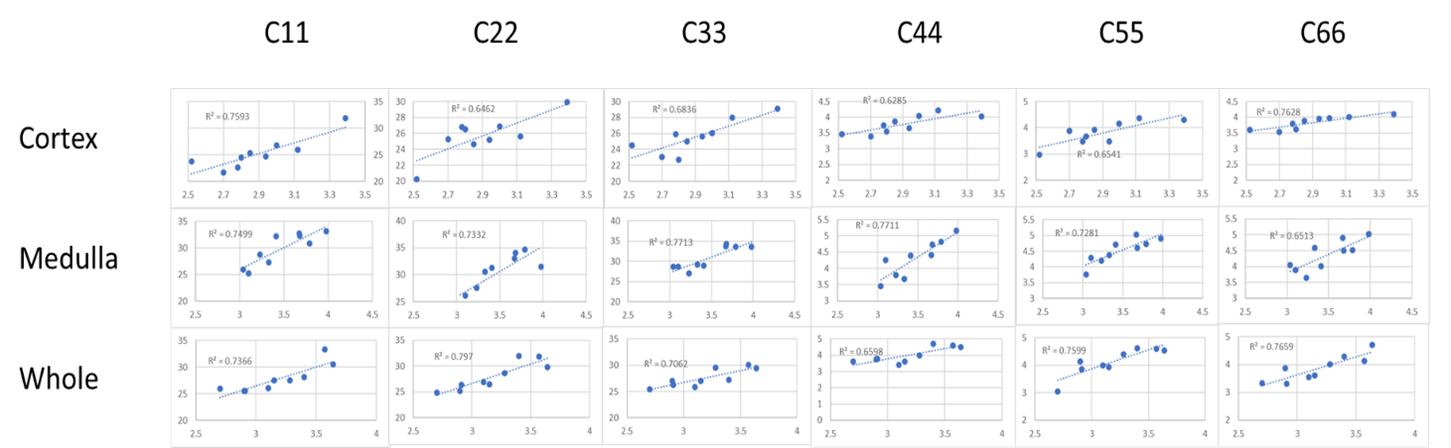
Table 1 shows the mean and standard deviation measurements of MRE-derived stiffness values and the C11, C22, C33, C44, C55, and C66 anisotropic stiffness calculated values for the whole kidney, cortex, and medulla. Figure 1 shows a magnitude image of the kidneys, wave images in all three directions, a corresponding isotropic stiffness map. The MRE stiffness map shows an example of the whole kidney (left side) and medulla (right side), distinguished by the red contour line to designate the boundaries of the whole kidney and the medulla-cortex. Figure 2 shows a diffusion magnitude image of the kidneys, the magnitude of the principal eigenvector, and the principal eigenvector overlaid on the magnitude image. The magnitude image with the overlaid eigenvectors shows a clearly discernable line around the kidney’s cortex and the medulla. Figure 3 shows correlation plots between MRE-derived isotropic stiffness values and DTI-derived anisotropic stiffness values. Table 2 shows the r-squared values from the correlation plots in Figure 3.Discussion
This study showed good correlations between DTI-derived anisotropic stiffness and MRE-derived isotropic stiffness measurements. Future studies are further warranted in different kidney diseases which alters the structure of the kidney, where anisotropic stiffness can provide additional information for appropriate diagnosis and prognosis.Acknowledgements
Acknowledgement: This work was supported by NIH R01AR075062References
1. Jaryal A, Vikrant S. Current status of lupus nephritis. Indian J Med Res. 2017 Feb;145(2):167-178. doi: 10.4103/ijmr.IJMR_163_16. PMID: 28639592; PMCID: PMC5501048.
2. Kaimori JY, Isaka Y, Hatanaka M, Yamamoto S, Ichimaru N, Fujikawa A, Shibata H, Fujimori A, Miyoshi S, Yokawa T, Kuroda K, Moriyama T, Rakugi H, Takahara S. Visualization of kidney fibrosis in diabetic nephropathy by long diffusion tensor imaging MRI with spin-echo sequence. Sci Rep. 2017 Jul 18;7(1):5731. doi: 10.1038/s41598-017-06111-4. PMID: 28720778; PMCID: PMC5515876.
3. Leung G, Kirpalani A, Szeto SG, Deeb M, Foltz W, Simmons CA, Yuen DA. Could MRI Be Used To Image Kidney Fibrosis? A Review of Recent Advances and Remaining Barriers. Clin J Am Soc Nephrol. 2017 Jun 7;12(6):1019-1028. doi: 10.2215/CJN.07900716. Epub 2017 Mar 15. PMID: 28298435; PMCID: PMC5460707.
4. Rouvière O, Souchon R, Pagnoux G, Ménager JM, Chapelon JY. Magnetic resonance elastography of the kidneys: feasibility and reproducibility in young healthy adults. J Magn Reson Imaging. 2011 Oct;34(4):880-6. doi: 10.1002/jmri.22670. Epub 2011 Jul 18. PMID: 21769970; PMCID: PMC3176985.
5. Kalra P, Raterman B, Mo X, Kolipaka A. Magnetic resonance elastography of brain: Comparison between anisotropic and isotropic stiffness and its correlation to age. Magn Reson Med. 2019 Aug;82(2):671-679. doi: 10.1002/mrm.27757. Epub 2019 Apr 8. PMID: 30957304; PMCID: PMC6510588.
6. Green MA, Geng G, Qin E, Sinkus R, Gandevia SC, Bilston LE. Measuring anisotropic muscle stiffness properties using elastography. NMR Biomed. 2013 Nov;26(11):1387-94. doi: 10.1002/nbm.2964. Epub 2013 May 3. PMID: 23640745.
Figures