2755
The effect of fasting on renal phase contrast and arterial spin labelling1Leeds Institute of Cardiovascular and Metabolic Medicine, University of Leeds, Leeds, United Kingdom, 2Leeds Teaching Hospitals NHS Trust, Leeds, United Kingdom, 3Antaros Medical AB, Mölndal, Sweden, 4The University of Sheffield, Sheffield, United Kingdom
Synopsis
Keywords: Kidney, Kidney, Renal blood flow, Perfusion, Phase contrast, Arterial spin labelling
Motivation: Variations in dietary conditions can impact renal blood flow (RBF), but it is currently unknown whether fasting overnight can affect the measurement. A recent consensus for phase contrast (PC) advises against fasting, but similar consensus for arterial spin labelling (ASL) was not reached. Other laboratory tests might require fasting, leading to variability in preparation for MRI. It is therefore critical to understand whether fasting affects the measurement
Goal(s): This study investigates the effect of fasting compared to the recommended MRI preparation.
Approach: ASL and PC acquired in healthy volunteers.
Results: No significant difference between fasting and consensus-preparation was found for RBF and perfusion.
Impact: A strict control for diet may not be required for MRI studies measuring renal blood flow and perfusion using phase contrast and arterial spin labelling.
Introduction
Alterations in renal blood circulation following dietary intake is well-documented. Renal blood flow (RBF) has been found to increase following a large protein meal, or in response to high sodium diet1,2. A reduction in glomerular filtration rate (GFR) has previously been reported using radioisotopes in healthy volunteers following overnight fasting3. It is therefore expected that variations in dietary conditions can impact the interpretation of renal MRI flow and perfusion measures.Despite the well-known effect of diet on RBF, studies conducted to date involved variable preparation before MRI, where fasting was employed in some but was not required in others4,5. The recommendation for phase contrast (PC) advises against fasting but recommends that subjects avoid salt and protein-rich meals, as these are well-known confounders of RBF measurements6. The consensus-based recommendations for renal arterial spin labelling (ASL), on the other hand, highlight a lack of agreement on the need to control for diet7. Moreover, in clinical practice or in trials considerations beyond MRI may enforce a controlled diet, such as requirements of blood tests performed on the same clinic visit.
Clearly there is a need for more data to determine to what extent dietary control affects PC- and ASL-based measurements. This question was addressed using a case-control study comparing the effect of fasting against the recommended MRI preparation.
Methods
Study design: 16 healthy volunteers (8 males, mean age 30 years) underwent two scans on different days. One scan was performed after an overnight fast in which food and drinks were not allowed except for water. For the other scan participants followed the consensus-preparation, where fasting was not required while avoiding salt- and protein-rich meals. The preparation order was not fixed, and the two visits were 1-2 weeks apart. A blood sample was taken on each visit for the measurement of insulin, glucose, and estimated GFR (eGFR).Acquisition: MRI was acquired at 3 T Magnetom Prisma (Siemens Healthcare GmbH, Germany)8. PC was acquired in free breathing with ECG-triggering using 2D gradient-echo; FOV: 350x241 mm; TR 40.48 ms; TE 2.74 ms; FA 25º; voxel-size 0.6×0.6×6 mm3; velocity encoding 120 cm/sec. Pseudo-continuous ASL (pCASL) was acquired in free breathing with 3D TGSE readout; FOV 300x150 mm; TR 5000 ms; TE 19.28 ms; pCASL FA 28º; voxel-size 4.7×4.7×5 mm3; labelling duration 1500 ms; post-labelling delay 1500 ms.
Post-processing: PC was analysed in Syngo.via (Siemens Healthcare), using semi-automatic segmentation of the renal artery to extract RBF (Figure 1). Total RBF was normalised to body-surface-area9. ASL was analysed in PMI software10, with threshold-based selection of renal parenchyma on the perfusion map (Figure 2). The mean voxel value was extracted to obtain renal parenchymal perfusion (RP) averaged for the right and left kidneys.
Statistics: RP heterogeneity was calculated as (standard deviation/mean of all voxels in the parenchyma) and used to investigate the impact of global scaling. Paired t-tests and Pearson correlation were used to analyse differences and associations between fasting and consensus-preparation, with significance-level p<0.05.
Results
Insulin and glucose were significantly lower in the fasted state, but eGFR was stable between the two visits (Figure 3). Comparing fasting and consensus-preparations showed no significant difference on PC-RBF (mean± 95%CI 756± 109 vs 741± 98 ml/min/1.73m2, p=0.49) and RP (225± 43 vs 232± 38 ml/min/100ml, p=0.70). There were significant correlations between fasting and consensus-preparations, which was stronger for RBF (r= 0.92, p<0.001) compared to RP (r=0.53, p=0.034). Bland-Altman plots (Figure 4) confirm no systematic bias between preparations, but large limits-of-agreement (–89%, 81%) in measurements of renal RP indicate subject-specific differences.The differences in RBF and RP between preparations were not associated with differences in insulin (Figure 5). RP heterogeneity showed significant increase (10%) following fasting preparation (0.21± 0.02 vs 0.19± 0.01, p=0.029).
Discussion
The results indicate that fasting is not a major confounder of PC and ASL. The difference in insulin is consistent with the effect of fasting and confirms compliance with the visit instruction. The lack of association between changes in insulin and MRI parameters indicate that factors other than physiological variations account for the observed individual differences. The poor agreement in ASL is driven by measurement error due to ineffective labelling11. The increase in RP heterogeneity suggests that fasting leads to less uniform distribution in RP between cortex and medulla. However, the difference is small and within the precision limits of MRI measures.Conclusion
Overnight fasting had no systematic impact on average MRI measurements of RBF and RP in healthy volunteers. This indicates no strong rationale to control for diet in the preparation for MRI-based measurement of RBF or RP.Acknowledgements
Bashair Alhummiany is funded by Taibah University, Saudi Arabia.
Kanishka Sharma, and Steven Sourbron are supported by the BEAT-DKD project funded by the Innovative Medicines Initiative 2 Joint Undertaking under grant agreement No 115974. The JU receives support from the European Union’s Horizon 2020 research and innovation programme and EFPIA and JDRF. Any dissemination of results reflects only the author's view; the JU is not responsible for any use that may be made of the information it contains.
References
1. Simon AH, Lima PR, Almerinda M, et al. Renal haemodynamic responses to a chicken or beef meal in normal individuals. Nephrology Dialysis Transplantation. 1998;13(9):2261–4.
2. Pruijm M, Hofmann L, Maillard M, et al. Effect of Sodium Loading/Depletion on Renal Oxygenation in Young Normotensive and Hypertensive Men. Hypertension. 2010;55(5):1116–22.
3. Telford T, Keane DF, Garner AE, et al. Assessing the impact of inadequate hydration on isotope-GFR measurement. Scand J Clin Lab Invest. 2019;79(1–2):86–90.
4. Prasad P V, Li L-P, Thacker JM, et al. Cortical Perfusion and Tubular Function as Evaluated by Magnetic Resonance Imaging Correlates with Annual Loss in Renal Function in Moderate Chronic Kidney Disease. Am J Nephrol. 2019;49(2):114–24.
5. de Boer A, Harteveld AA, Stemkens B, et al. Multiparametric Renal MRI: An Intrasubject Test–Retest Repeatability Study. Journal of Magnetic Resonance Imaging. 2020;
6. de Boer A, Villa G, Bane O, et al. Consensus-Based Technical Recommendations for Clinical Translation of Renal Phase Contrast MRI. Journal of Magnetic Resonance Imaging. 2020;55(2):323–35.
7. Nery F, Buchanan CE, Harteveld AA, et al. Consensus-based technical recommendations for clinical translation of renal ASL MRI. MAGMA. 2020;33(1):141–61.
8. Gooding KM, Lienczewski C, Papale M, et al. Prognostic Imaging Biomarkers for Diabetic Kidney Disease (iBEAt): Study protocol. BMC Nephrol. 2020;21(242):1–11.
9. Du Bois D, Du Bois EF. Clinical Calorimetry: Tenth paper a formula to estimate the approximate surface area if height and weight be known. Arch Intern Med. 1916;XVII(6_2):863–71.
10. Sourbron S. plaresmedima/PMI-0.4-SUGAR: Outcomes. 2020; Available from: https://zenodo.org/record/4086055
11. Alhummiany BA, Shelley D, Saysell M, et al. Bias and Precision in Magnetic Resonance Imaging‐Based Estimates of Renal Blood Flow: Assessment by Triangulation. Journal of Magnetic Resonance Imaging. 2022;55(4):1241–50.
Figures
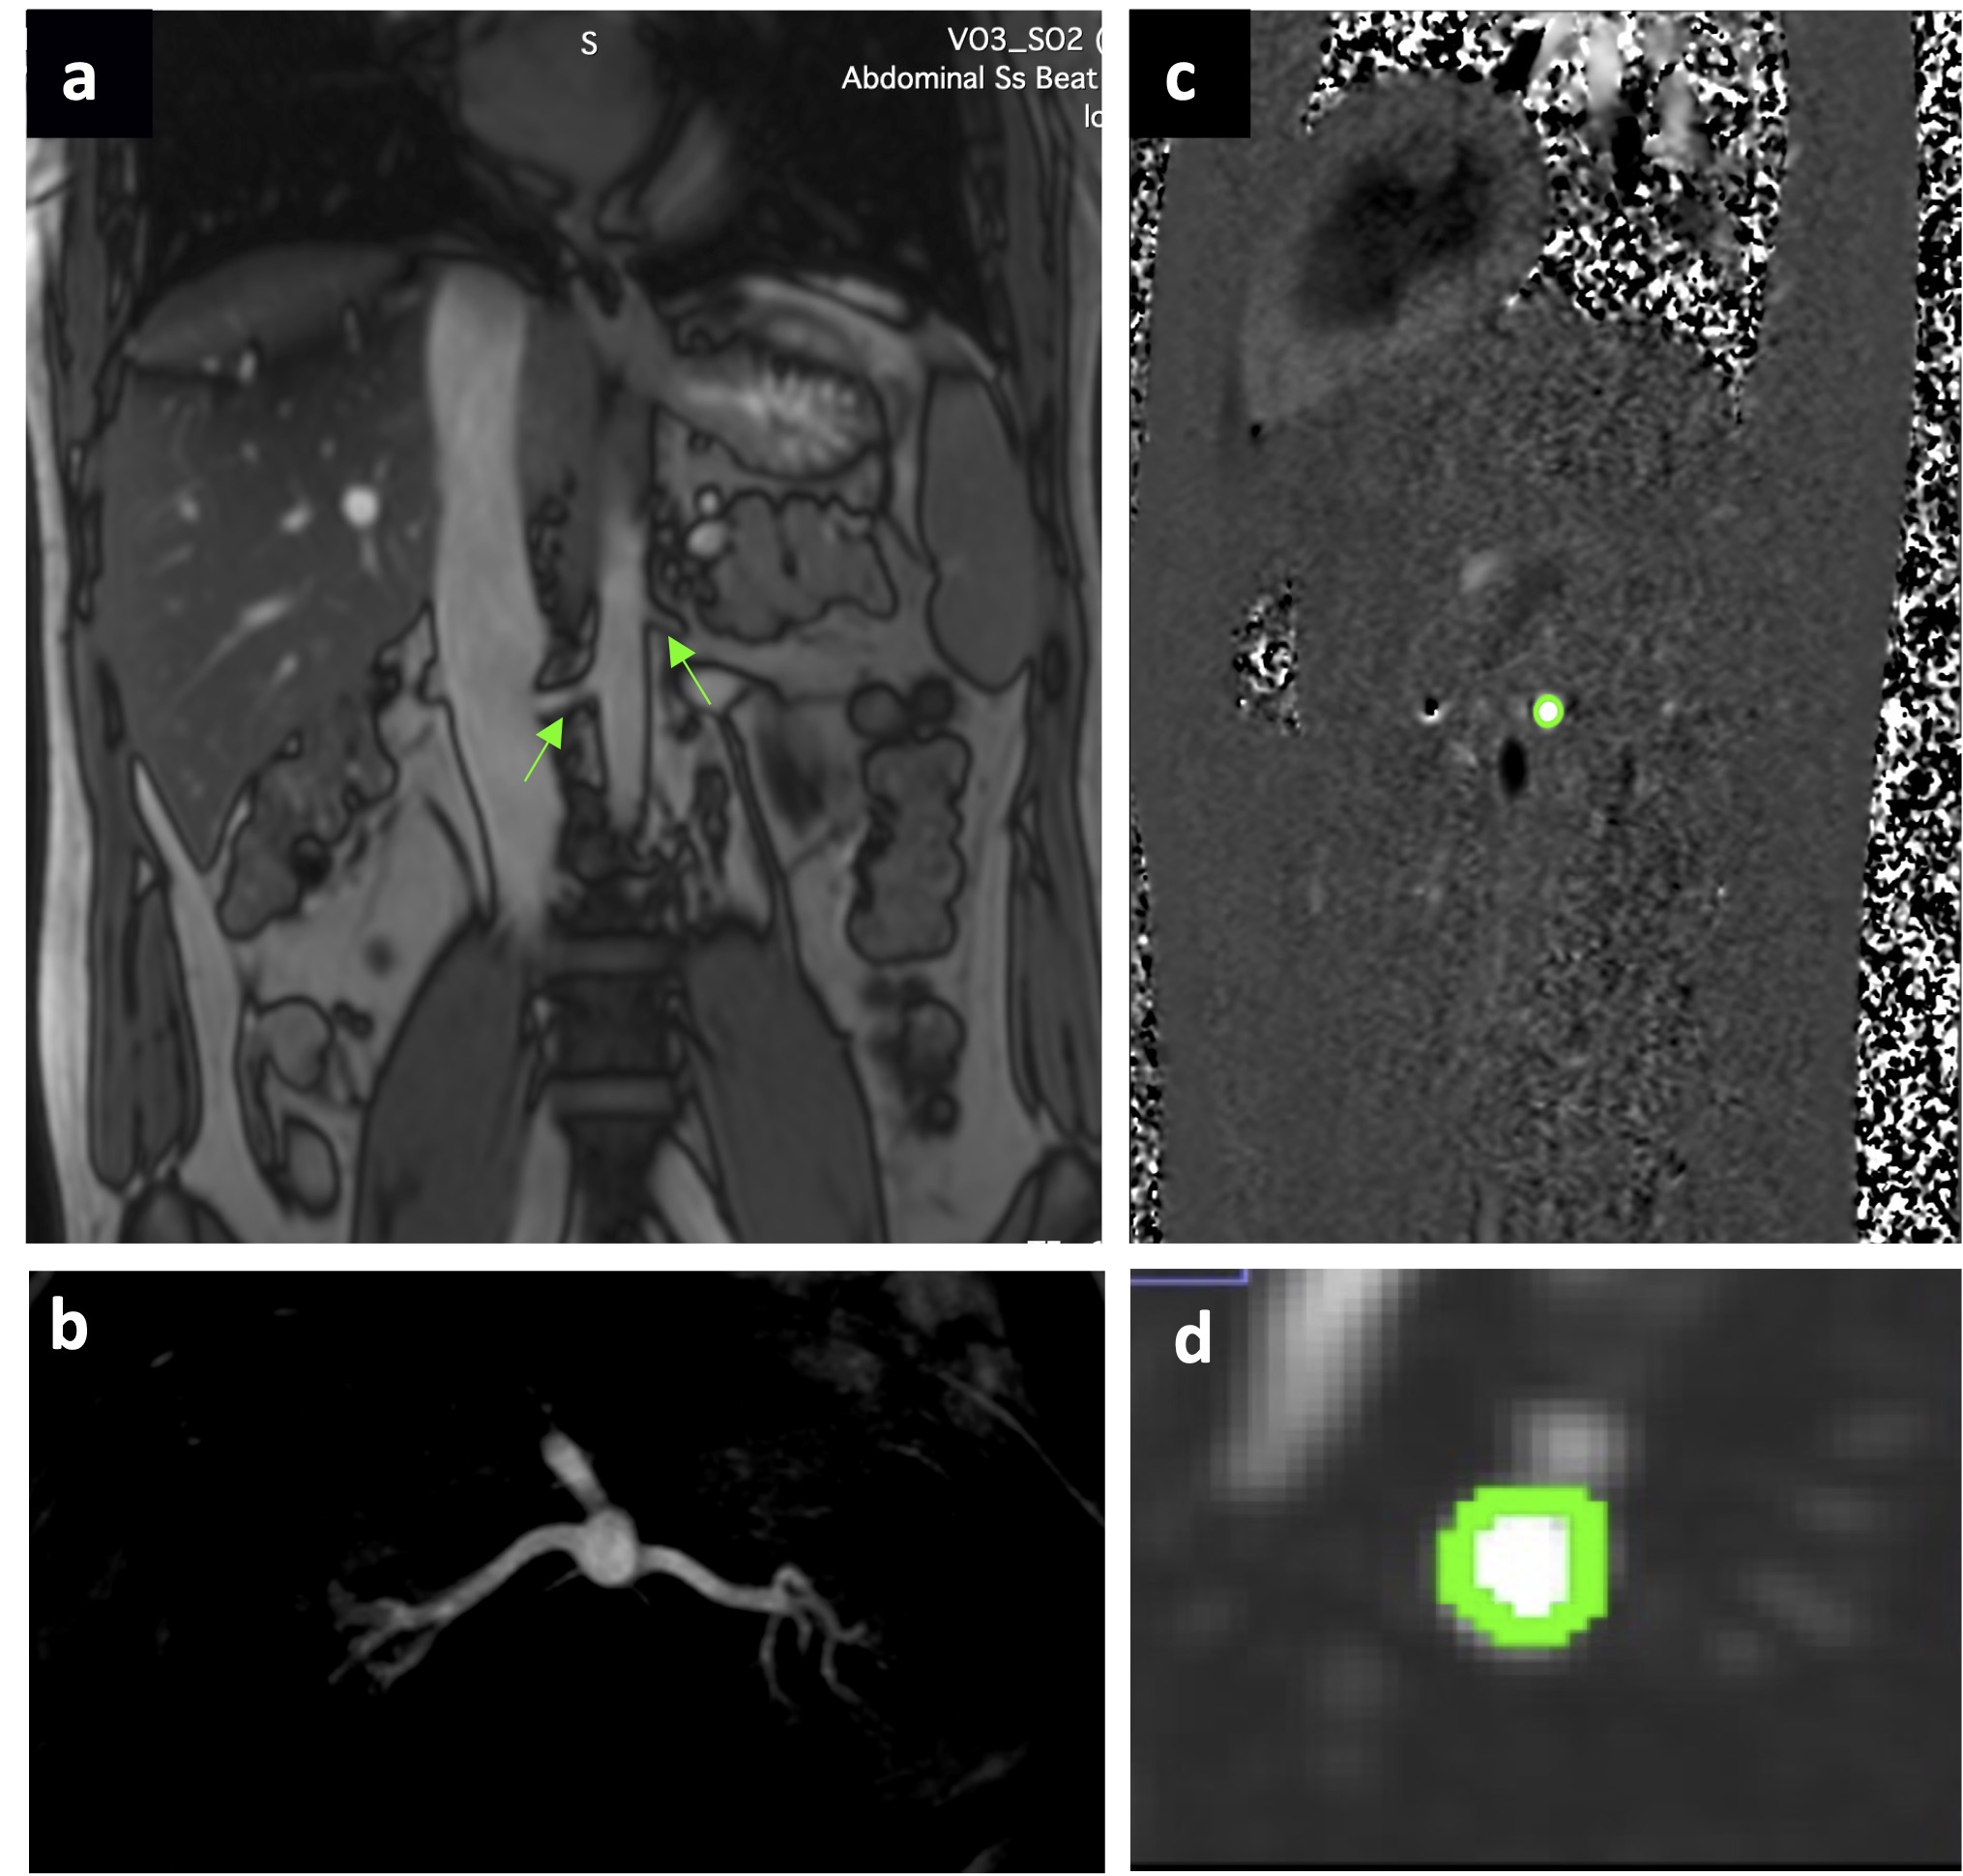
Figure 1 (a) Coronal image of survey scan used to enable the identification of the renal arteries (arrows); (b) Non-contrast MR angiography acquired at the level of the renal arteries; (c) Phase contrast image of the left renal artery; (d) a magnified view showing ROI selection to segment the left renal artery.
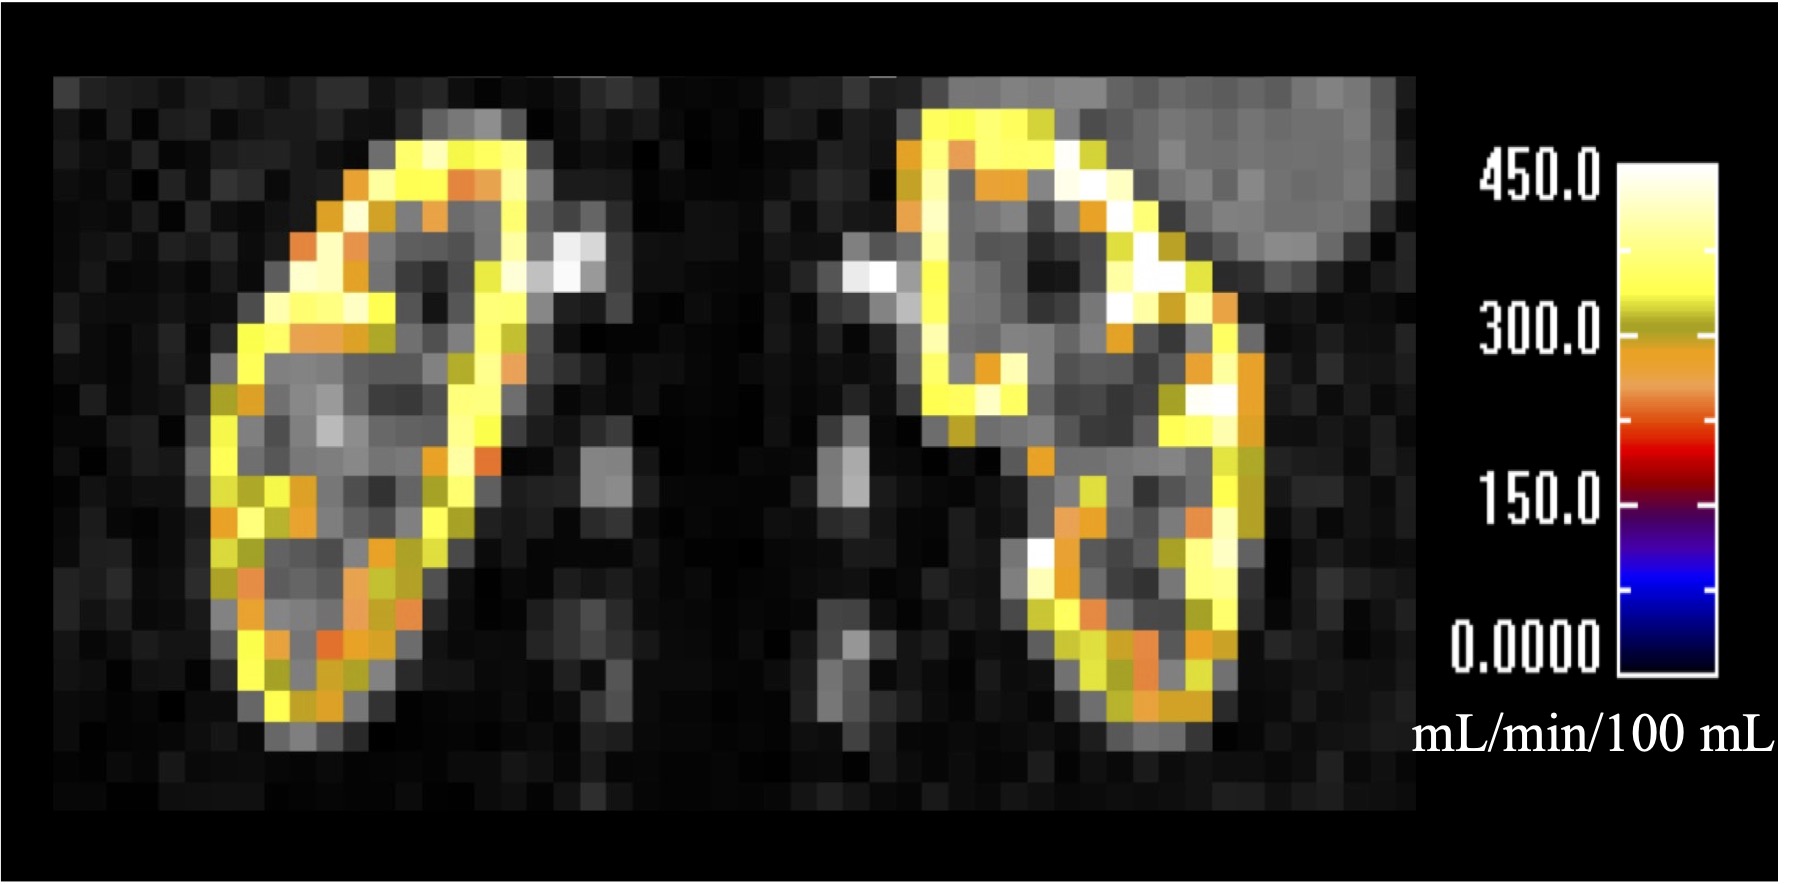
Figure 2 Arterial spin labelling perfusion image with coloured voxels representing ROI selection to segment the renal parenchyma.
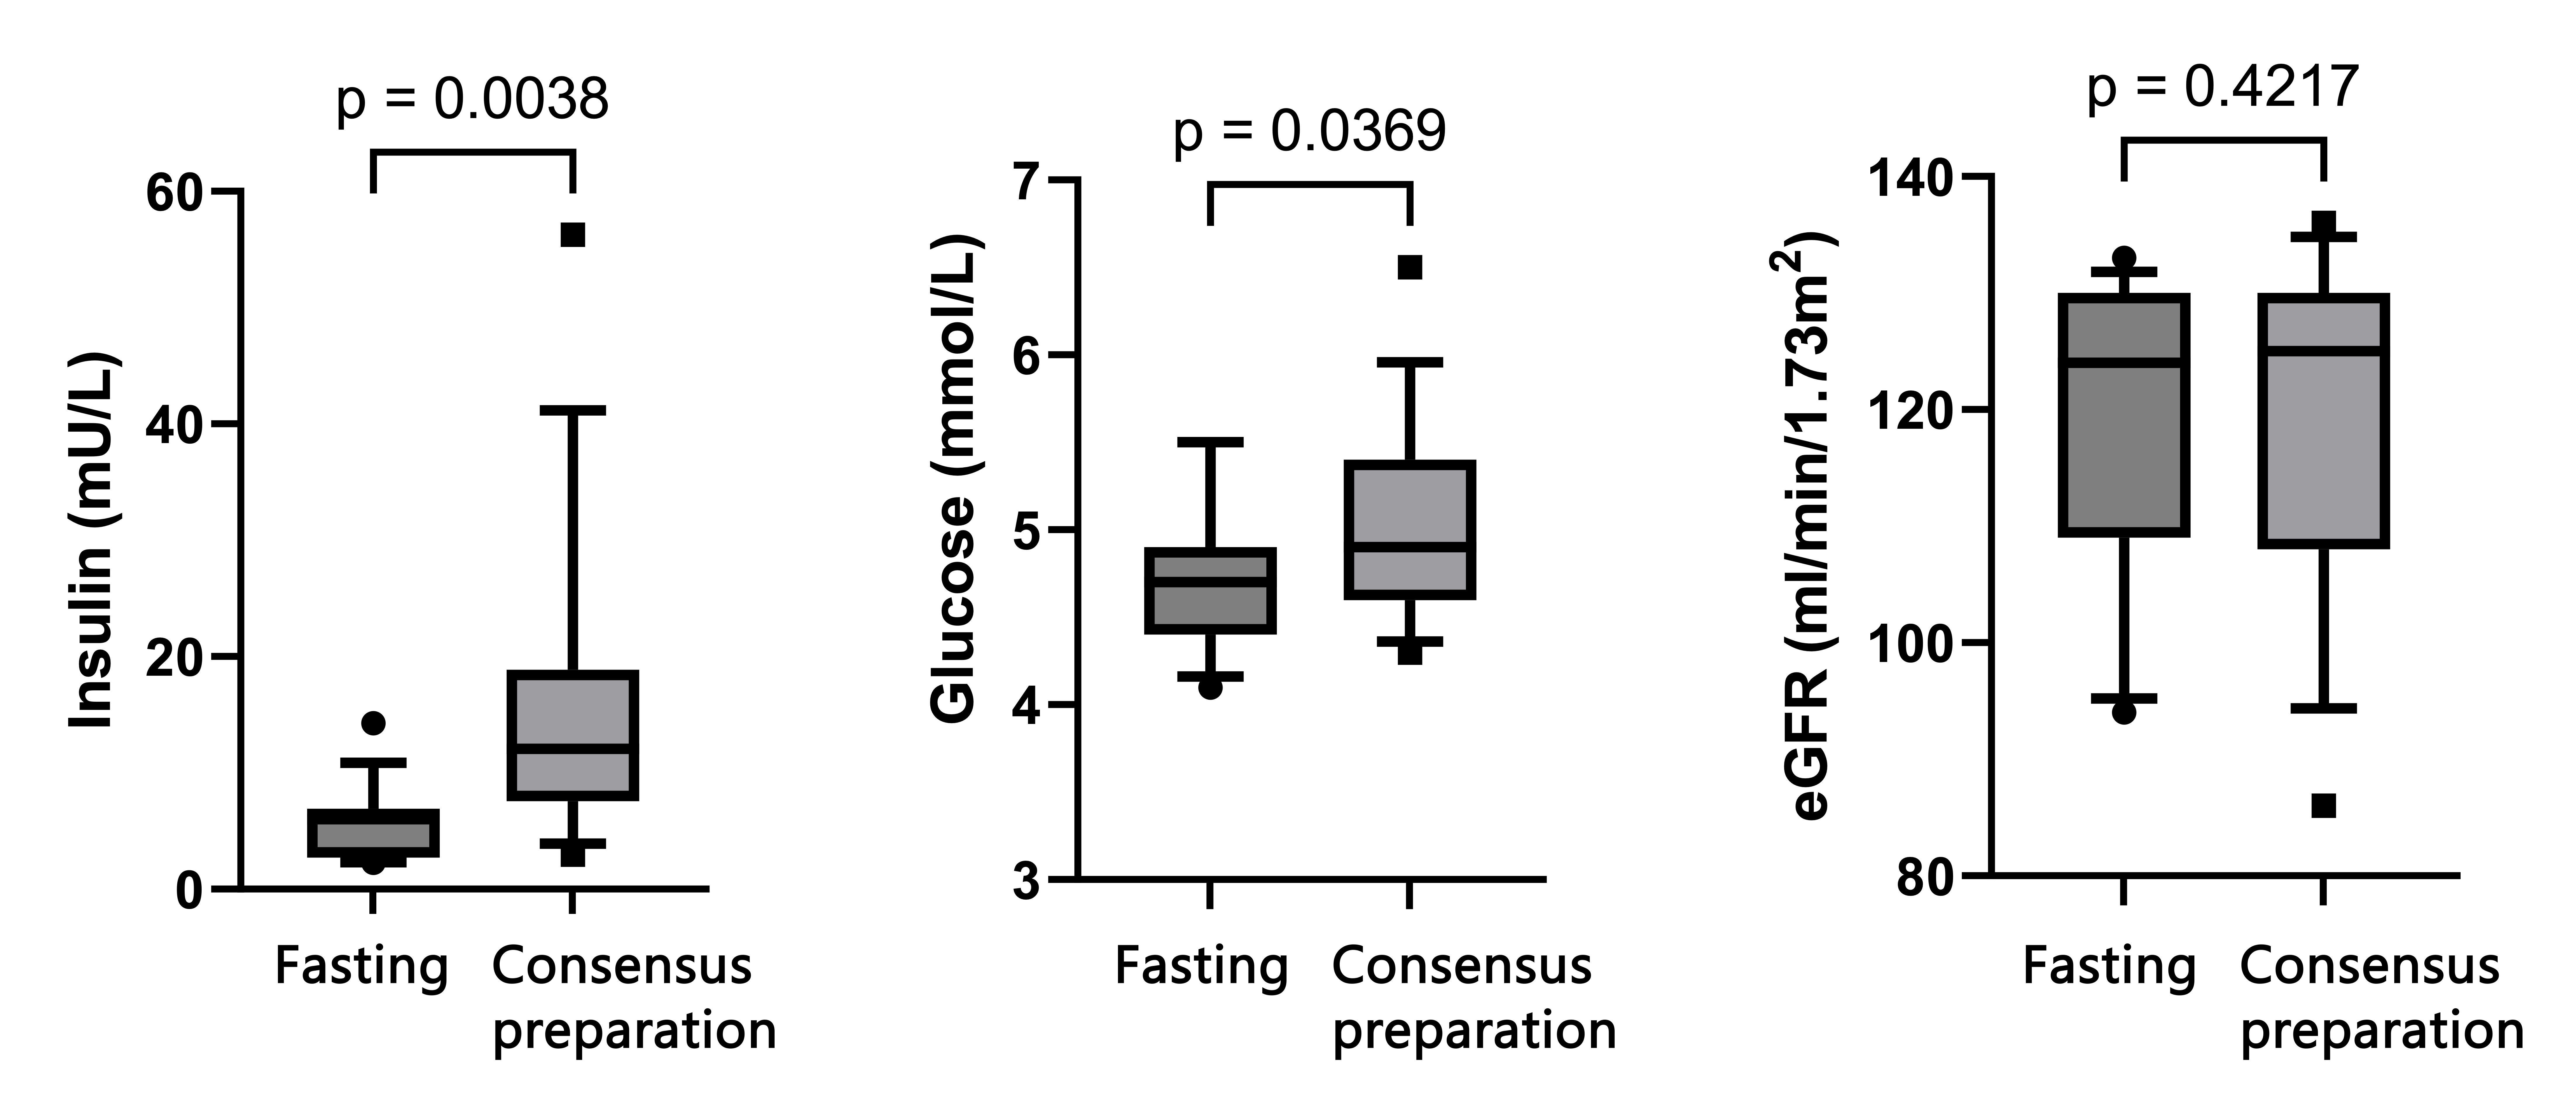
Figure 3 Box plots of serum markers measured following fasting and consensus preparations.
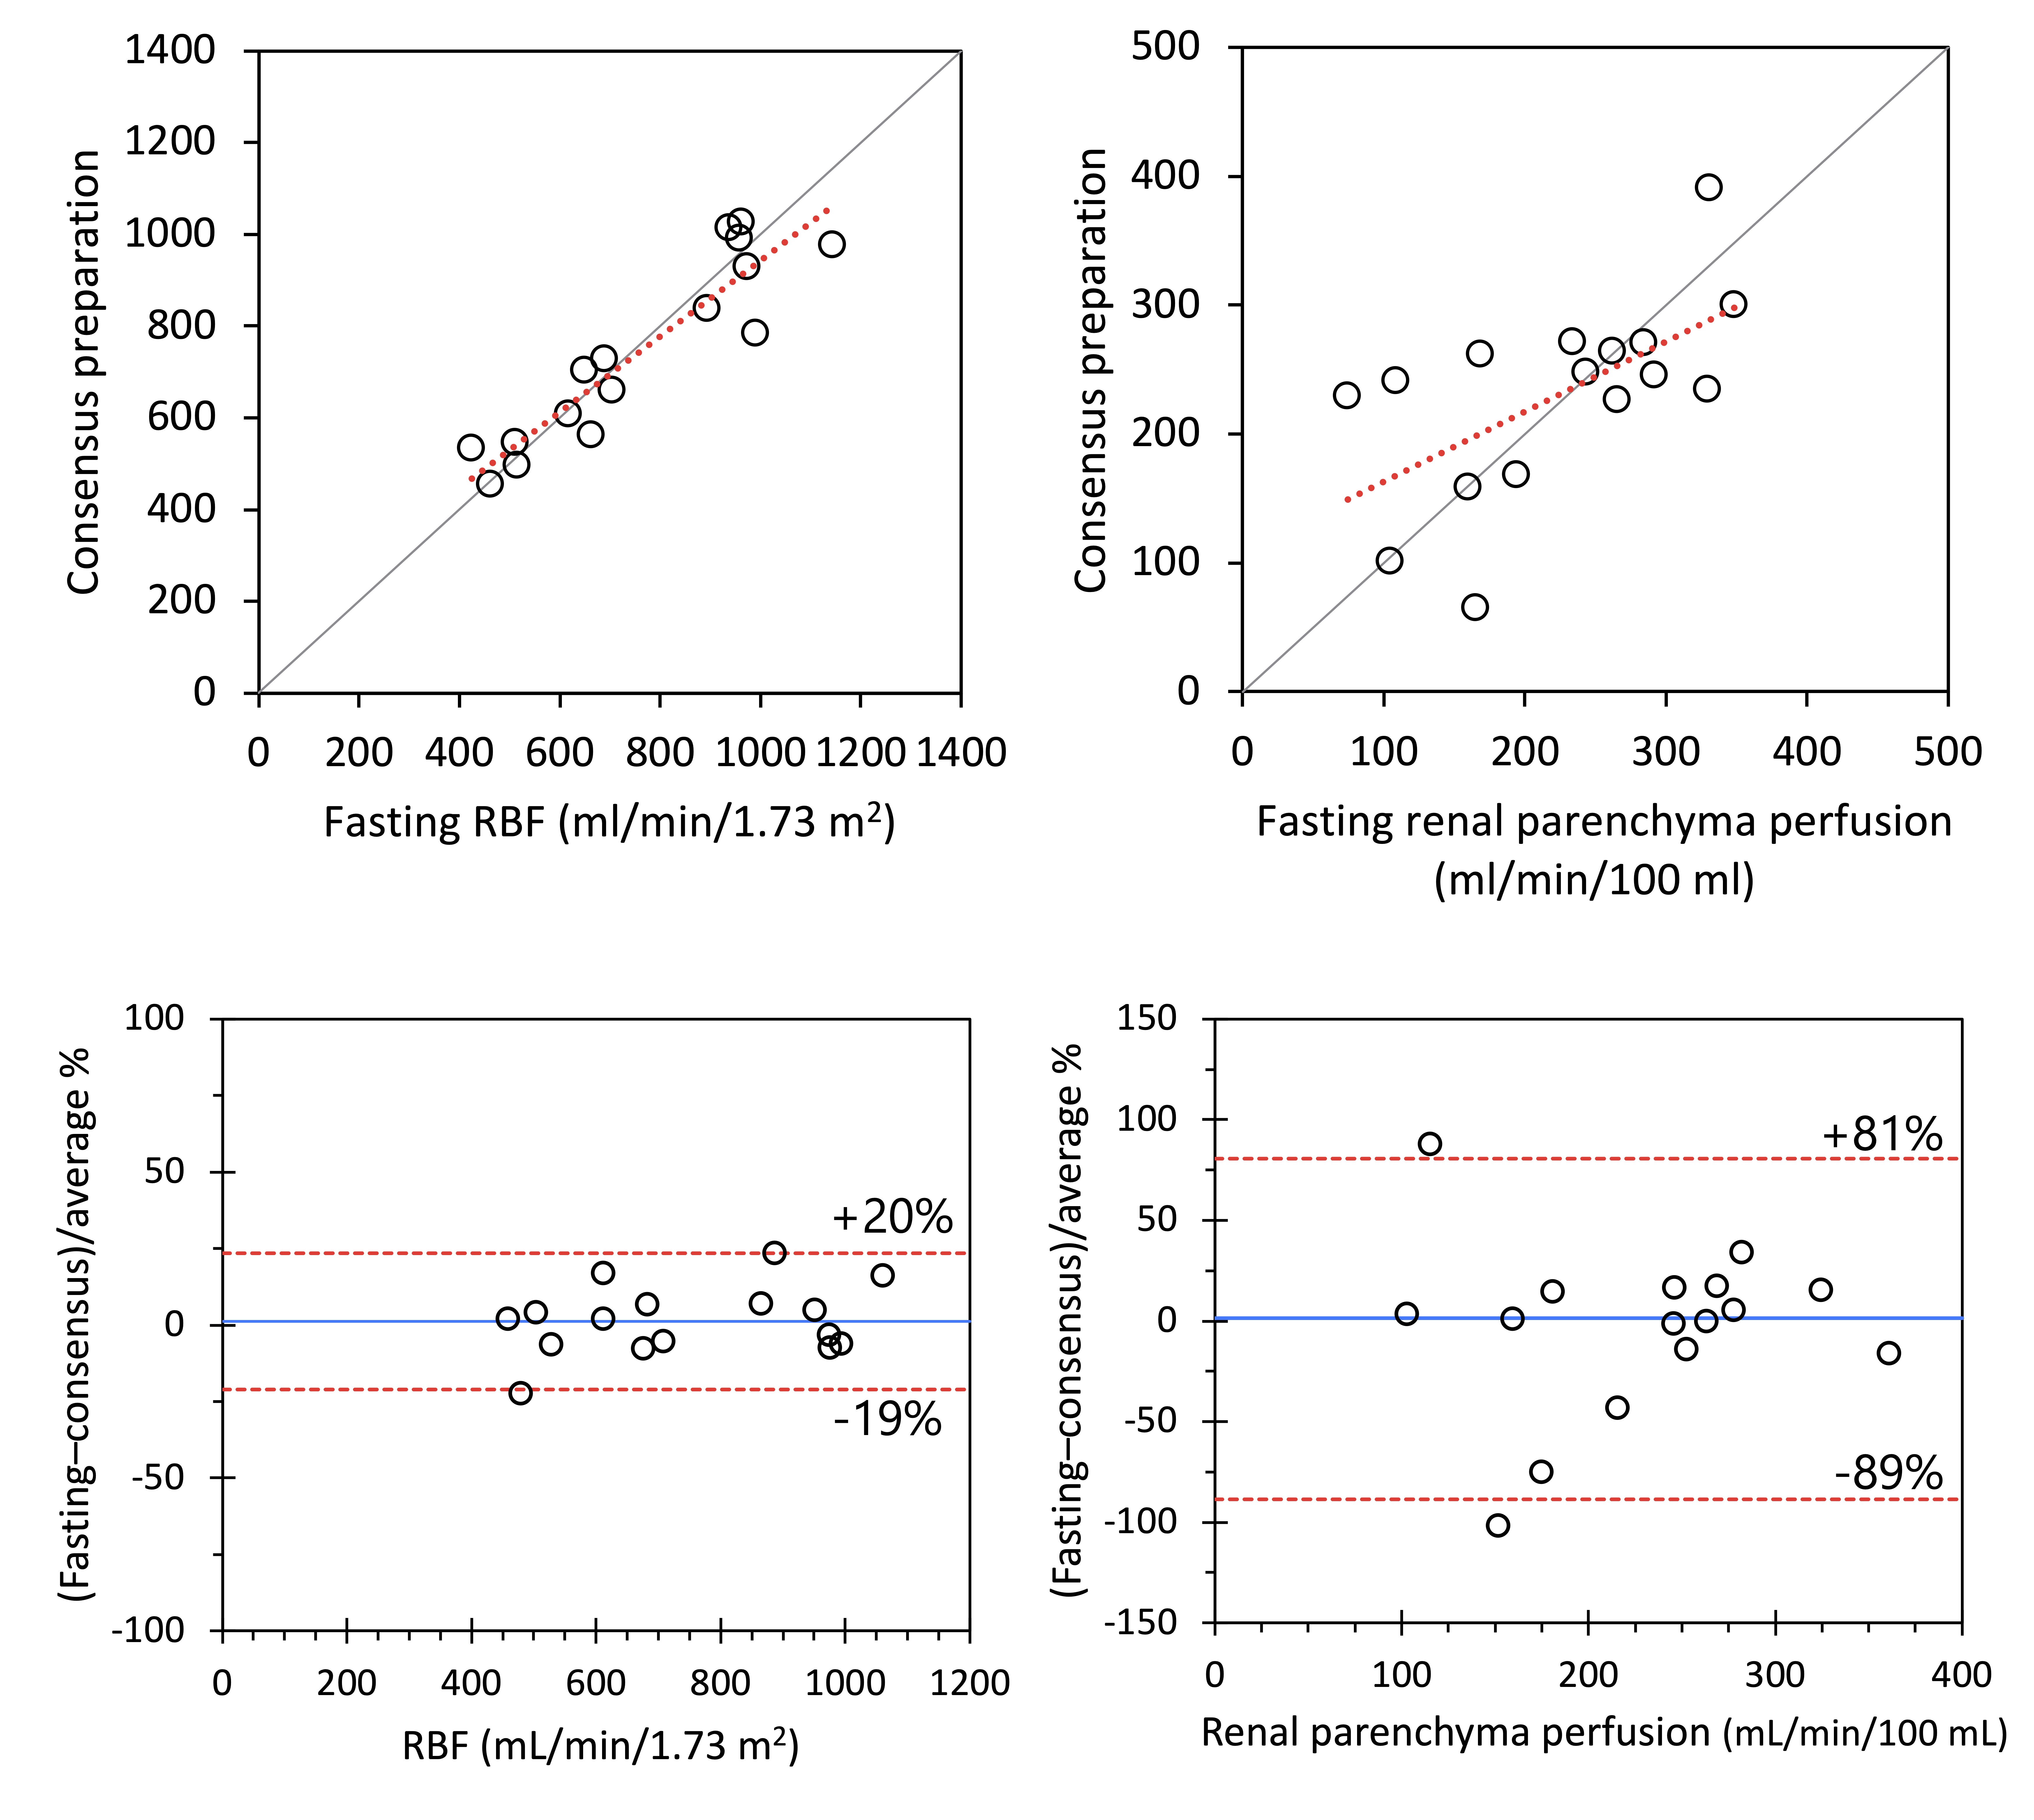
Figure 4 Renal MRI flow measurements comparing fasting and consensus preparations using scatter plots (top) and Bland-Altman plots (bottom).
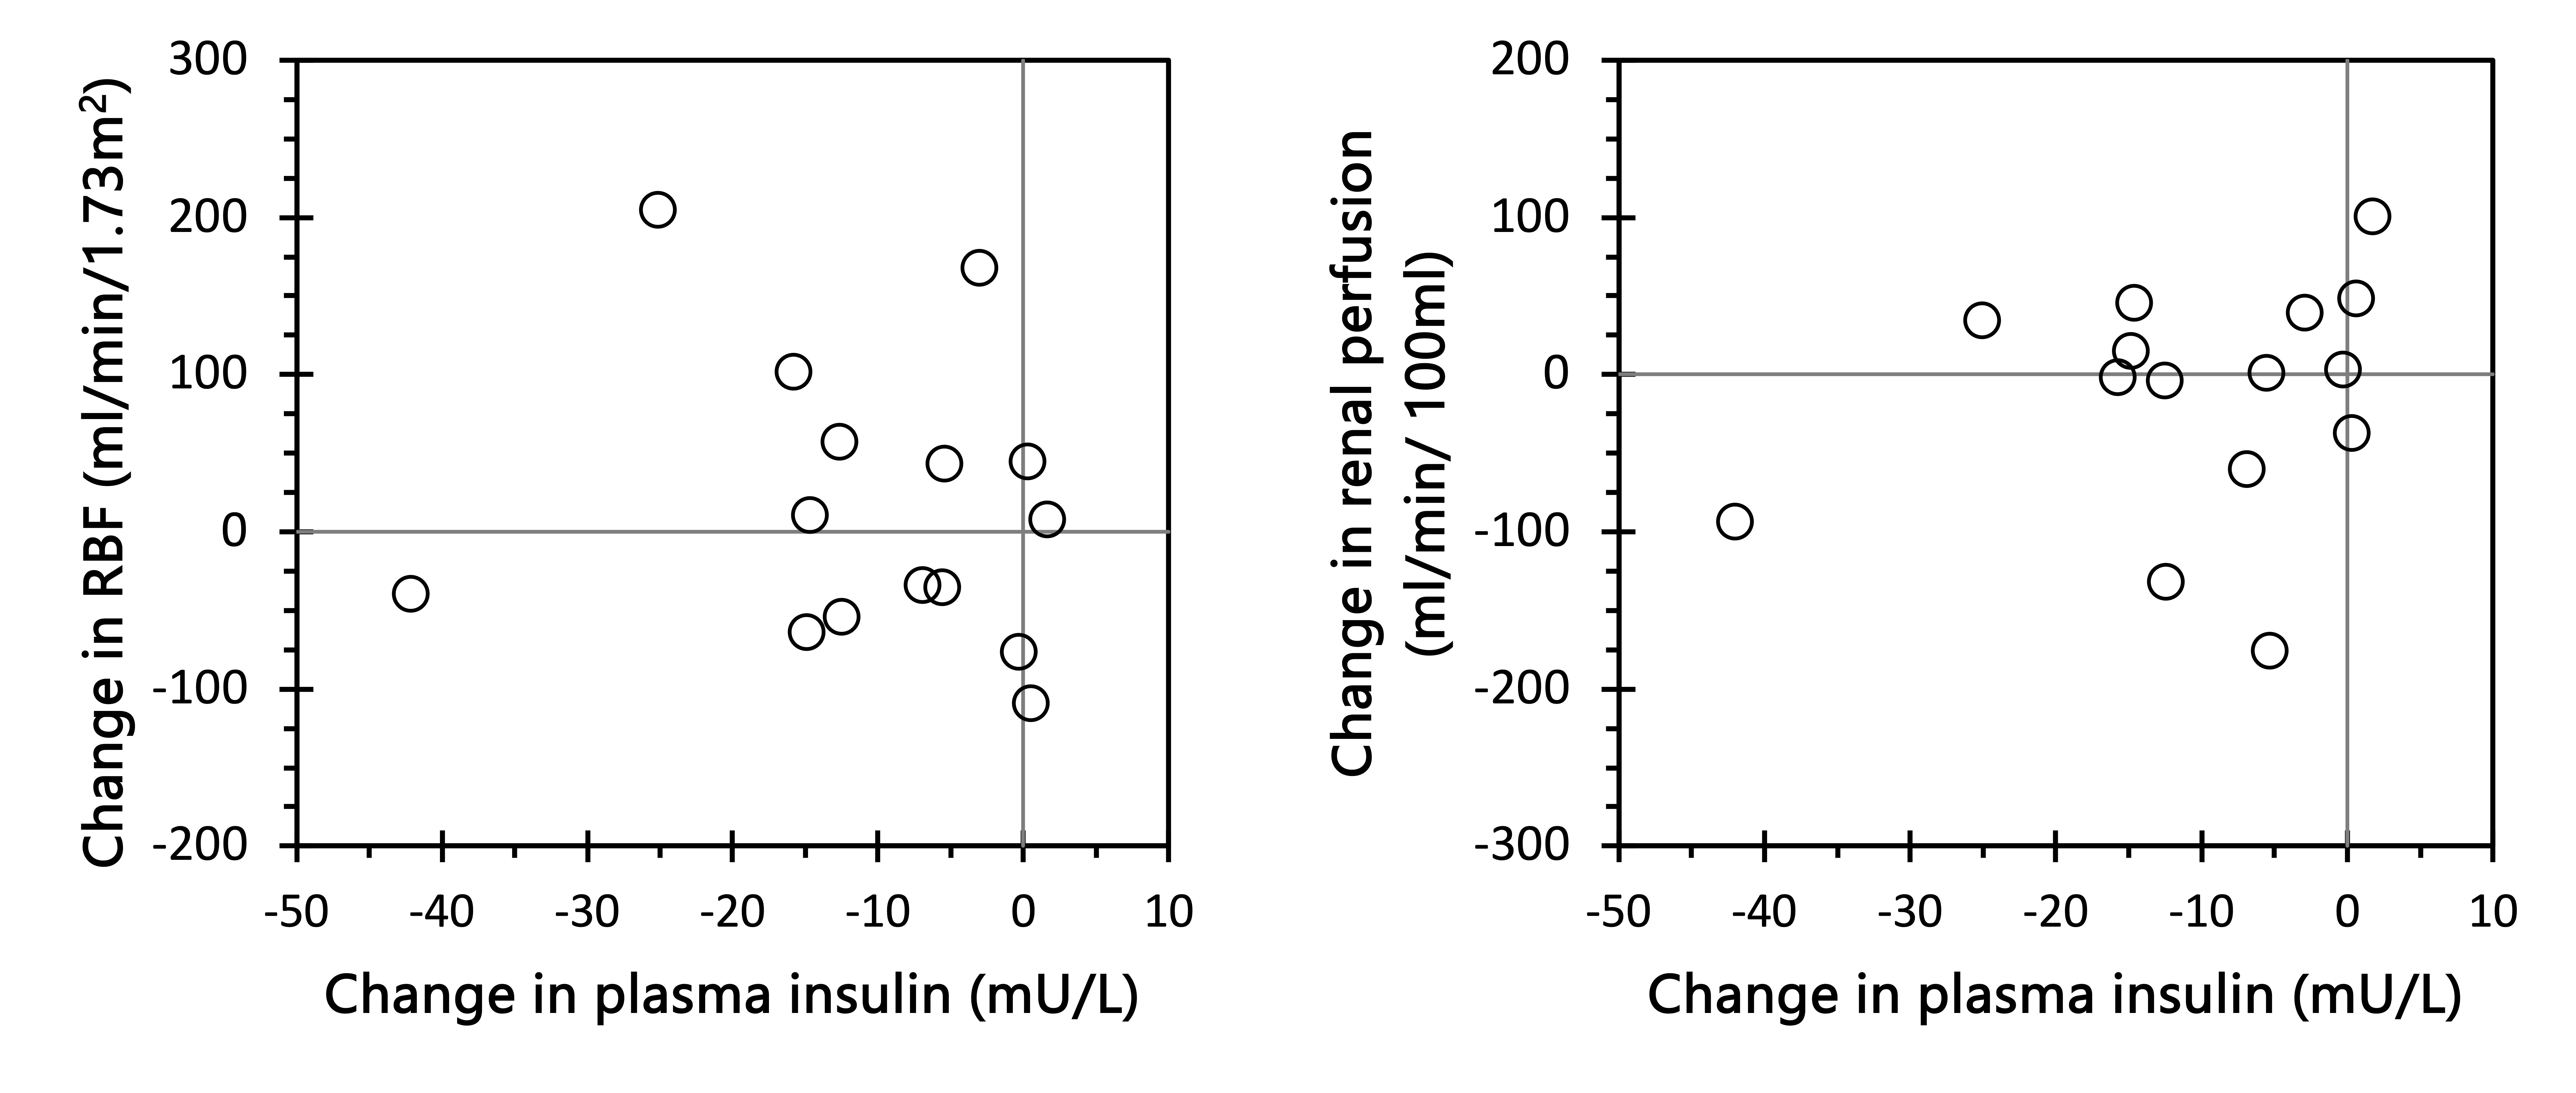
Figur 5 Comparing changes in RBF and perfusion against changes in plasma insulin.