2754
Simultaneous and Respiratory Motion-Synchronized T2 and T2* Mapping of the Human Kidneys1Berlin Ultrahigh Field Facility (B.U.F.F.), Max-Delbrück-Center for Molecular Medicine in the Helmholtz Association, Berlin, Germany, 2Institute for Medical Engineering, Otto von Guericke University, Magdeburg, Germany, 3Department of Physics, Humboldt University of Berlin, Berlin, Germany, 4Charité - Universitätsmedizin Berlin, Berlin, Germany, 5Department of Biomedical Magnetic Resonance, Otto-von-Guericke University, Magdeburg, Germany, 6German Center for Neurodegenerative Diseases (DZNE), Berlin, Germany, 7Center for Behavioral Brain Sciences (CBBS), Berlin, Germany, 8Research Campus STIMULATE, Otto von Guericke University, Magdeburg, Germany, 9Experimental and Clinical Research Center (ECRC), a joint cooperation between the Charité Medical Faculty and the Max-Delbrück-Center for Molecular Medicine in the Helmholtz Association, Berlin, Germany
Synopsis
Keywords: Kidney, Quantitative Imaging
Motivation: Quantitative MRI techniques, such as T2 and T2* mapping, have the potential to become important imaging biomarkers for non-invasive renal tissue assessment. However, clinical T2 and T2* mapping faces challenges posed by respiratory motion.
Goal(s): This study explores the feasibility of simultaneous T2 and T2* mapping of the human kidneys with mitigated respiratory motion artifacts, using the 2in1-RARE-EPI technique.
Approach: We used the distinctive acoustic noise pattern generated by the gradient coil switching during 2in1-RARE-EPI data acquisition to guide the subject to time their respiration during the scan.
Results: This approach facilitates high in-plane resolution (1x1x5mm3) T2 and T2* mapping of human kidneys.
Impact: Our approach for simultaneous and motion-synchronized T2 and T2* mapping of the human kidney provides a technical foundation for swift translation into the clinic and for gaining a better mechanistic understanding of renal (patho-)physiology.
INTRODUCTION
Renal diseases and disorders often lead to alterations of tissue properties that can be assessed using quantitative MRI (qMRI)1. Renal T2* and T2 mapping are surrogates of renal oxygenation2,3, of proven value for renal size assessment4,5, and of clinical relevance for monitoring polycystic kidney disease6. Clinical T2 and T2* mapping of the kidneys is challenging due to the constraints dictated by respiratory motion7-9 and long scan times. To advance from incremental to accelerated and simultaneous T2 and T2* mapping, 2in1-RARE-EPI provides a viable approach, which has been established for brain MRI so far10,11. Recognizing the clinical need for qMRI of the kidney, this study examines the feasibility of simultaneous, co-registered, high spatial resolution, and respiratory motion-synchronized T2 and T2* mapping of the human kidneys using 2in1-RARE-EPI. For synchronization of the data acquisition with respiratory motion, the intrinsic characteristic acoustic sound of 2in1-RARE-EPI was employed.METHODS
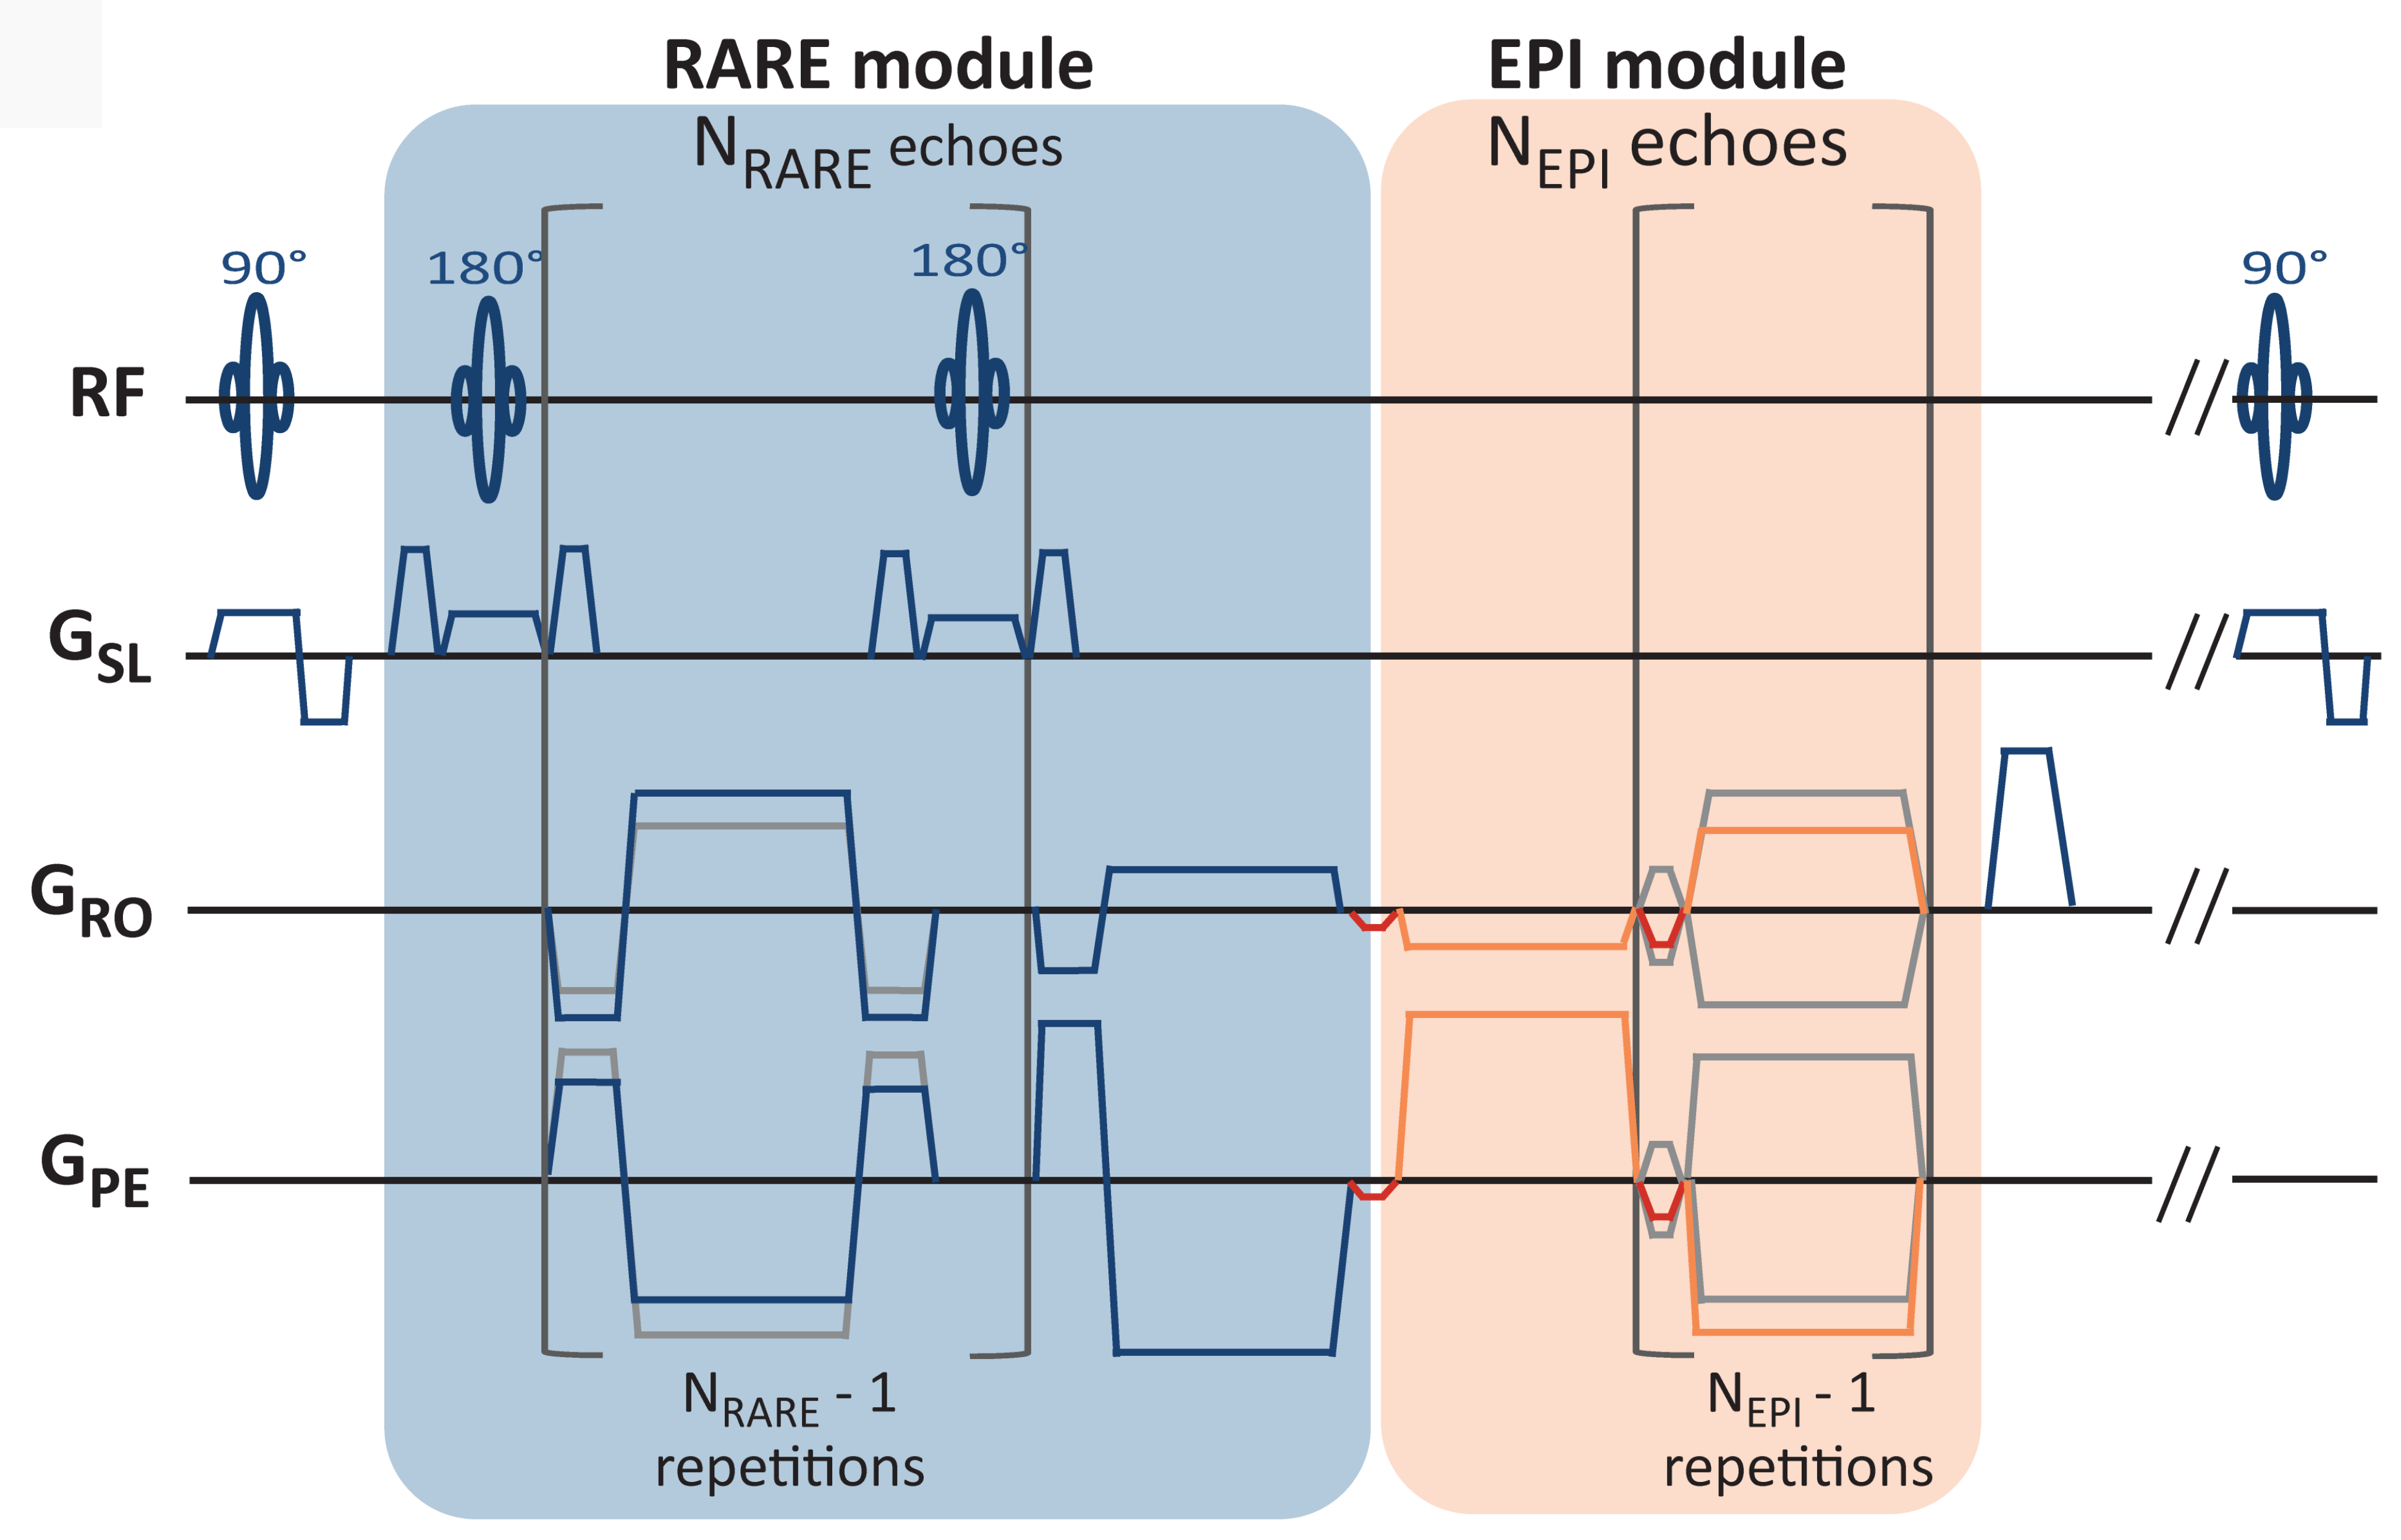
2in1-RARE-EPI consists of a RARE and EPI module to obtain T2 and T2* decay information10,11 (Figure 1). A radial trajectory with golden-angle angular ordering was implemented12. A healthy volunteer (male, 38 years) was recruited for this study. Measurements were performed on a SkyraFit 3T system (Siemens, Erlangen, Germany) using body and spine RF coil arrays for signal reception. To avoid streaking artifacts, only those RF coil elements covering the kidneys were selected13,14 (26 channels). Measurement parameters were: FOV 256x256 mm2, matrix size 256x256, slice thickness=5mm, excitations=300, TR=2000 ms, bandwidth=810Hz/pixel, ETLRARE/ETLEPI=12/14, ESPRARE/ESPEPI=6.34/2.46 ms. The characteristic acoustic noise produced by 2in1-RARE-EPI was used to guide the subject to time their respiration during the scan. Before the scanning session, the volunteer was presented with an audio featuring the distinctive sound pattern generated by the gradient coil switching during 2in1-RARE-EPI data acquisition. For three slices, it consists of a periodic pattern with 330 ms of sound while data is acquired, followed by 1670 ms of silence. The volunteer was asked to reach the end of their exhalation and to hold his breath shortly before and during each MRI data acquisition interval. Gradient delay correction was performed using RING15. The echo images were reconstructed using parallel imaging and compressed sensing reconstruction using BART16. T2 and T2* maps were obtained by fitting the magnitudes of the RARE and EPI images, respectively, to a monoexponential curve on a voxel-by-voxel basis using ARLO17.RESULTS
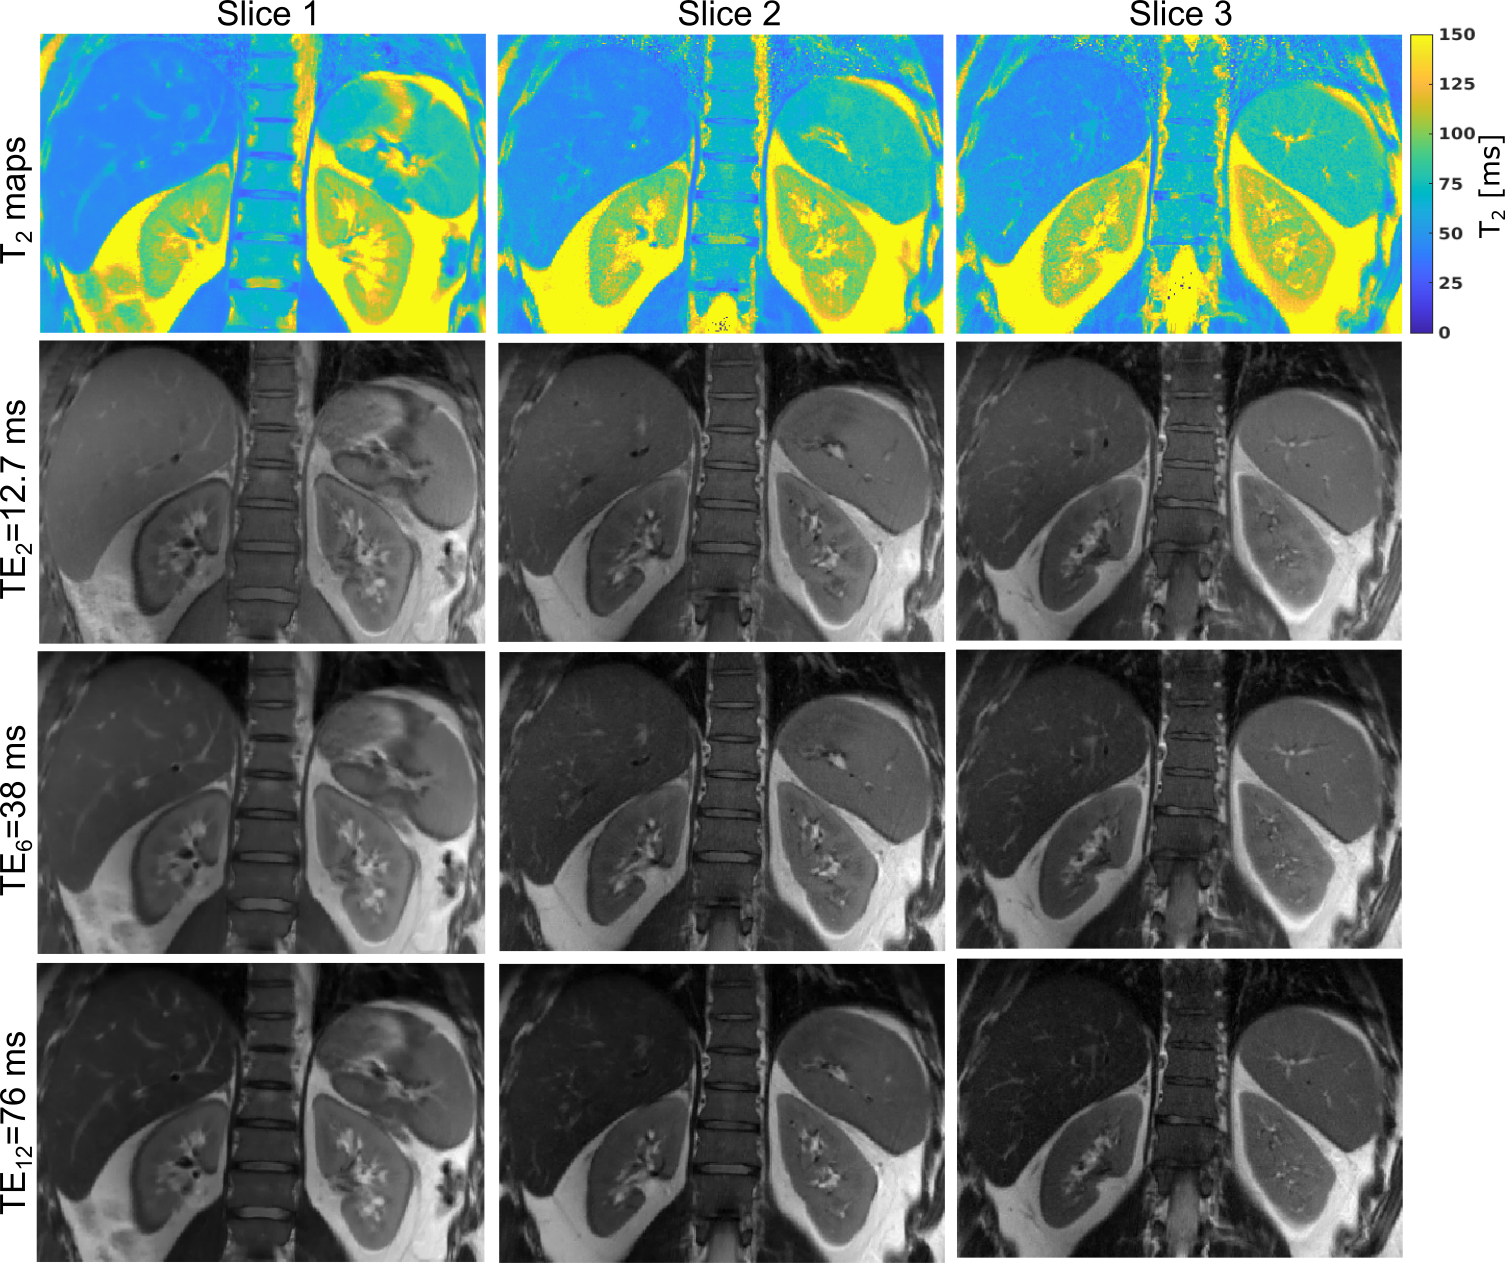
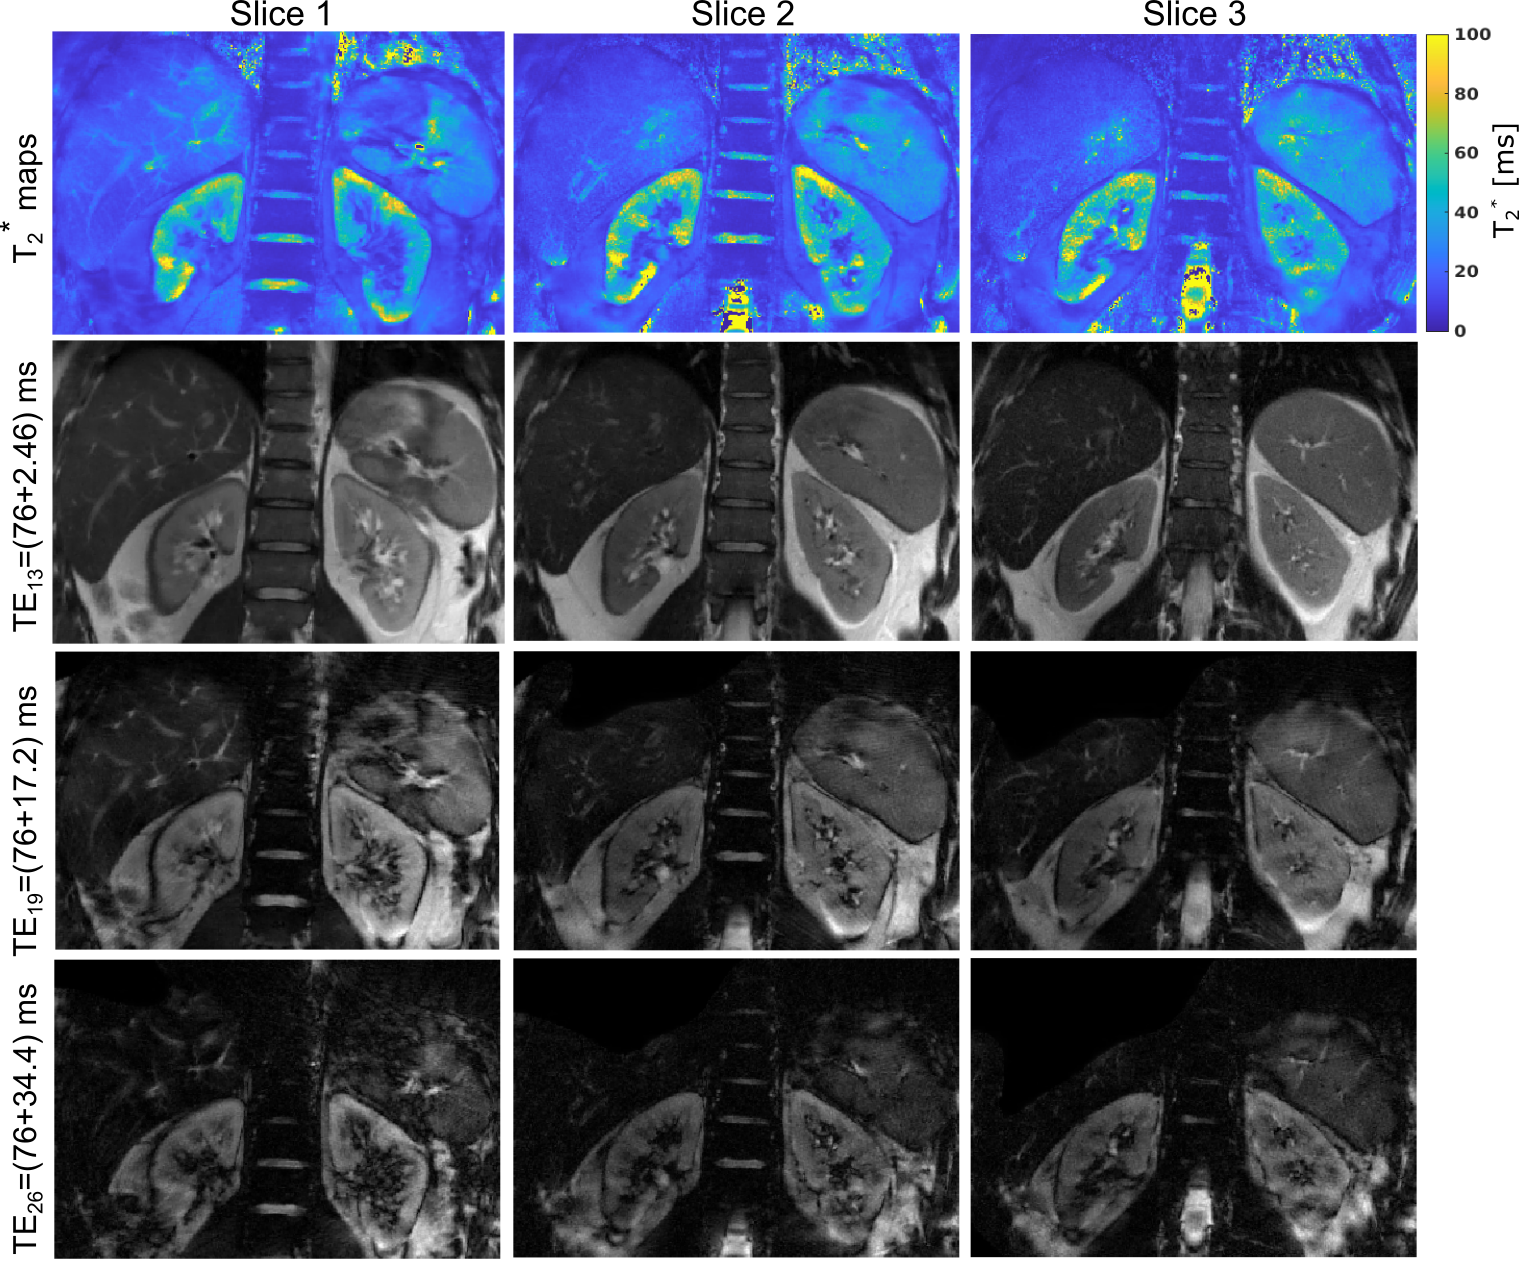
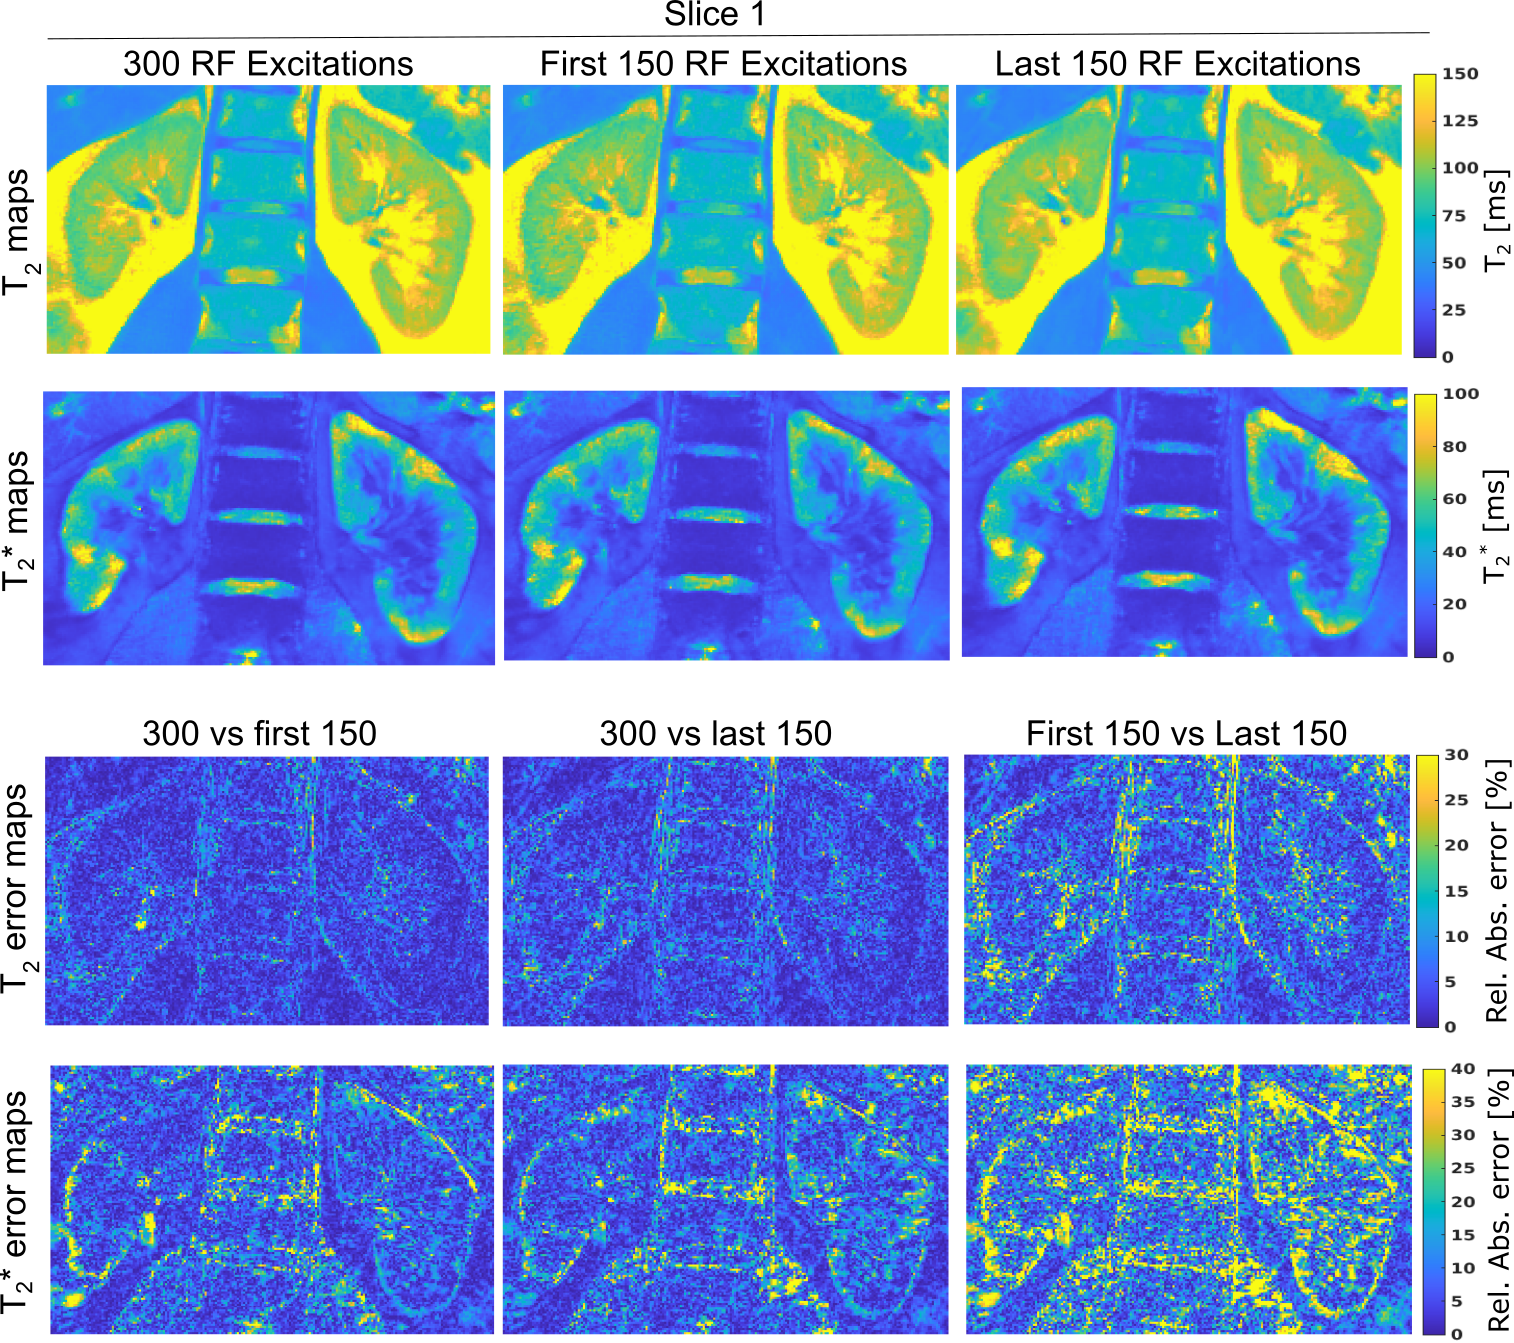
Figures 2 and 3 depict T2 and T2* maps of the kidneys of a healthy volunteer, along with selected TE images. No visible respiratory motion or streaking artifacts are present, indicating that the respiratory management strategy was successful. However, chemical shift artifacts at the fat-kidney interfaces are observed in the TE images, affecting the maps in these areas. The cortex and medulla of the kidneys can be distinguished in both maps. T2 in the medulla is higher than in the cortex. Conversely, T2* in the medulla is lower than in the cortex, indicating a lower blood oxygenation level in the medulla compared to the cortex2-3. The total acquisition time for 300 excitations was TA = 10 min. However, it is possible to halve the TA by reducing the excitations to 150, with minimal impact on the relative error of the final maps with respect to the original ones (Fig. 4). Furthermore, maps obtained with only the first 150 (Fig. 4 middle column) and with only the last 150 excitations (Fig. 4 last column) shows close similarity, suggesting good repeatability of our approach. T2 and T2* obtained for the cortex and medulla at 3.0T are consistent with other publications7,18,19 and summarized in Fig. 5.DISCUSSION AND CONCLUSIONS
This work demonstrates the feasibility of simultaneous, inherently co-registered, and motion artifact-mitigated T2 and T2* mapping of the kidneys using the 2in1-RARE-EPI technique in conjunction with a simple and intuitive approach for respiratory guidance. Differing from Kobayashi8, where he implemented two extra sinusoidal gradient waveforms to produce acoustic sound to guide the inhalation and exhalation, our work leverages the characteristic acoustic noise inherent to 2in1-RARE-EPI for respiratory guidance, rendering the implementation of extra gradient waveforms unnecessary. This approach facilitates high in-plane resolution (1x1x5mm3) T2 and T2* mapping of human kidneys. We demonstrated that 150 excitations are sufficient to get high-quality T2 and T2* maps in 5 min. In contrast, the clinical T2 mapping counterpart (TSE-based) requires 256 excitations and 8:32 min, including severe respiratory motion artifacts. Our findings provide a technical foundation for swift translation of T2 and T2* mapping of the kidney into the clinic and for gaining a better mechanistic understanding of renal (patho-)physiology on the way to improving diagnosis, prognosis, and treatment of renal disorders.Acknowledgements
No acknowledgement found.References
1. G. Schley, J. Jordan, S. Ellmann, et al. "Multiparametric magnetic resonance imaging of experimental chronic kidney disease: a quantitative correlation study with histology," PLoS One, vol. 13, p. e0200259, 2018.
2. T. Niendorf, A. Pohlmann, K. Arakelyan, et al. "How bold is blood oxygenation level-dependent (BOLD) magnetic resonance imaging of the kidney? Opportunities, challenges and future directions," Acta physiologica, vol. 213, p. 19–38, 2015.
3. O. Bane, I. A. Mendichovszky, B. Milani, et al. "Consensus-based technical recommendations for clinical translation of renal BOLD MRI," Magnetic Resonance Materials in Physics, Biology and Medicine, vol. 33, p. 199–215, 2020.
4. K. Cantow, T. Gladytz, J. M. Millward, et al. "Monitoring kidney size to interpret MRI-based assessment of renal oxygenation in acute pathophysiological scenarios," Acta Physiologica, vol. 237, p. e13868, 2023.
5. T. Gladytz, J. M. Millward, K. Cantow, et al. "Reliable kidney size determination by magnetic resonance imaging in pathophysiological settings," Acta Physiologica, vol. 233, p. e13701, 2021.
6. L. C. Adams, K. K. Bressem, P. Jurmeister, et al. "Use of quantitative T2 mapping for the assessment of renal cell carcinomas: first results," Cancer Imaging, vol. 19, p. 1–11, 2019.
7. X. Li, P. J. Bolan, K. Ugurbil and G. J. Metzger, "Measuring renal tissue relaxation times at 7 T," NMR in biomedicine, vol. 28, p. 63–69, 2015.
8. N. Kobayashi, "Magnetic resonance imaging with gradient sound respiration guide," Plos one, vol. 16, p. e0254758, 2021.
9. N. Michoux, J. P. Vallee, A. Pechere-Bertschi, et al. "Analysis of contrast-enhanced MR images to assess renal function," Magnetic Resonance Materials in Physics, Biology and Medicine, vol. 19, p. 167–179, 2006.
10. C. J. J. Herrmann, A. Els, L. Boehmert, et al. "Simultaneous T2 and mapping of multiple sclerosis lesions with radial RARE-EPI," Magnetic resonance in medicine, vol. 86, p. 1383–1402, 2021.
11. C. J. J. Herrmann, L. Starke, J. M. Millward, et al. "Accelerated simultaneous T2 and T2* mapping of multiple sclerosis lesions using compressed sensing reconstruction of radial RARE-EPI MRI," Tomography, vol. 9, p. 299–314, 2023.
12. S. Winkelmann, T. Schaeffter, T. Koehler, et al. "An optimal radial profile order based on the Golden Ratio for time-resolved MRI," IEEE transactions on medical imaging, vol. 26, p. 68–76, 2006.
13. K. T. Block, H. Chandarana, S. Milla, et al. "Towards routine clinical use of radial stack-of-stars 3D gradient-echo sequences for reducing motion sensitivity," Journal of the Korean Society of Magnetic Resonance in Medicine, vol. 18, p. 87–106, 2014.
14. L. Feng, "Golden-angle radial MRI: basics, advances, and applications," Journal of Magnetic Resonance Imaging, vol. 56, p. 45–62, 2022.
15. S. Rosenzweig, H. C. M. Holme and M. Uecker, "Simple auto-calibrated gradient delay estimation from few spokes using Radial Intersections (RING)," Magnetic resonance in medicine, vol. 81, p. 1898–1906, 2019.
16. M. Uecker, F. Ong, J. I. Tamir, et al. "Berkeley advanced reconstruction toolbox," in Proc. Intl. Soc. Mag. Reson. Med, 2015.
17. M. Pei, T. D. Nguyen, N. D. Thimmappa, et al. "Algorithm for fast monoexponential fitting based on auto-regression on linear operations (ARLO) of data," Magnetic resonance in medicine, vol. 73, p. 843–850, 2015.
18. X.-M. Li, L. Yang, J. Reng, et al. "Non-invasive evaluation of renal structure and function of healthy individuals with multiparametric MRI: Effects of sex and age," Scientific Reports, vol. 9, p. 10661, 2019.
19. C. M. J. De Bazelaire, G. D. Duhamel, N. M. Rofsky and D. C. Alsop, "MR imaging relaxation times of abdominal and pelvic tissues measured in vivo at 3.0 T: preliminary results," Radiology, vol. 230, p. 652–659, 2004.
Figures