2752
Assessment of Renal Water Exchange by T2 Selective Labeling1Beth Israel Deaconess Medical Center, Boston, MA, United States, 2Harvard Medical School, Boston, MA, United States
Synopsis
Keywords: Kidney, Kidney
Motivation: Alterations of renal water transport and exchange may reflect kidney function and disease.
Goal(s): To develop and test a novel sequence for quantitative assessment of intrarenal fluid exchange.
Approach: We developed a T2 selective labeling sequence for water exchange quantification and tested it on healthy subjects.
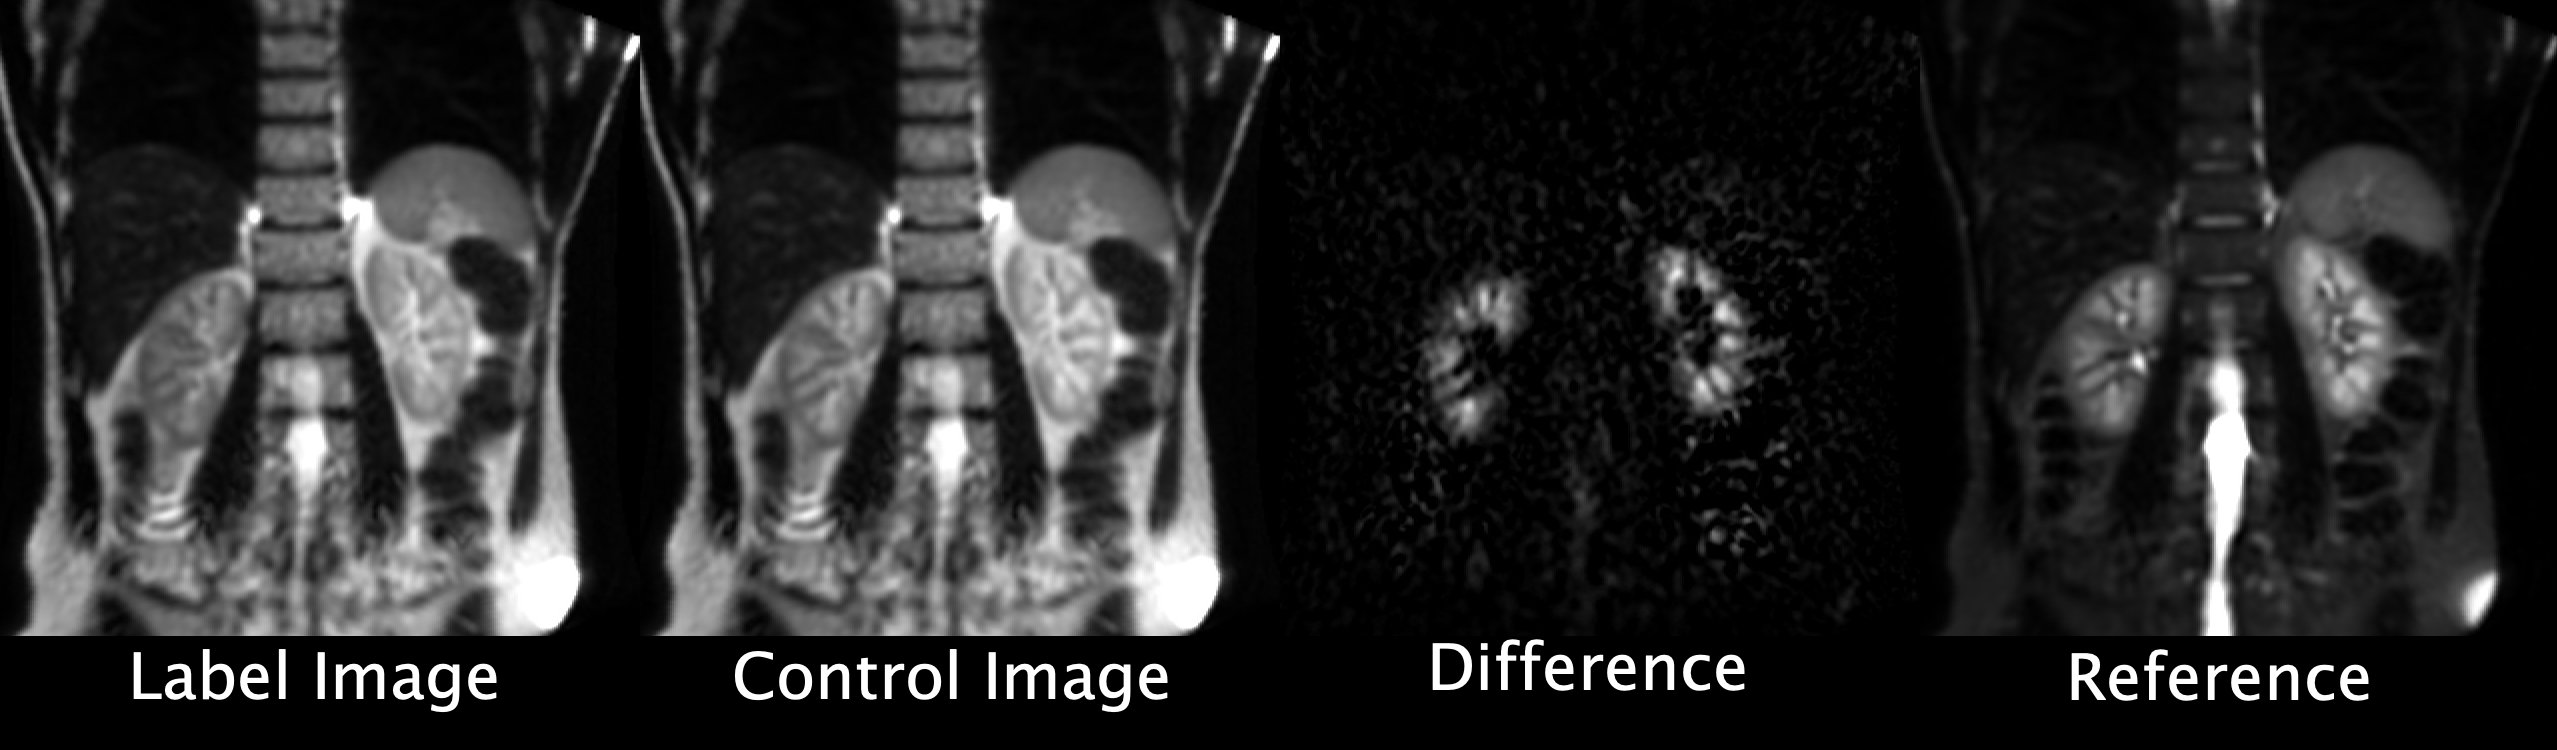
Results: Images showed a characteristic spatial distribution of signal with increased signal in the renal medulla, in support of its detection and assessment of fluid exchange.
Impact: Exchange imaging by T2 selective saturation may open new possibilities for the study of water transport and exchange and the diagnosis of renal disorders.
Background
The kidneys are the primary focus for the reabsorption and excretion of water to maintain body homeostasis. MRI is increasingly used for imaging of renal function, including perfusion, glomerular filtration rate, and intrarenal oxygen measurement. Here, we propose a novel MRI research sequence using T2 selective preparation for the assessment of intrarenal water exchange in healthy volunteers.Theory
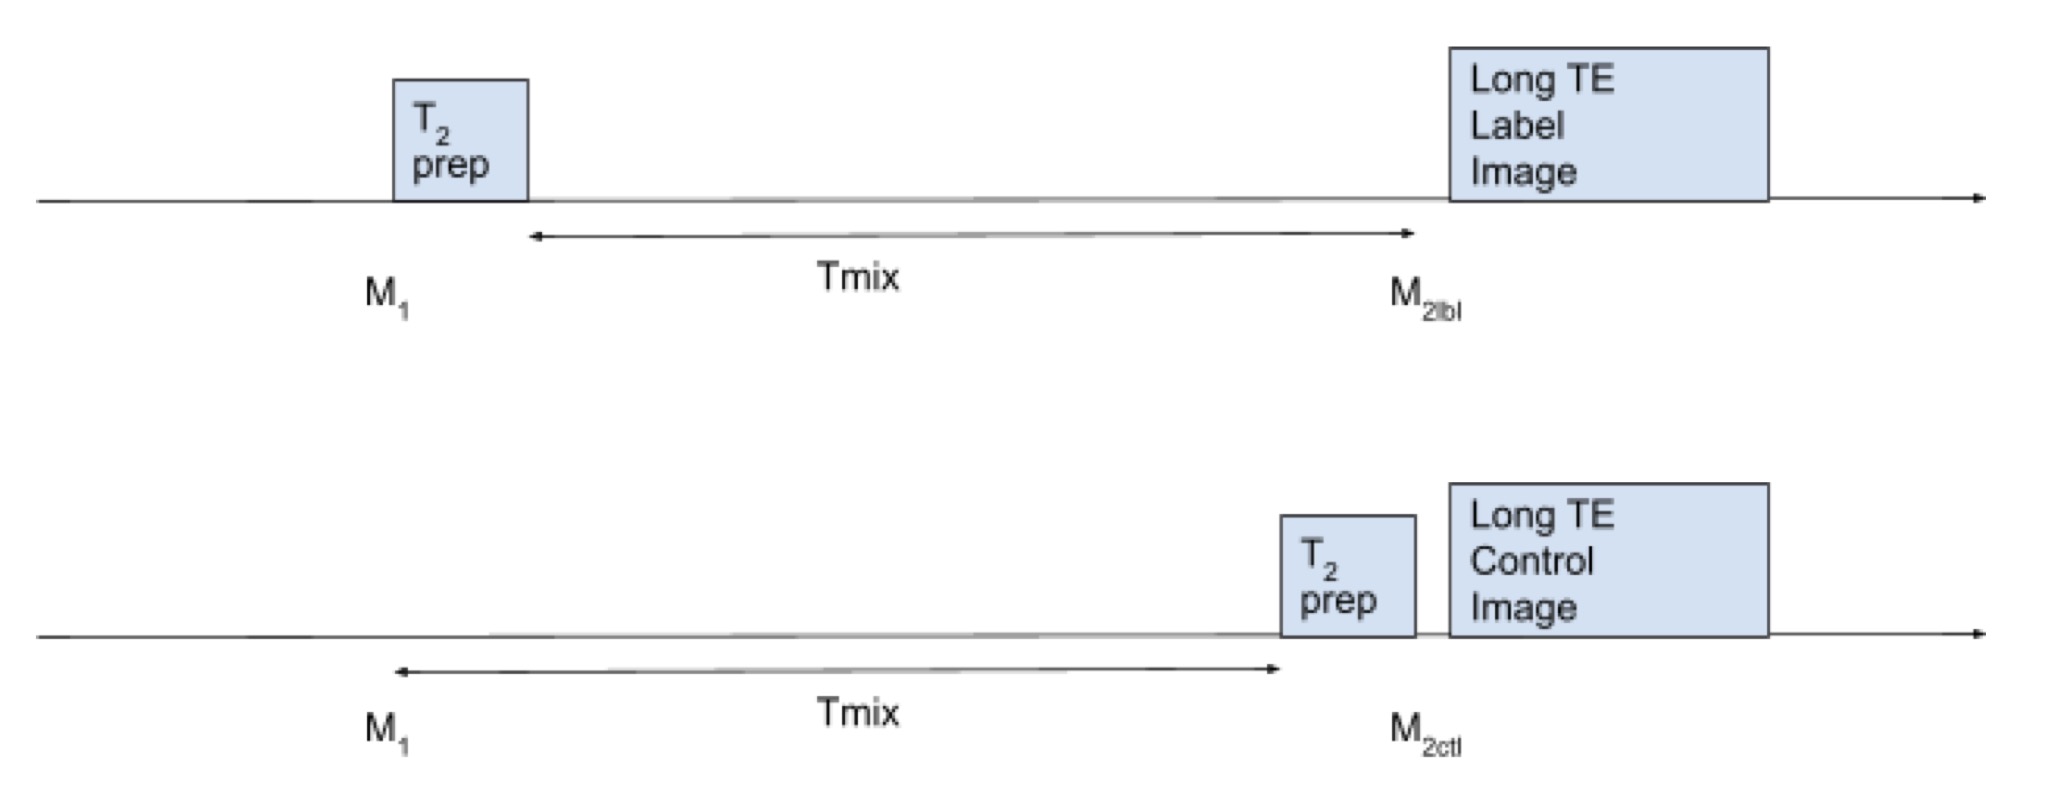
Our approach to T2 selective labeling employed a second image with T2 saturation applied later as a control, figure 1. For the labeled sequence, a T2 selective saturation is applied before a mixing time Tmix. For the control sequence, The T2 selective saturation is applied after Tmix. In the absence of exchange during the mixing time, the magnetizations after the label and control sequences are given by$$$M_{2lbl}={\alpha}M_1(e^{({-T_{mix}/T_1})})+R$$$
$$$M_{2ctl}={\alpha}M_1(e^{({-T_{mix}/T_1})})+{\alpha}R$$$
Where alpha is the saturation factor for the T2 saturation and R is the recovered magnetization during the mixing period. The difference between the two ending magnetizations is nonzero only because of the recover term R.
$$$M_{2lbl} - M_{2ctl} =(1-\alpha)R= (1-\alpha)(1-e^{({-T_{mix}/T_1})})$$$
If we add n inversion pulses during the mixing time, the M1 terms above are multiplied by a power of the inversion efficiency. But, if the timing of the inversion(s) is optimized, one can make R close to zero1. For 3 or more inversions, R can be reduced to less than 1% for T1’s from pure water to fat.
$$$M_{2lbl} - M_{2ctl}= \alpha\beta^nM_1e^{({-T_{mix}/T_1})}-\alpha\beta^nM_1e^{({-T_{mix}/T_1})}+(1-\alpha)R$$$
Because this subtraction removes direct effects of labeling on exchanging spins, any difference between label and control should reflect exchange during the mixing time such that T2 and/or T1 are not constant.
Methods
The T2 selective exchange sequences were implemented on a GE Signa Premier XT scanner before a single slice SSFSE (RARE) sequence. T2 preparation was achieved with either 100ms or 200ms BIR8 adiabatic sequences2, and 4 tanh adiabatic inversion pulses were applied at optimized times to minimize recovered magnetization. The preparations were preceded by nonselective saturation 5 s before imaging and a T2 selective inversion recovery optimized to nearly nullify M1 of urine. Following the preparations, 200ms were allowed to allow some recovery of tissue magnetization and 3 fat saturation pulses were applied immediately before imaging. A TR of 10s with interleaving of label and control acquisitions and variable TE’s were used. TE was controlled by skipping a number of echoes prior to acquisition. Eleven acquisitions of the label and control images and a reference image required a total of 4 minutes per sequence. DICOM images were processed in MATLAB. Label and control images were averaged and subtracted.Results
Images showed predominantly increased signal within the renal medulla and distributed throughout the medullary collecting duct system especially at longer labeling times. Cortical signals were relatively more pronounced at shorter labeling times (Tmix 1000ms). This signal’s spatial distribution could be explained by a mixture of water exchange in the proximal tubule and collecting duct and the bulk flow of filtrate.Acknowledgements
No acknowledgement found.References
1. Maleki N. et al. MAGMA (2012) 25(2):127-33.
2. Guo J. et al. Magn Reson Med (2015) 73(3):1085-94
Figures