2750
Quantification of Whole-Organ Renal Metabolic Rate of Oxygen Consumption During Free-Breathing1Department of Radiology, University of Pennsylvania, Philadelphia, PA, United States, 2Department of Bioengineering, University of Pennsylvania, Philadelphia, PA, United States
Synopsis
Keywords: Kidney, Kidney
Motivation: Whole-organ renal oxygen metabolism increases by 40-65% during early stages of kidney disease. Current biomarkers are sensitive to later kidney disease stages once tissue damage has already occurred.
Goal(s): Non-invasively quantify renal metabolic rate of oxygen during free-breathing, to be used as a potential biomarker for early diagnosis of kidney disease.
Approach: A new MRI sequence was tested in healthy adults at the left kidney that simultaneously measures blood water T2 and blood flow rate, from which metabolic rate of oxygenation is determined from Fick’s Principle.
Results: Quantification of metabolic parameters show good agreement between free-breathing and breath-hold acquisitions.
Impact: The renal metabolic rate of oxygen was non-invasively quantified at the left kidney during free-breathing in healthy adults. Renal oxygen metabolism can be a valuable physiological biomarker for early diagnosis of kidney disease before irreversible tissue damage occurs.
Introduction
Type 2 diabetes mellitus is the leading cause of chronic kidney disease (CKD), such that 1 in 3 adults with diabetes has CKD.1,2 Moreover, early diagnosis of CKD remains challenging due to lack of early diagnostic biomarkers.1-3 During early stages of diabetic kidney disease, renal metabolic rate of oxygen consumption (rMRO2) increases by 40-65%.4,5 Since structural dysfunction follows an earlier onset of functional changes, rMRO2 may serve as a biomarker for diagnosis of early-stage CKD. Recently, quantification of rMRO2 in healthy adults was achieved through Fick Principle using the MRI sequence K-MOTIVE (“Kidney Metabolism of Oxygen via T2 and Interleaved Velocity Encoding).6-8 Within a 21-second breath-hold, K-MOTIVE is designed to simultaneously measure blood flow velocity and blood water T2 in the draining vein of the kidney.6-8 T2 is then converted to venous oxygen saturation (SvO2) via a calibration curve and rMRO2 is derived from the Fick Principle equation.9,10 However, breath-hold compliance is subject-dependent, and may be difficult for some patients, and could subsequently compromise the quality of the data. The goal of this study is to expand the K-MOTIVE protocol to a free-breathing design.Methods
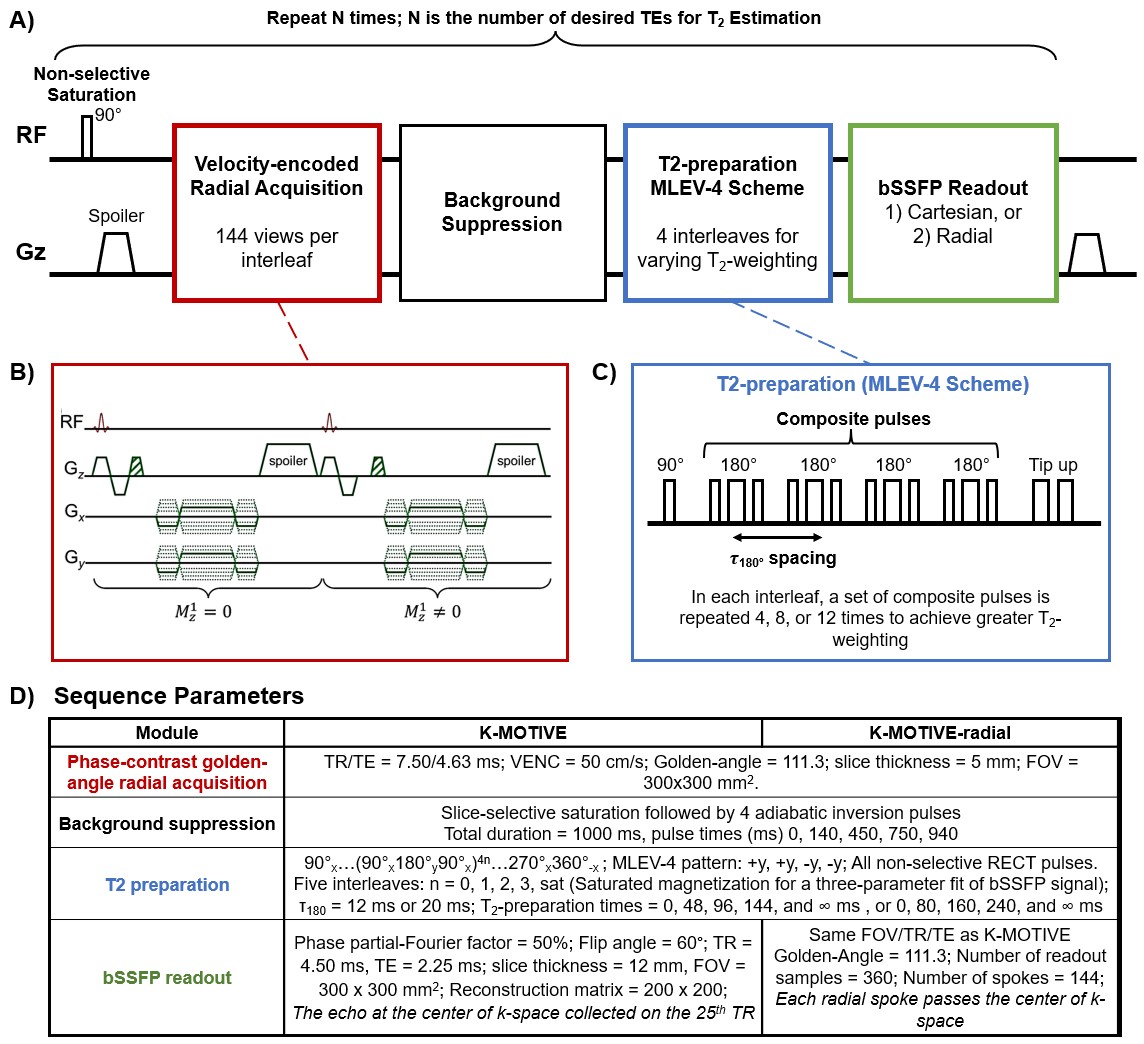
The K-MOTIVE sequence was previously proposed to quantify MRO2 of the kidney (Fig.1).6,7 To estimate rMRO2, the Fick Principle is applied:$$$MRO_2=((C_{RBC}*hct)/mass)* BFR * (SaO_2 - SvO_2)$$$ , where $$$C_{RBC}$$$ is the oxygen carrying capacity of red blood cells (19.93 μmol O2/mL RBC11), hct is hematocrit measured by a fingerstick, kidney mass is determined from the kidney volume using a localizer scan multiplied by tissue density of 1.06 g/mL12, BFR is blood flow rate, SaO2 is arterial oxygen saturation set at 98%, and SvO2 is venous oxygen saturation. K-MOTIVE simultaneously measures BFR and T2 of blood water in an interleaved fashion. SvO2 is then calculated from the estimated T2 using a calibration curve.10The sequence requires a 21-second breath-hold, incorporating 5 interleaves to achieve T2-weighting through 5 TE points.6 For the free-breathing acquisition, the sequence process was repeated four times back-to-back for a total duration of 1.5 minutes, such that each of the 5 TEs is acquired four times and all radial spokes are used to reconstruct the final images.
Participants (n=7, 5 male, ages 23-32 yo) were scanned at the left kidney at 3T (Prisma, Siemens, Erlangen, Germany) with a spine and body flex coils (30 channels combined). Two breath-hold variants of the sequence (K-MOTIVE with cartesian bSSFP readout; K-MOTIVE-radial with golden-angle radial bSSFP readout) were directly compared to a free-breathing variant (K-MOTIVE-radial free). Furthermore, the τ180 inter-focusing spacing in the Malcolm-Levitt (MLEV-4)9,13 T2-preparation module (Fig.1C) was tested separately at 12 and 20 ms, resulting in five TEs of [0, 48, 96, 144, ∞ ms] and [0, 80, 160, 240, ∞ ms], respectively. Longer inter-focusing spacing is expected to provide greater T2 precision in the target range of blood oxygen saturation.9 Each breath-hold sequence variant was repeated three times to measure intrasession reproducibility.
Results
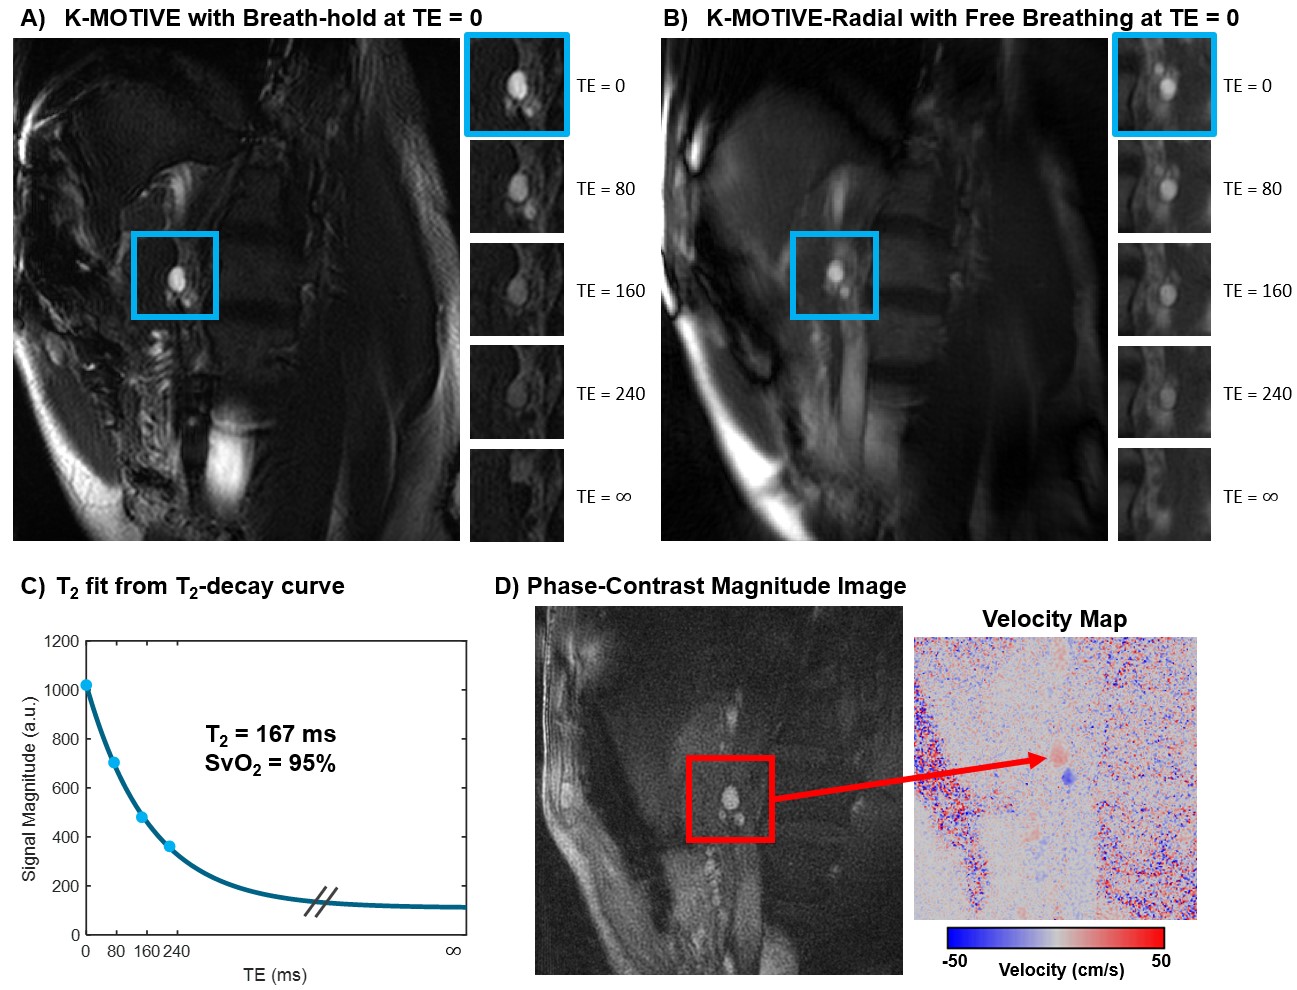
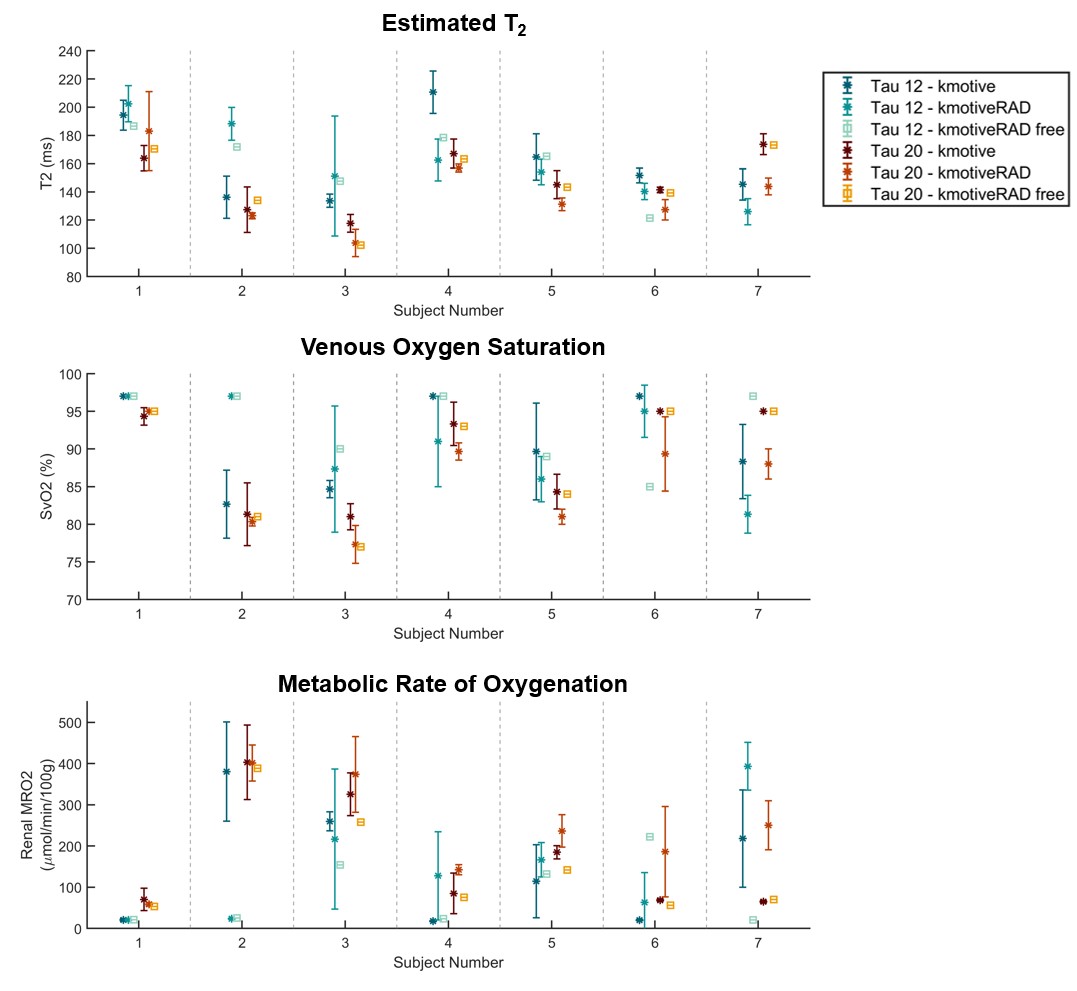
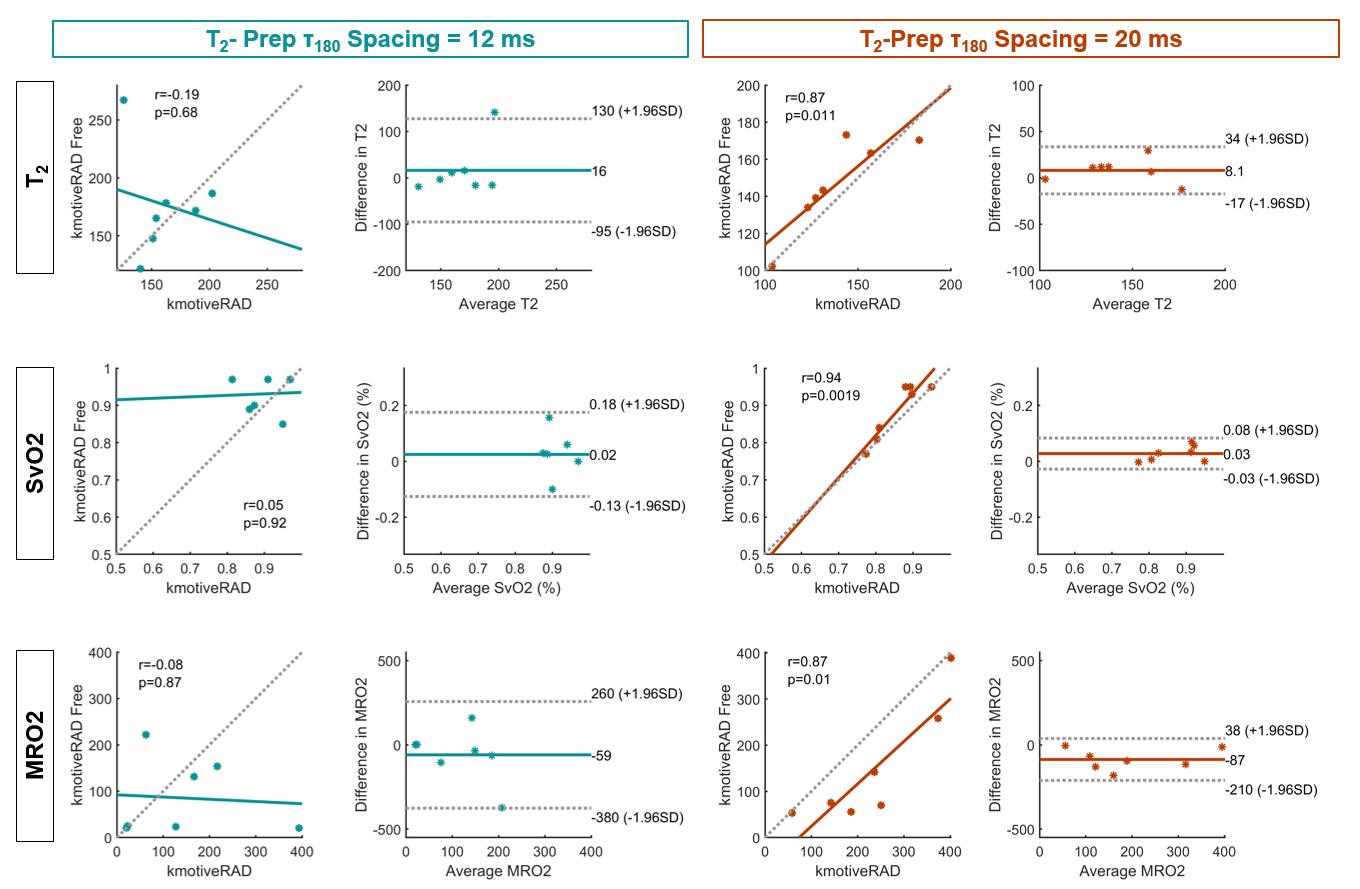
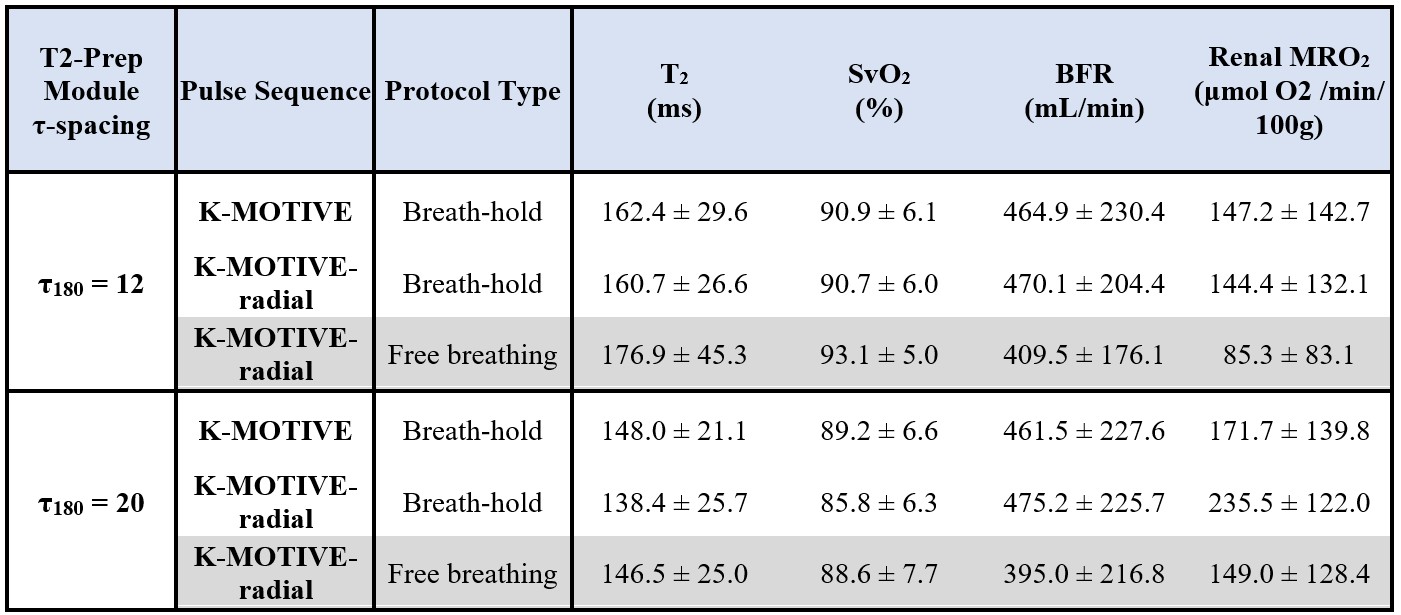
Example K-MOTIVE images for one representative participant are shown in Fig.2. Estimated metabolic parameters (T2, SvO2, MRO2) are illustrated per subject (Fig.3), in addition to correlation and Bland-Altman analyses between scan pairs (Fig.4). Summary statistics of all metabolic parameters are in Table.1.Discussion
Free-breathing K-MOTIVE had an average T2 and SvO2 within a similar range as the two breath-hold variants of K-MOTIVE (Table 1). However, BFR was always lower for the free-breathing K-MOTIVE, which may be due to absence of the hypercapnic response seen during breath-holds. When τ180 spacing is set to 20 ms, and within each participant, the estimated metabolic parameters show overall smaller variability within each sequence and better overall precision among the three sequence variants (Fig.3). Additionally, τ180 spacing of 20 ms results in higher correlation and overall smaller bias between free-breathing and breath-hold variants of K-MOTIVE (Fig.4).Healthy adults were previously reported to have an average T2 of 157 ms at the left renal vein6, therefore, using larger τ180 spacing may result in better T2 fit as longer TE durations are a better match to the target T2 value. As demonstrated in Wright et al., larger τ180 spacing provides greater T2 precision in the target range of blood oxygen saturation.9 While free-breathing acquisition introduces respiratory motion and may have contributed to the lower BFR values, it remains desirable for potential SNR increase and patient comfort.
Conclusions
Preliminary K-MOTIVE results at the left kidney demonstrate good agreement in T2 quantification, and subsequently SvO2, between free-breathing and breath-hold acquisitions. Future work will incorporate a motion-correction strategy to minimize respiratory motion and improve on the quantification accuracy for blood flow rate and renal oxygen metabolism.Acknowledgements
NIH T32 EB020087; NIH T32-AR007132; NIH R21 DK132556References
1. Chronic Kidney Disease in the United States, 2023. Centers for Disease Control and Prevention. (https://www.cdc.gov/kidneydisease/publications-resources/ckd-national-facts.html).
2. Center for Disease Control and Prevention. Chronic Kidney Disease in the United States, 2021. US Department of Health and Human Services, Centers for Disease Control and Prevention.
3. Mizdrak M, Kumrić M, Kurir TT, Božić J. Emerging Biomarkers for Early Detection of Chronic Kidney Disease. Journal of Personalized Medicine 2022;12(4):548. (https://www.mdpi.com/2075-4426/12/4/548).
4. Korner A, Eklof AC, Celsi G, Aperia A. Increased renal metabolism in diabetes. Mechanism and functional implications. Diabetes 1994;43(5):629-33. DOI: 10.2337/diab.43.5.629.
5. Nordquist L, Friederich-Persson M, Fasching A, et al. Activation of hypoxia-inducible factors prevents diabetic nephropathy. J Am Soc Nephrol 2015;26(2):328-38. DOI: 10.1681/ASN.2013090990.
6. Deshpande R.S., Langham M.C., Susztak K., F.W. W. MRI-based Quantification of Whole-Organ Renal Metabolic Rate of Oxygen. NMR Biomedicine (in press) 2023.
7. Deshpande RS, Langham MC, Cheng CC, Wehrli FW. Metabolism of oxygen via T2 and interleaved velocity encoding: A rapid method to quantify whole-brain cerebral metabolic rate of oxygen. Magn Reson Med 2022;88(3):1229-1243. DOI: 10.1002/mrm.29299.
8. Cheng C, Wu P, Langham MC, Wehrli FW. Simultaneous measurements of blood flow and blood water T2: a general-purpose sequence for T2-based measurement of whole-organ O2 consumption. ISMRM. ISMRM, Virtual2020.
9. Wright GA, Hu BS, Macovski A. 1991 I.I. Rabi Award. Estimating oxygen saturation of blood in vivo with MR imaging at 1.5 T. J Magn Reson Imaging 1991;1(3):275-83. (In eng). DOI: 10.1002/jmri.1880010303.
10. Li W, van Zijl PCM. Quantitative theory for the transverse relaxation time of blood water. NMR Biomed 2020;33(5):e4207. DOI: 10.1002/nbm.4207.
11. West JB. Pulmonary physiology and pathophysiology : an integrated, case-based approach. 2nd ed. ed. Philadelphia: Wolters Kluwer Health/Lippincott Williams & Wilkins, 2007.
12. Allen TH, Krzywicki HJ, Roberts JE. Density, fat, water and solids in freshly isolated tissues. J Appl Physiol 1959;14:1005-8. DOI: 10.1152/jappl.1959.14.6.1005.
13. Levitt MH, Freeman R. Compensation for pulse imperfections in NMR spin-echo experiments. Journal of Magnetic Resonance (1969) 1981;43(1):65-80. DOI: https://doi.org/10.1016/0022-2364(81)90082-2.
Figures