2738
Using a Deep Learning Prior for Accelerating Hyperpolarized 13C Magnetic Resonance Spectroscopic Imaging on Synthetic Cancer Datasets1Department of Diagnostic Radiology, School of Clinical Medicine, University of Hong Kong, Hong Kong, China, 2Institute for Diagnostic and Interventional Radiology, University Medical Center Gottingen, Gottingen, Germany, 3Lauterbur Research Center for Biomedical Imaging, Shenzhen Institutes of Advanced Technology of Chinese Academy of Sciences, ShenZhen, China
Synopsis
Keywords: Image Reconstruction, Spectroscopy
Motivation: Hyperpolarized (HP) 13C magnetic resonance spectroscopic imaging (MRSI) is efficient and reliable in assessing the aggressiveness of tumors and their response to treatments.
Goal(s): To incorporate a deep learning prior with k-space data fidelity for accelerating HP 13C MRSI.
Approach: Singular maps were generated from synthetic phantom datasets simulated by two-site exchange models and used to train the deep learning prior, which was then employed with the fidelity term to reconstruct the undersampled k-space data.
Results: The proposed method was demonstrated feasibility and generalizability on varied synthetic cancer datasets, and showed improved accuracy in value and location of tumors compared to other methods.
Impact: The proposed model could be considered as a general framework that extended the application of deep learning to MRSI reconstruction, which could be applied in varied cancer datasets.
Introduction
Noninvasive molecular imaging is efficient and reliable in assessing the aggressiveness of tumors and their response to treatments. A promising HP 13C MRSI has been developed for probing key metabolic pathways in vivo in clinical settings 1. The dynamic MRSI measurement is required for enzyme kinetic modeling and quantification 2 since the single time point image is qualitative for the lactate-to-pyruvate ratio measurement. Recently, several MRSI acceleration methods have been applied, such as phase-encoded MRSI3, echo planar spectroscopic imaging (EPSI) and compressed sensing (CS) 4. Meanwhile, deep learning-based reconstruction is another important aspect in accelerating MRI. A variational network (VN) and model-based deep learning (MODL) were used within an unrolled iterative scheme 5 , but they might be labile to changes in undersampling patterns, acquisition sequences, and imaging parameters. Besides, using a deep learning prior as a statistical representation of an MRI image database could help decouple the k-space data fidelity and neural network regularization 6. To the best our knowledge, there is a lack of studies on deep learning-based MRSI accelerations. The MRSI data generally has a higher dimensionality than MRI, arguing the need of future developing/optimizing the deep learning approach for accelerating MRSI.Methods
In Figure 1, 6500 fully sampled synthetic phantom datasets were used to train a deep learning prior based on Bayesian estimation. To deploy the model in reconstructing HP [1-13C] MRSI datasets, a k-space fidelity term was incorporated as explained in 6. A two-site exchange model was used to simulate pyruvate and lactate spectra. Then, the data were compressed from four dimensions, i.e., x, y, spectra, and dynamic, to three, i.e., x, y, and singular value, based on the singular vector decomposition (SVD) method to generate singular maps, which were fed for model training and MRSI reconstruction. The deep learning model was modified from PixelCNN++ with code in spreco. For each pixel of the image, the conditional distribution of the subsequent pixel was calculated with the correlation equations modified from three channels 6 to five channels. In an input image, the joint probability distribution of all pixels with the parameters were predicted using the generative network (Figure 2). During training, a random scaling factor within the range of [0 5] was applied on the training data to enlarge the value range as a data augmentation. The network was trained for 600 epochs with TensorFlow 2.1.0 on three GPUs of a workstation equipped with 4 NVIDIA RTX-2080Ti graphic cards using approximately 190 minutes. The other parameters were batch size = 20, dropout rate = 0.5, and number of mixture components = 5.The proposed method was assessed on varied synthetic datasets derived from MRI from patients with de novo glioblastoma (GBM) (N=33), prostate cancer (N=72), and genetically engineered mouse models (GEMMs) of high-grade astrocytoma (N=58). Random noise in Gaussian distributions with standard deviation 2.5% was added. The undersampling mask was assumed to be different for each time point, and three datasets with undersampling patterns of 25%, 20%, and 17% were generated. Furthermore, with a undersampling pattern 20%, random noise in Gaussian distributions with standard deviations of 2.5%, 5%, and 10% were added on magnetization images of prostate cancer data and compared. The other parameters were dropout rate = 0.5, noise ε = 0.2, iteration number maxiter = 100, and step size αk = 0.2. The model performance was measured by peak signal-to-noise ratio (PSNR, in dB). In addition, the area-under-curve (AUC) ratio between lactate and pyruvate 7 was calculated by the summation of values from all time points. The results from zero-filled and CS with L1 regularization (CS_L1) were obtained for comparison. CS_L1 minimization 8 was in-house implemented and was iterative soft-thresholding algorithm with a step size = 0.04, threshold θ = 0.01, regularization parameter λ = 0.005, and 150 iterations.
Results
In Table 1, Figure 3 and 4, our method could recover metabolic maps accurately and robustly and delineated the tumors precisely on different datasets. Specifically, our method reduced the noise level and improved PSNRs for all three undersampling patterns on mouse tumor dataset when compared to results from zero-filled and CS_L1. Furthermore, in Figure 4, the results from proposed method were highly consistent with references in AUC ratio maps, time courses and spectra on prostate cancer data with additive noise, demonstrating its generalizability and robustness.Conclusion
The proposed SVD + iterative deep learning model could be considered as a general framework that extended the application of deep learning reconstruction to MRSI, in which the morphology of tumors and metabolic images were measured robustly in 6 times acceleration.Acknowledgements
This work is supported by Hong Kong Innovation and Technology Fund MHP/070/20.References
1. Nelson SJ, Kurhanewicz J, Vigneron DB, et al. Metabolic imaging of patients with prostate cancer using hyperpolarized [1-(1)(3)C]pyruvate. Sci Transl Med. Aug 14 2013;5(198):198ra108. doi:10.1126/scitranslmed.3006070
2. Albers MJ, Bok R, Chen AP, et al. Hyperpolarized 13C lactate, pyruvate, and alanine: noninvasive biomarkers for prostate cancer detection and grading. Cancer Res. Oct 15 2008;68(20):8607-15. doi:10.1158/0008-5472.CAN-08-0749
3. Park I, Larson PE, Zierhut ML, et al. Hyperpolarized 13C magnetic resonance metabolic imaging: application to brain tumors. Neuro Oncol. Feb 2010;12(2):133-44. doi:10.1093/neuonc/nop043
4. Hu S, Lustig M, Chen AP, et al. Compressed sensing for resolution enhancement of hyperpolarized 13C flyback 3D-MRSI. J Magn Reson. Jun 2008;192(2):258-64. doi:10.1016/j.jmr.2008.03.003
5. Hammernik K, Klatzer T, Kobler E, et al. Learning a variational network for reconstruction of accelerated MRI data. Magn Reson Med. Jun 2018;79(6):3055-3071. doi:10.1002/mrm.26977
6. Luo G, Zhao N, Jiang W, Hui ES, Cao P. MRI reconstruction using deep Bayesian estimation. Magn Reson Med. Oct 2020;84(4):2246-2261. doi:10.1002/mrm.28274
7. Hill DK, Orton MR, Mariotti E, et al. Model free approach to kinetic analysis of real-time hyperpolarized 13C magnetic resonance spectroscopy data. PLoS One. 2013;8(9):e71996. doi:10.1371/journal.pone.0071996
8. Doneva M, Bornert P, Eggers H, Stehning C, Senegas J, Mertins A. Compressed sensing reconstruction for magnetic resonance parameter mapping. Magn Reson Med. Oct 2010;64(4):1114-20. doi:10.1002/mrm.22483
Figures
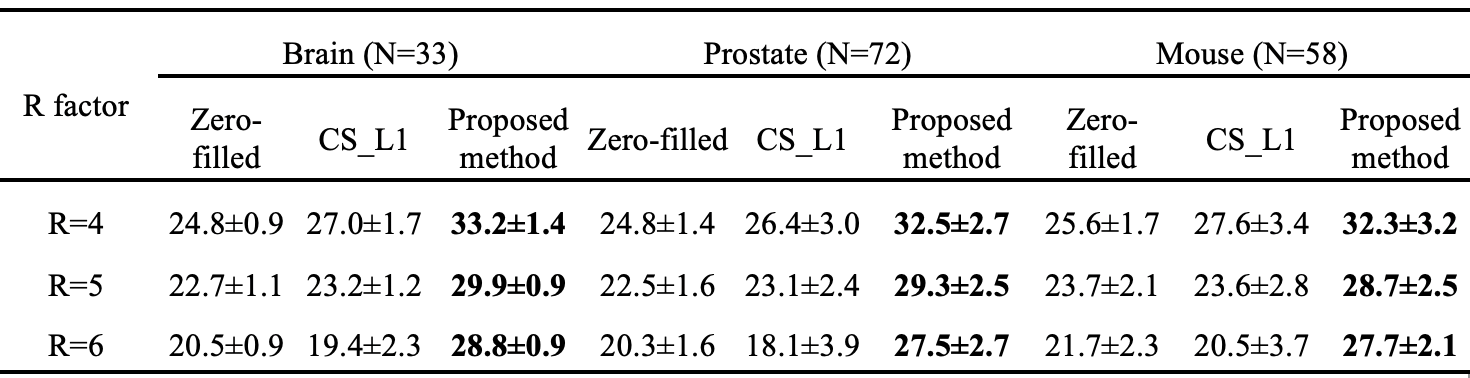
Table 1. PSNR measurements (in dB, mean ± std) for HP 13C pyruvate metabolic MRI reconstruction from zero-filled, CS_L1, and the proposed method. The comparison was performed on synthetic human brain tumor images (N=33), synthetic prostate cancer images (N=72), and synthetic mouse tumor images (N=58) using undersampling factors of R = 4, 5, and 6.
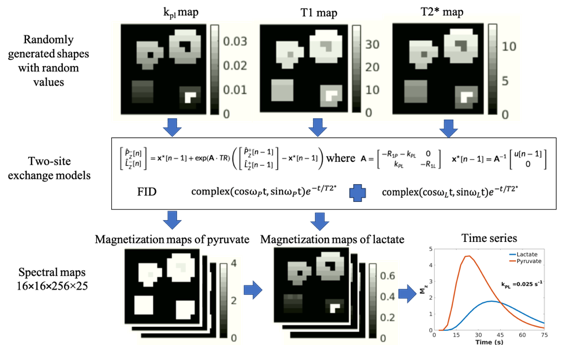
Figure 1. The processing scheme of synthetic HP 13C MRSI phantom. First, arbitrary kPL, T1, and T2* maps of four anomaly objects were generated using random shapes with random values. Later, the data were fed into two-site exchange models with presumed FID patterns to simulate magnetizations of pyruvate and lactate. Time series were from one pixel on the anomaly object.
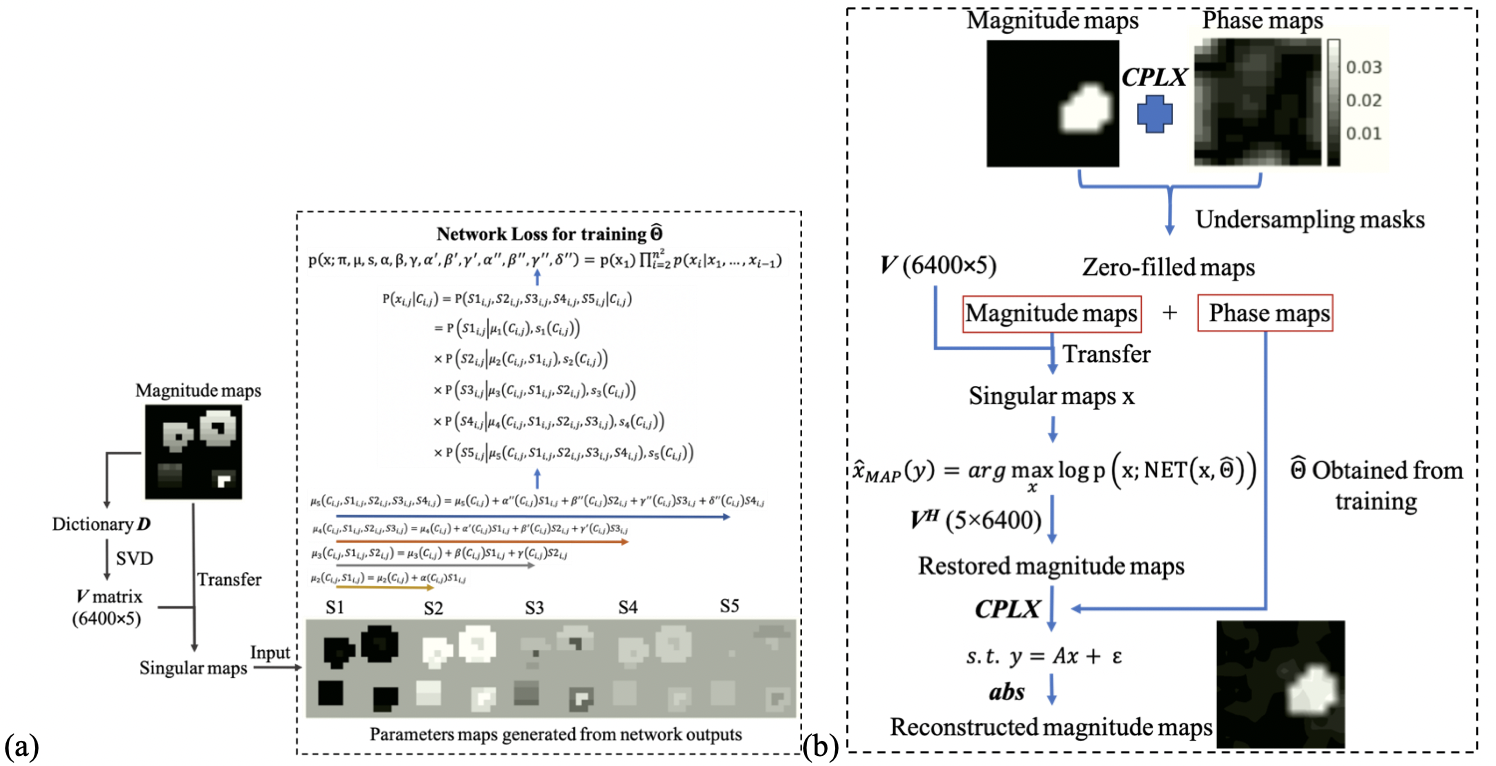
Figure 2. The schematic diagram of network training and MRSI reconstruction. (a) The SVD method was first applied on generated D to obtain the singular vectors V. In the training phase, the magnitude maps were transferred to five singular maps and fed into the generative network. The total probability was calculated and the network parameters were optimized. (b) In the reconstruction phase, fully sampled complex maps were input to reconstruct zero-filled maps, from which the magnitude maps were transferred to singular maps. The reconstructed maps were obtained with these maps.
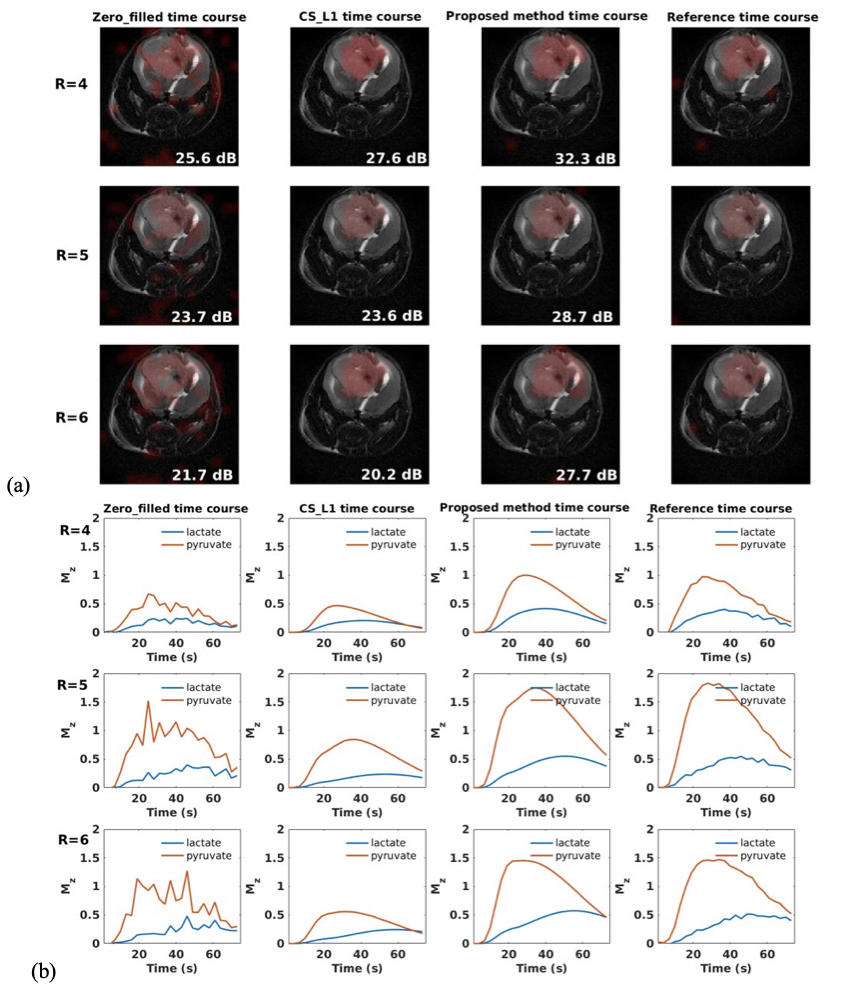
Figure 3. Reconstruction results of a synthetic tumor mouse dataset using 3 undersampling patterns (R = 4, 5, and 6) with PSNR values (in dB) denoted in the right corners. Results comparison among zero-filled, CS_L1, and our proposed method evaluated using AUC ratio (a) and time courses (b). Our method provides accurate estimation of the tumor metabolism in both value and location, and consistent variation trends and values for the time courses of pyruvate and lactate.
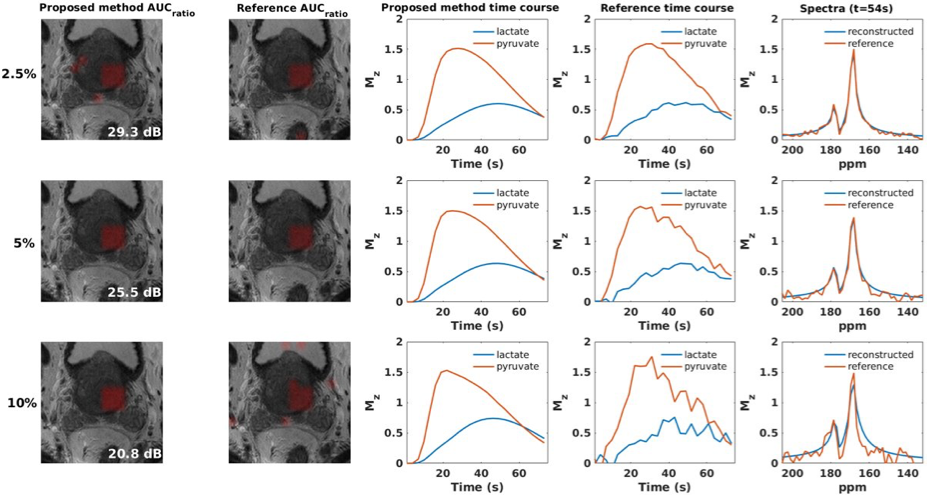
Figure 4. Reconstruction results of a synthetic human prostate cancer dataset using an undersampling pattern of 20% with PSNR values (in dB) denoted in the right corners. The noise standard deviations were set to 2.5%, 5%, and 10%. Comparison between reconstructed and reference in AUC ratio maps (column 1 & 2), time course of pyruvate and lactate (column 3 & 4), and spectrum from 54s (column 5), and results from proposed method were consistent with the reference.