2726
Analyzing the Impact of Transcranial Direct Current Stimulation on the Human Primary Visual Cortex through fMRI-based Brain Entropy1Key Laboratory for Biomedical Engineering of Ministry of Education, Department of Biomedical Engineering, College of Biomedical Engineering & Instrument Science, Zhejiang University, Hangzhou, China, 2Qiushi Academy for Advanced Studies, Zhejiang University, Hangzhou, China
Synopsis
Keywords: Other Interventional, fMRI (resting state), Brain Entropy, tDCS
Motivation: Specific impact of Transcranial Direct Current Stimulation (tDCS) on the human primary visual cortex (V1) remains unclear.
Goal(s): We used fMRI-based brain entropy (BEN) method to investigate the effects of short- and long-term tDCS on brain activity, and dynamic changes of BEN during tDCS.
Approach: The resting-state fMRl data were collected before, during and after stimulation from 10 healthy subjects.
Results: We observed reduced BEN values after both short- and long-term tDCS in frontoparietal and occipital areas. During tDCS, the brain preferred to stay in a state with lower BEN values in the default mode network compared to other brain regions.
Impact: Short- and long-term tDCS on V1 both have a positive effect on improving cognitive functions in healthy and psychiatric disorder population. We also further validated the utility of BEN as an effective method for assessing tDCS effects.
Introduction
Transcranial direct current stimulation (tDCS) has demonstrated its efficacy as a neuromodulation technique for the treatment of mental disorders1-3. Recent studies have emphasized the pivotal role of the human primary visual cortex (V1) in neurocognitive functions4,5. However, the specific impact of tDCS on V1 remains elusive. Brain entropy (BEN) is a distinctive marker for studying both brain diseases and normal brain function, offering unique insights into brain assessment6,7. This study aims to investigate the neurophysiological effects of tDCS on V1 using the BEN method based on resting-state fMRI.Methods
Ten healthy adults (6 males, age = 22.8 ± 1.9 years) with no history of mental or neurological disorders participated in this study under IRB approval. The entire experiment spanned 15 days of stimulation, followed by a two-week follow-up period. During the stimulation phase, each participant received anodal tDCS for 20 minutes at an intensity of 2 mA, targeting V1 (stimulation montage: PO3, 2 mA; FT7, -0.6 mA; CZ, -0.5 mA; Iz, -0.9 mA) with Molecular Neurological Institute coordinates (x, y, z) = (6, -63, 15). This phase comprised three sessions, each including MRI scanning before, during, and after stimulation on the 1st, 8th, and 15th day, respectively. In follow-up period, MRI data were collected in the last day of each week. The experimental pipeline is illustrated in Figure 1.T1-weighted and rs-fMRI images were acquired on a 3.0 T Siemens Prisma scanner. The rs-fMRI data were preprocessed using Advanced DPARSF (http://rfmri.org/DPARSF)8, involving slice timing correction, realignment, segmentation, normalization, smoothing, and filtering (0.01–0.1 Hz). Subsequently, the BEN map was computed for each participant based on the preprocessed fMRI data using BENtbx9. Paired t-tests were conducted to examine immediate effects by comparing BEN values before and after each stimulation, and accumulating effects by comparing BEN values between the 8th, 15th, 22nd, 29th days and the baseline (1st day). All statistical maps were corrected by GRF with a voxel-wise p-value < 0.01 and a cluster-wise p-value < 0.05. Additionally, a sliding-windows approach was employed to generate dynamic BEN maps for rs-fMRI data collected during stimulation, followed by clustering into different states and the calculation of frequency, dwell time, and transition probability10.
Results
Figure 2 depicts the differences in BEN maps before and after 20-minute tDCS at three time points. After the first short-term stimulation, a reduction in BEN was observed in the temporal lobe, followed by bilateral occipital lobe after the second stimulation, and bilateral frontoparietal areas after the third.For long-term stimulation (Figure 3), compared to the baseline, reduced BEN values were evident in widespread cortical regions, including the occipital lobe, primary motor cortex, temporal lobe, and frontoparietal areas after one week. After two weeks, reduced BEN was observed in the inferior parietal lobe, superior temporal gyrus, and occipital lobe. In the one-week and two-week follow-up, BEN values remained relatively stable compared to the baseline.
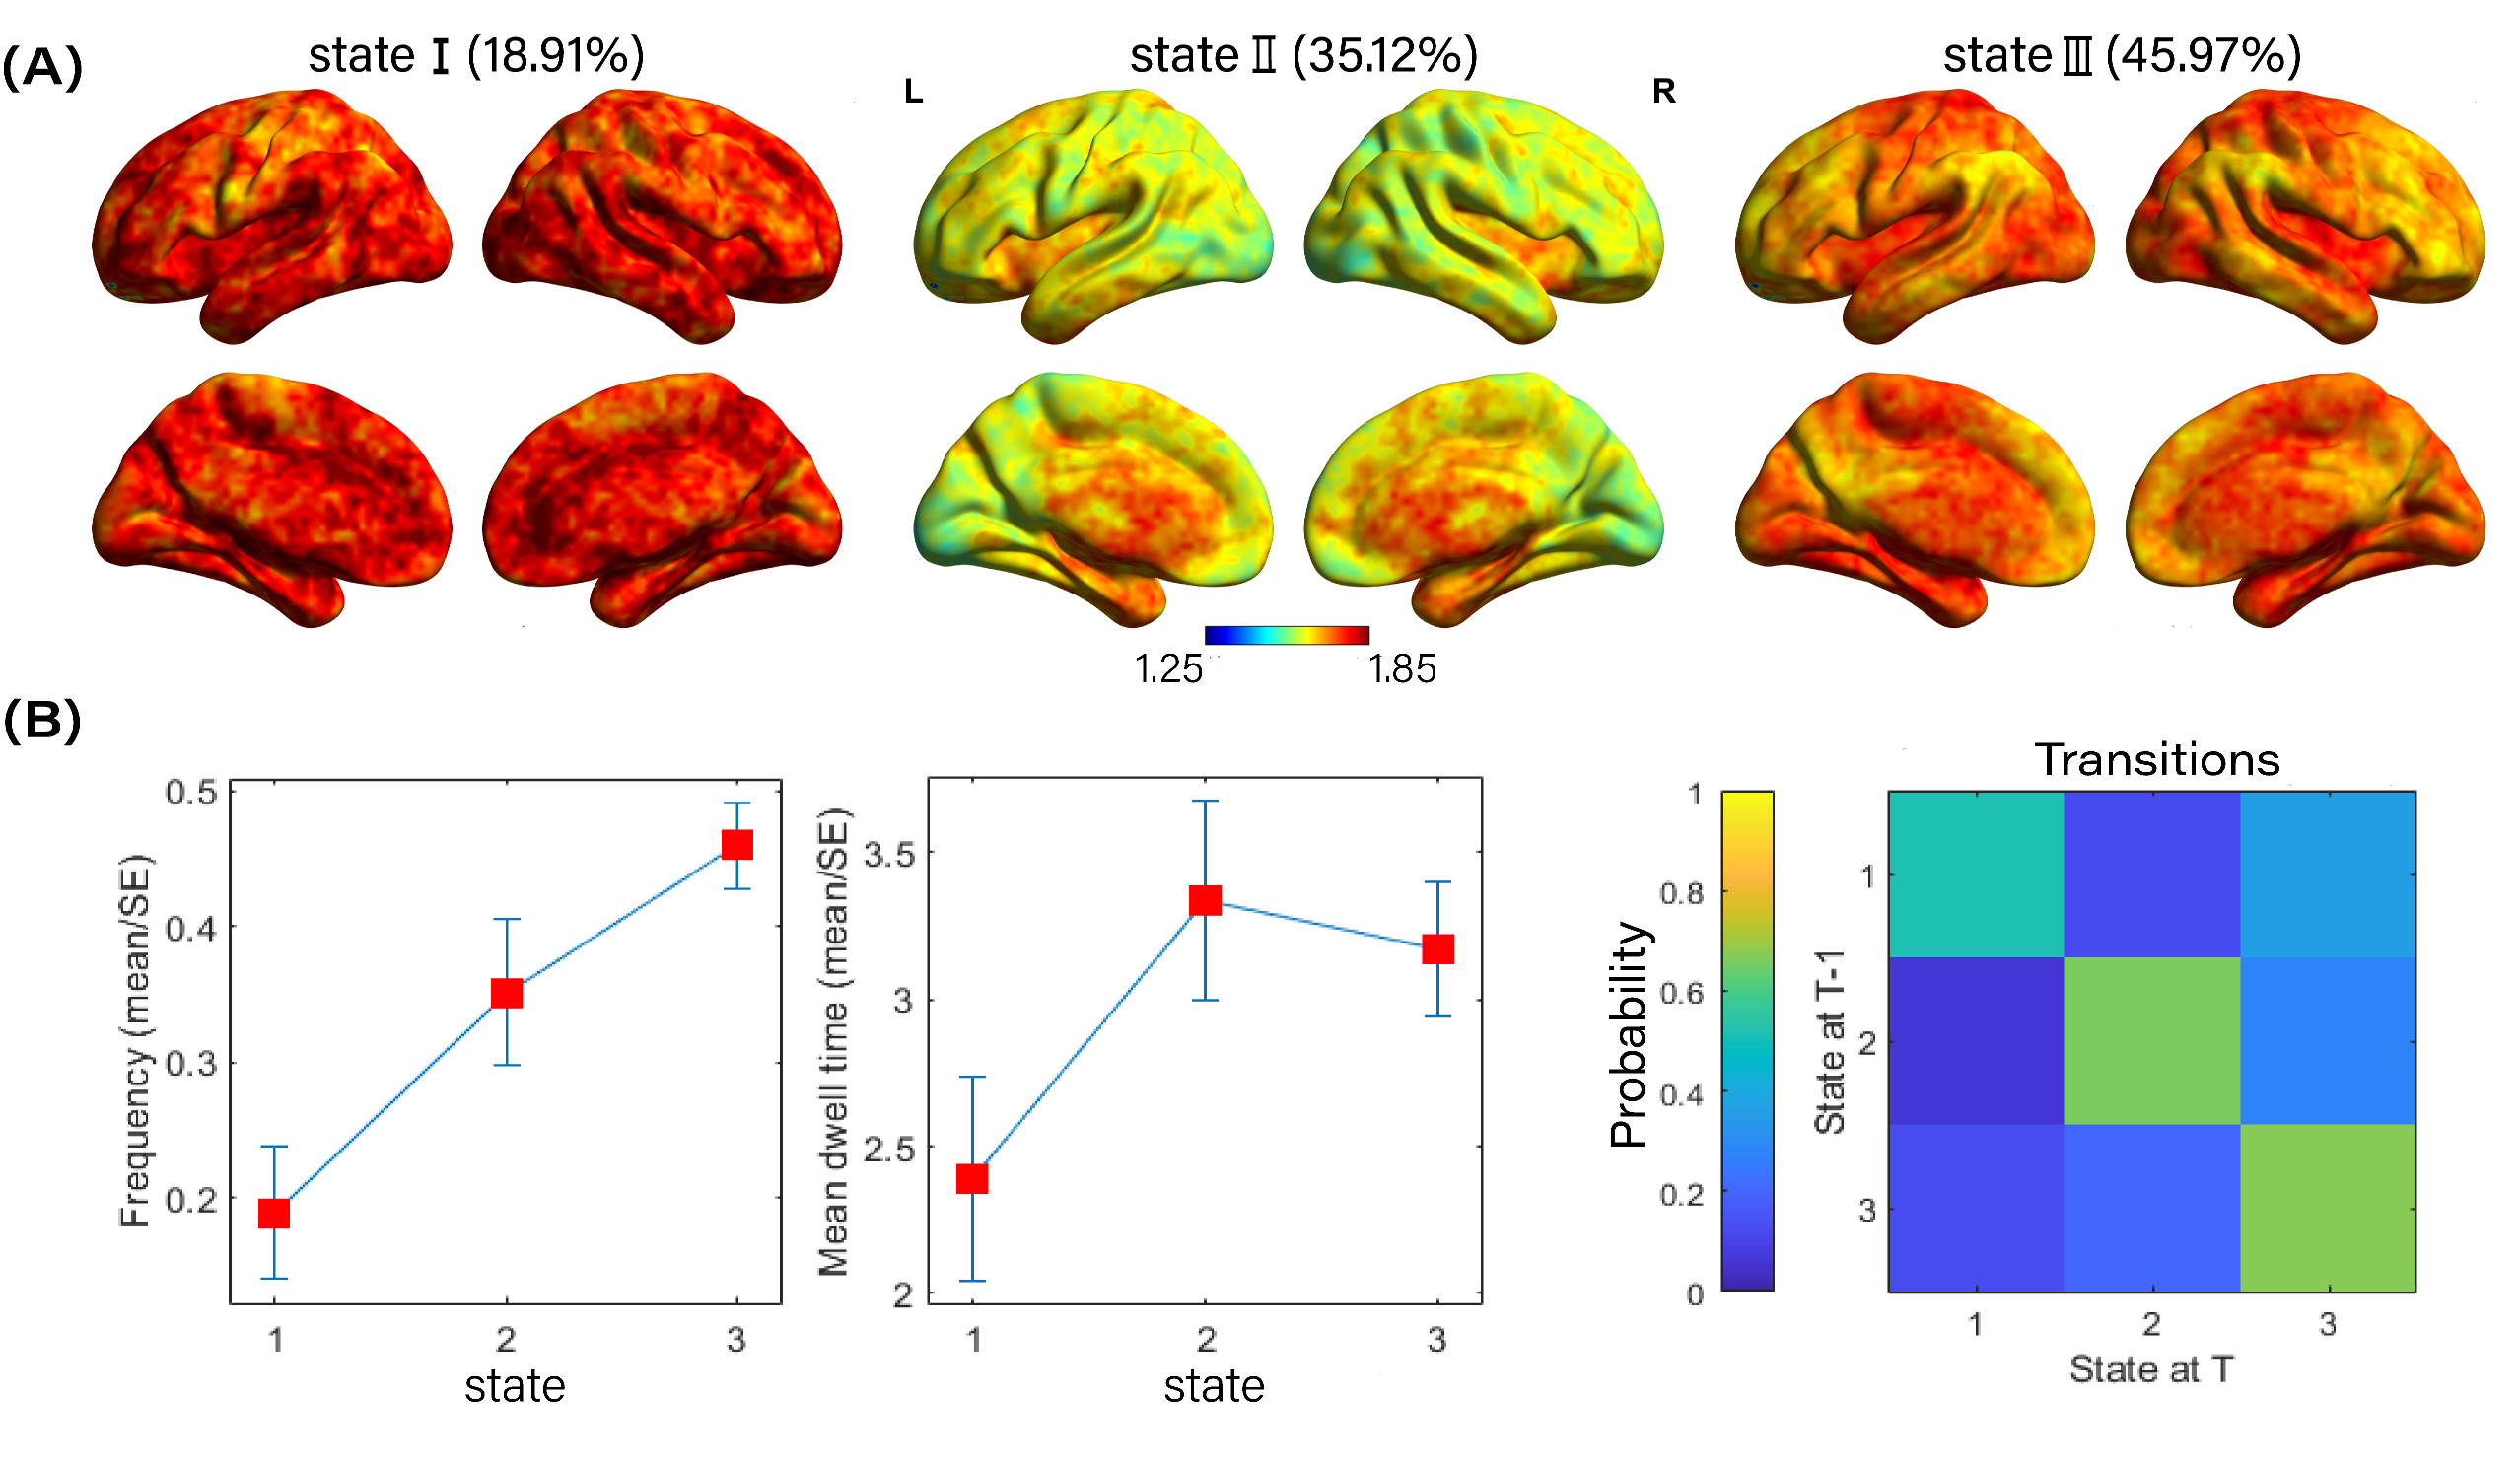
During the 20-minute tDCS, the BEN maps exhibited three states (Figure 4A): State I and State II consistently displayed high and low BEN values throughout the entire brain, respectively. State III revealed lower BEN values in the default mode network (DMN) compared to other regions. The frequency, dwell time, and transition probability of these states indicated a preference for the brain to spend more time in State III during tDCS (Figure 4B).
Discussion and Conclusion
This study, for the first time, used fMRI-based BEN method to investigate the effect of tDCS on V1. We observed an immediate effect following 20-minute anodal tDCS, manifesting as decreased BEN values in the occipital lobe and frontoparietal areas. This finding is consistent with previous reports that a visual stimulation of watching TV induces decreased BEN in the occipital lobe11, and that BEN values are lower during working memory tasks compared to resting state in the frontoparietal areas12, which can alleviate depression and dementia in the elderly13. Furthermore, an accumulating effect was observed, showing decreased BEN in regions including the middle temporal gyrus, angular gyrus, superior occipital gyrus, and medial superior frontal gyrus after one and two weeks, implying the potential of tDCS on V1 in the treatment of bipolar disorder, where these regions exhibit higher BEN values than in controls14. Importantly, we revealed that during tDCS, the brain frequently remained in a state characterized by lower BEN in the DMN, a network implicated in perception, self-referential processing, and episodic memory retrieval functions15,16. This suggests that the brain displays more regular neuroactivity during tDCS, leading to improved concentration and fewer distracting thoughts17, which could be beneficial for individuals with mental illnesses.Acknowledgements
This research is supported by the Fundamental Research Funds for the Central Universities (226-2023-00091).
References
1. Wei, Y., Duan, J., Womer, F. Y., et al. (2020). Applying dimensional psychopathology: transdiagnostic associations among regional homogeneity, leptin and depressive symptoms. Translational Psychiatry, 10(1), 248. https://doi.org/10.1038/s41398-020-00932-0
2. Ghobadi-Azbari, P., Jamil, A., Yavari, F., et al. (2020). fMRI and Transcranial Electrical Stimulation (tES): A systematic review of parameter space and outcomes. Retrieved from https://doi.org/10.1101/2020.06.03.20121202
3. Knotkova, H., Nitsche, M., Bikson, M., & Woods, A. (2019). Practical Guide to Transcranial Direct Current Stimulation Principles, Procedures and Applications: Principles, Procedures and Applications. Springer.
4. Wang, D., Tang, L., Xi, C., et al. (2023). Targeted visual cortex stimulation (TVCS): a novel neuro-navigated repetitive transcranial magnetic stimulation mode for improving cognitive function in bipolar disorder. Translational Psychiatry, 13(1), 193. https://doi.org/10.1038/s41398-023-02498-z
5. Olkoniemi, H., Hurme, M., & Railo, H. (2023). Neurologically Healthy Humans' Ability to Make Saccades Toward Unseen Targets. Neuroscience, 513, 111-125. ISSN 0306-4522. https://doi.org/10.1016/j.neuroscience.2023.01.014
6. Wang, Z., Li, Y., Childress, A. R., & Detre, J. A. (2014). Brain Entropy Mapping Using fMRI. PLoS ONE, 9(3), e89948. https://doi.org/10.1371/journal.pone.0089948
7. Song, D., Chang, D., Zhang, J., Ge, Q., Zang, Y. F., & Wang, Z. (2019). Associations of brain entropy (BEN) to cerebral blood flow and fractional amplitude of low-frequency fluctuations in the resting brain. Brain Imaging Behav, 13(5), 1486-1495. https://doi.org/10.1007/s11682-018-9963-4
8. Yan, C. G., Wang, X. D., Zuo, X. N., & Zang, Y. F. (2016). DPABI: Data Processing & Analysis for (Resting-State) Brain Imaging. Neuroinformatics, 14(3), 339-351. https://doi.org/10.1007/s12021-016-9299-4
9. Wang, Z., Li, Y., Childress, A. R., & Detre, J. A. (2014). Brain entropy mapping using fMRI. PLoS ONE, 9(3), e89948. https://doi.org/10.1371/journal.pone.0089948
10. Liao, W., Wu, G. R., Xu, Q., Ji, G. J., Zhang, Z., Zang, Y. F., & Lu, G. (2014). DynamicBC: a MATLAB toolbox for dynamic brain connectome analysis. Brain Connect, 4(10), 780-790. https://doi.org/10.1089/brain.2014.0253
11. Chen, C., Li, J., Lu, X., et al. (2018). Multiscale entropy-based analysis and processing of EEG signal during watching 3DTV. Measurement, 125, 432-437. https://doi.org/10.1016/j.measurement.2018.04.029
12. Nezafati Maysam, Temmar Hisham, Keilholz Shella D. (2020). Functional MRI Signal Complexity Analysis Using Sample Entropy. Frontiers in Neuroscience, 14. https://doi.org/10.3389/fnins.2020.00700
13. Chemin Lin, Shwu-Hua Lee, Chih-Mao Huang, Guan-Yen Chen, Pei-Shan Ho, Ho-Ling Liu, Yao-Liang Chen, Tatia Mei-Chun Lee, Shun-Chi Wu. (2019). Increased brain entropy of resting-state fMRI mediates the relationship between depression severity and mental health-related quality of life in late-life depressed elderly. Journal of Affective Disorders, 250, 270-277. https://doi.org/10.1016/j.jad.2019.03.056
14. Xiang, Jie; Tan, Yuan; Niu, Yan; Sun, Jie; Zhang, Nan; Li, Dandan; Wang, Bin. (2021). Analysis of functional MRI signal complexity based on permutation fuzzy entropy in bipolar disorder. NeuroReport, 32(6), 465-471. https://doi.org/10.1097/WNR.0000000000001617
15. Smallwood, J., Bernhardt, B. C., Leech, R., Bzdok, D., Jefferies, E., & Margulies, D. S. (2021). The default mode network in cognition: a topographical perspective. Nature Reviews Neuroscience, 22(8), 503-513. https://doi.org/10.1038/s41583-021-00474-4
16. Yeshurun, Y., Nguyen, M., & Hasson, U. (2021). The default mode network: where the idiosyncratic self meets the shared social world. Nature Reviews Neuroscience, 22(3), 181-192. https://doi.org/10.1038/s41583-020-00420-w
17. Song, D., Chang, D., Zhang, J., et al. (2019). Reduced brain entropy by repetitive transcranial magnetic stimulation on the left dorsolateral prefrontal cortex in healthy young adults. Brain Imaging and Behavior, 13(2), 421-429. https://doi.org/10.1007/s11682-018-9866-4
Figures
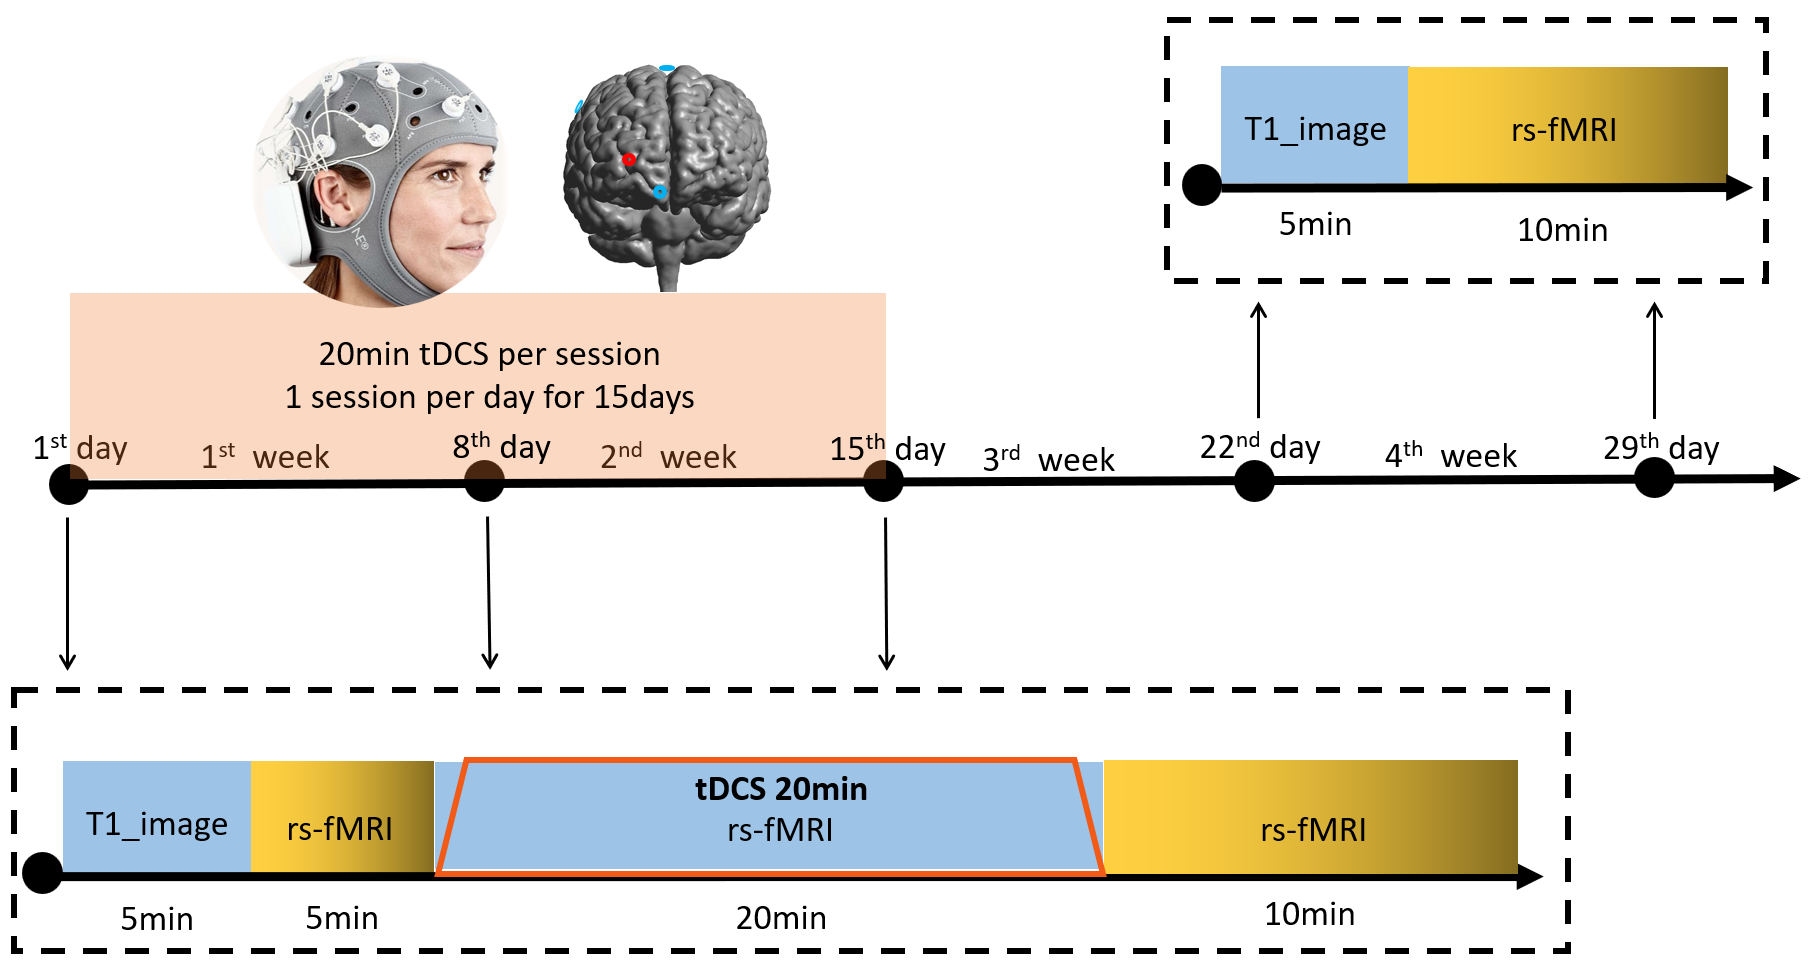
Figure 1. The pipeline of entire experiment. The entire experiment consists of fifteen days of stimulation with 3 sessions and two weeks of follow-up. In each session, all subjects received 2 mA tDCS for 20 minutes and experienced three MRI scanning at the 1st, 8th and 15th day, respectively. Each scan included T1-weight imaging, and rs-fMRI before, during and after 20-minute tDCS. In follow-up, no stimulation were performed, while T1-weight and rs-fMRI data were collected at the 22nd and 29th day, respectively.
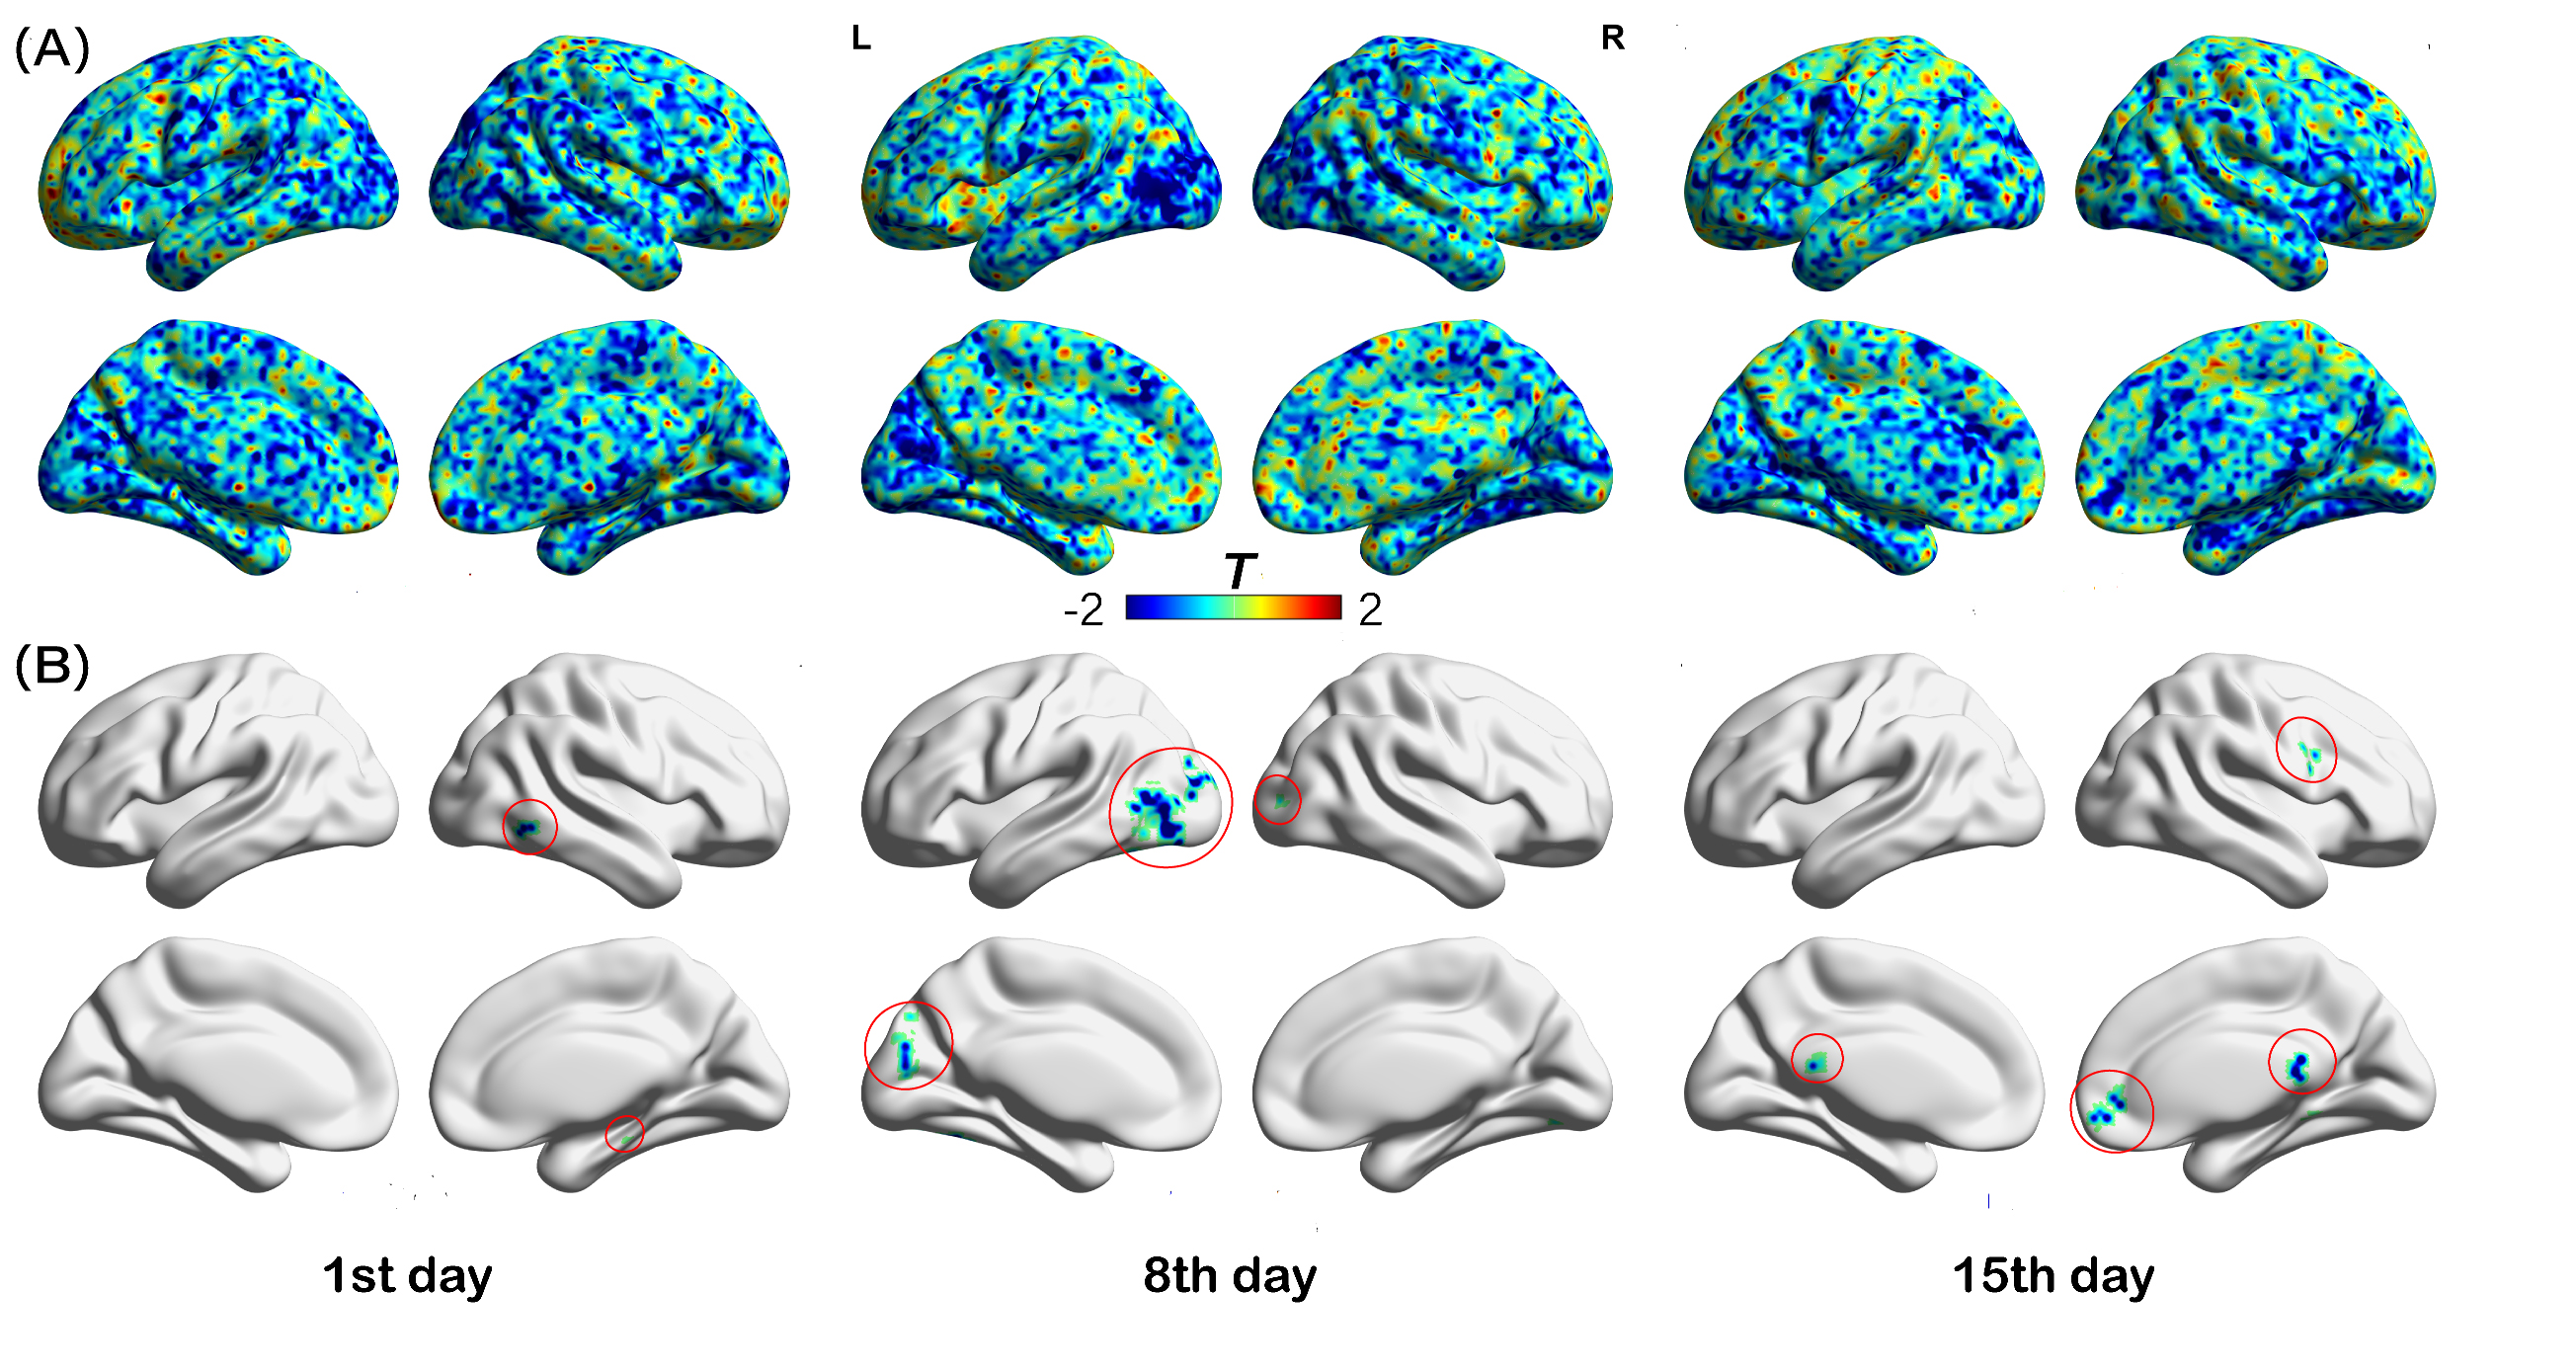
Figure 2. The differences of BEN maps before and after 20-minute tDCS on V1 (short term). (A) and (B) shows t maps after paired t-test of BEN maps before and after tDCS at the 1st, 8th, and 15th day without and with GRF correction (survived regions are labeled within red circles), respectively. Red and blue on color bar represent the BEN value increase and decrease after tDCS, respectively. The BEN decreased in temporal lobe after the first short-term stimulation, in bilateral occipital lobe after the second one, and in bilateral frontoparietal area after the third one.
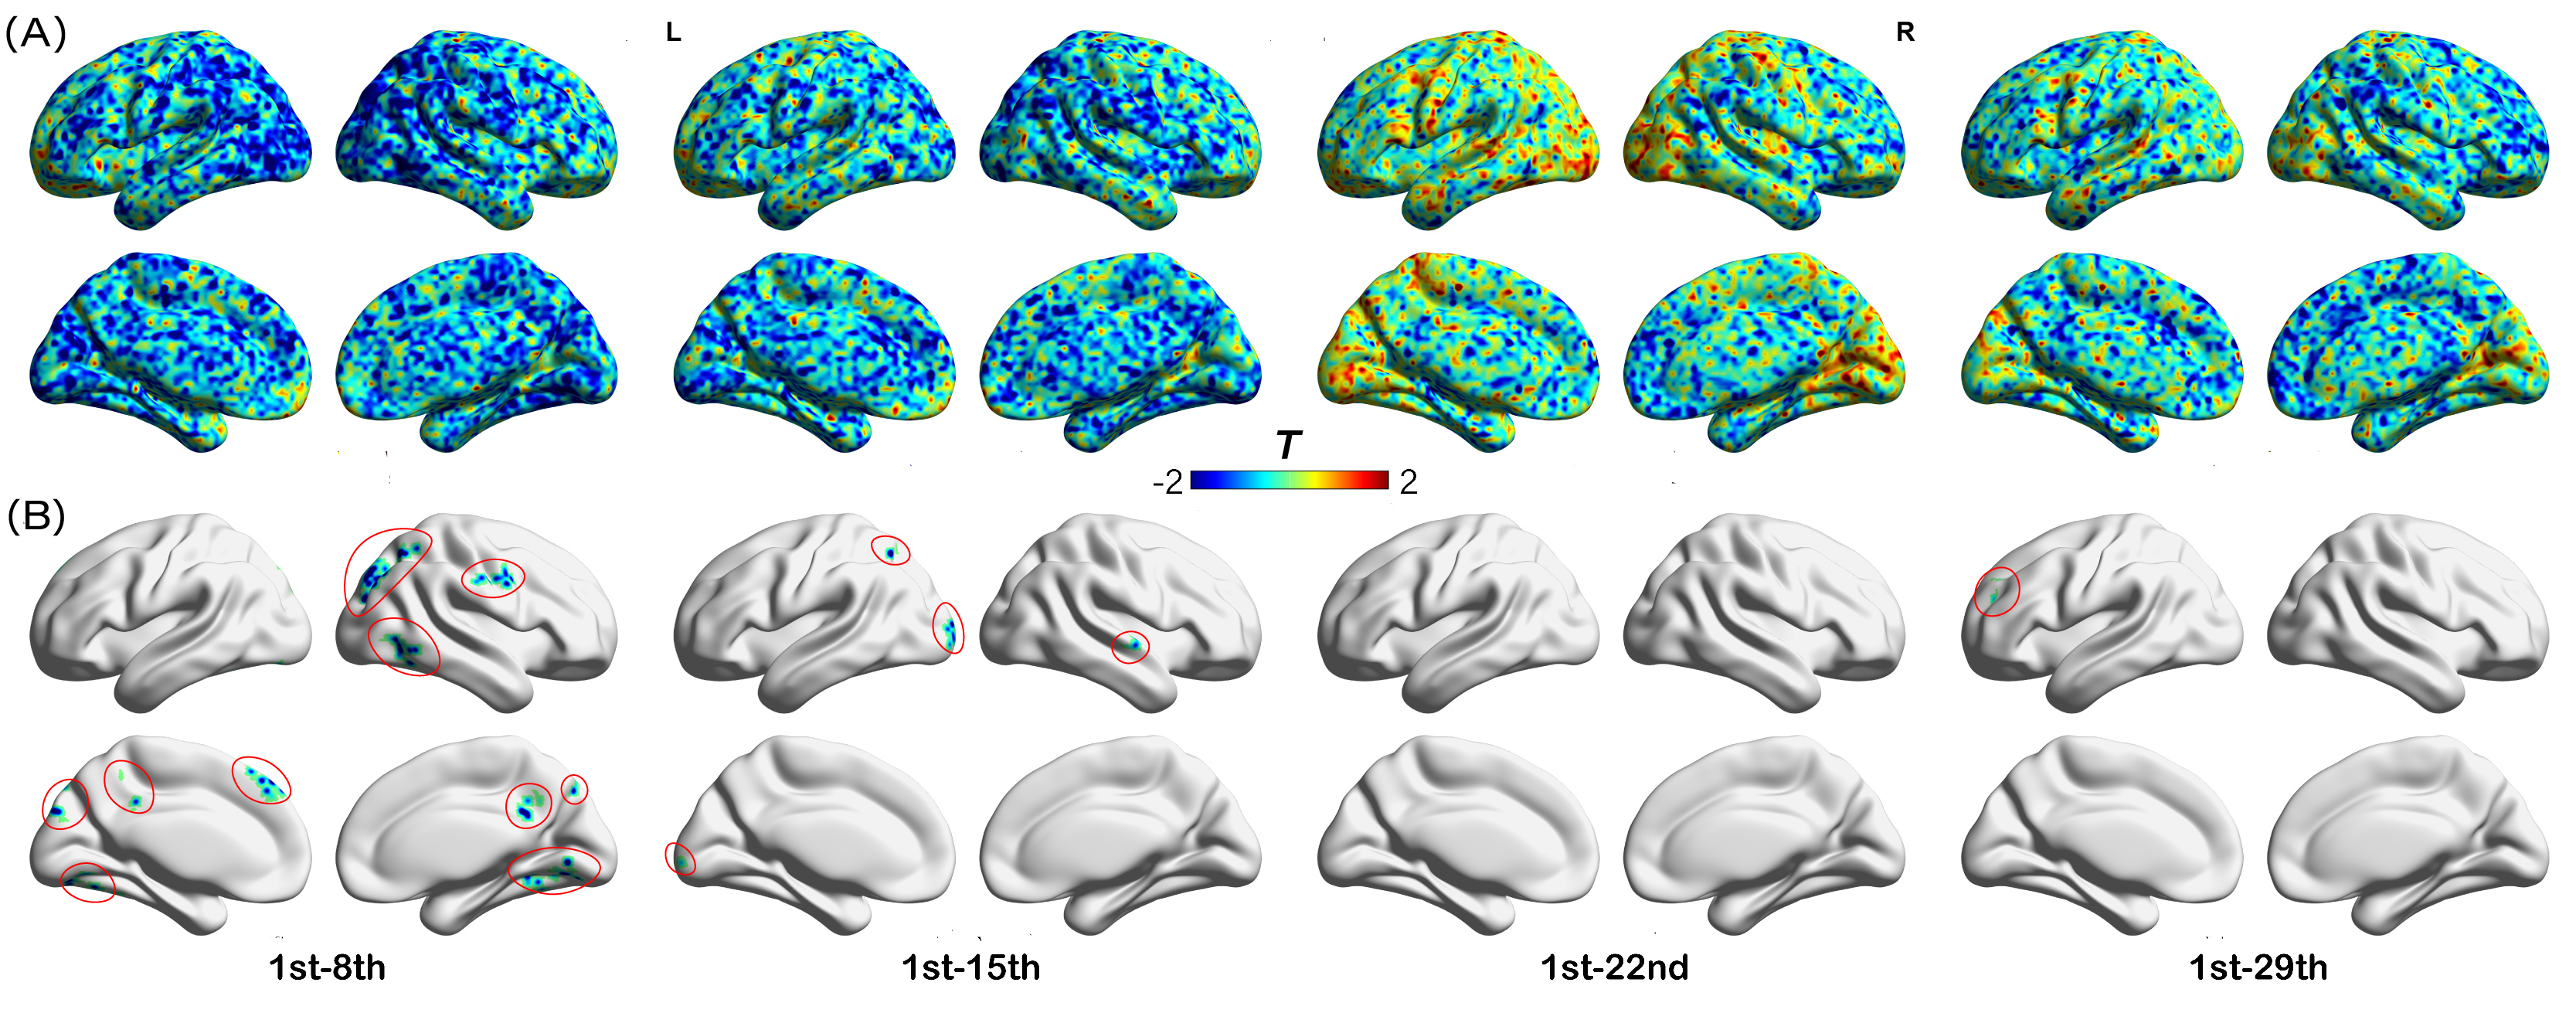
Figure 3. The BEN change induced by long-term tDCS on V1. (A) and (B) shows t maps after paired t-test of BEN maps between 1st day and 8th day, 15th day, 22nd day, 29th day without and with GRF correction (survived regions are labeled within red circles), respectively. The BEN decreased in occipital lobe, primary motor cortex, temporal lobe, and frontoparietal area after one week of tDCS and in inferior parietal lobe, superior temporal gyrus and occipital lobe after two weeks of tDCS. Almost no BEN changes in follow-up period.