2718
Optimizing catheter based pulse application for intra-Arterial-Spin-Labeling in coronary arteries1Division of Medical Physics, Dept. of Diagnostic and Interventional Radiology, University Medical Center Freiburg, Faculty of Medicine, University of Freiburg, Freiburg, Germany, 2Dept. of Cardiology, University Medical Center Freiburg, Faculty of Medicine, University of Freiburg, Freiburg, Germany
Synopsis
Keywords: Interventional Devices, Interventional Devices, Arterial Spin Labeling
Motivation: Intra-Arterial-Spin Labeling (iASL) could offer an alternative for myocardial perfusion measurements without the use of contrast agents by labeling blood with a catheter transmit RF-coil.
Goal(s): To study the parameters influencing the iASL labeling efficiency inside the artery to improve the SNR.
Approach: The complex iASL process is investigated with simulations and in-vitro measurements for different coil geometries (solenoid, loop), driving currents, coil orientations relative to the magnetic field, and blood flow velocities.
Results: The simulations were in good agreement with measurements, show a maximal mean flip angle created by the labeling pulse of 105°, and a threshold behavior for the transmit current.
Impact: The improvement of the labeling process inside coronary arteries started in this study, is an important step towards making ASL a viable method for myocardial perfusion quantification.
Introduction
Regional perfusion assessment in the myocardium is a crucial diagnostic tool for ischemic heart disease. In interventional MRI underperfused ischemic areas supplied by an individual artery can be identified by injection of Gadolinium-based contrast agents1,2; however, injections cannot be repeated very often due to the accumulation of the contrast agent. Arterial spin labeling (ASL) is an alternative for perfusion quantification: here, the blood itself is labeled by an RF pulse eliminating the need for potentially nephrotoxic contrast agent injections3. Recently we proposed intra-Arterial Spin Labeling (iASL), where the labeling pulse is applied from inside the artery by transmitting the pulse via a small transmit coil at the catheter tip4. In this study, the complex iASL process inside the artery is simulated, and in-vitro measurements are performed to find the best coil geometry and to optimize the RF pulse shape.Methods
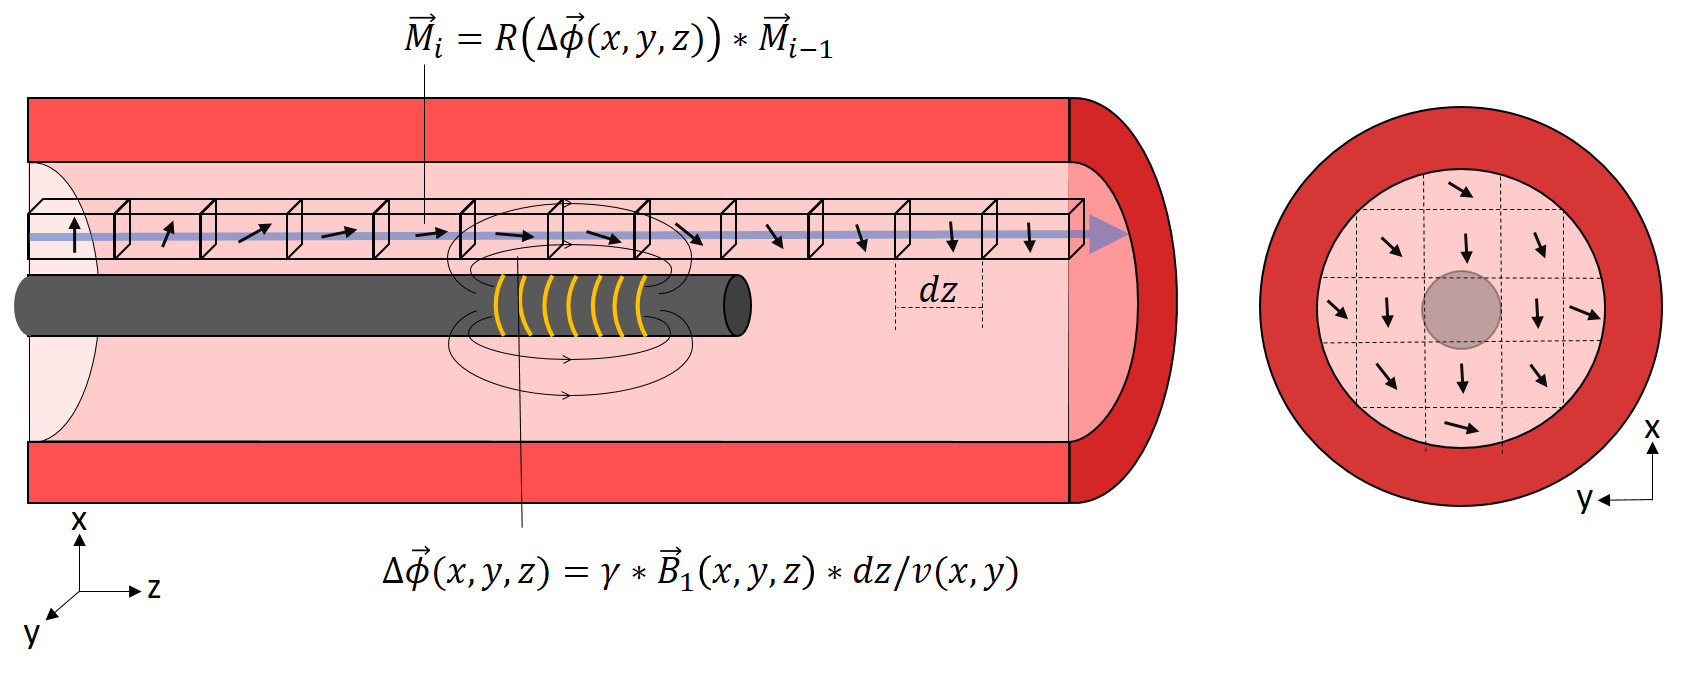
The labeling process was simulated in MATLAB. First, the B1-field of a coil at the catheter tip was calculated using Biot-Savarts law (i.e., the coil dimensions are assumed to be much smaller than the RF wavelength). Then, the dynamic change of the magnetization M flowing through this B1-field was computed. In each voxel, the RF-induced rotation angle of M were calculated from the local transverse B1-component of the RF field, the flow velocity and the voxel size: $$\Delta \vec{\phi}(x,y,z)=\gamma \cdot \vec{B}_1(x,y,z) \cdot \frac{dz}{v(x,y)}$$The flow velocity around the catheter (Ø 2 mm) inside the vessel (Ø 6 mm) was calculated using the Navier-Stokes equation. The flow was assumed to be laminar. A schematic of the simulation is shown in Figure 1. Inside a vessel cross section - downstream of the coil - an effective flip angle map was calculated for the magnetization, and the mean flip angle $$$\phi_{mean}$$$ across the vessel was used as a measure of the labeling efficiency. Two types of coils were simulated: a rectangular single loop (length: 20 mm, width: 2.1 mm) and a solenoid coil (length: 5 mm, diameter: 2.1 mm, number of windings: 7). The current inside the coil, the flow velocity around the coil and the orientation of the coil relative to B0 were varied to investigate their influence on the labeling efficiency. The simulation results were compared to phantom measurements at a 3T clinical MRI system (Siemens Prisma Fit). Therefore, both coil geometries were built from enameled copper wire (Ø 0.15 mm), connected with a micro-coaxial cable via a tuning/matching circuit to an RF signal generator (KEYSIGHT EXG Analog Signal Generator N5171B). The coils were mounted at the center of a tube (Ø 6 mm) on a 3D-printed holder with outer dimensions of a 6F catheter. A constant water flow of 2 ml/s was created by gravitational pressure difference. The signal in a cross section 3 cm downstream of the coil was measured for different RF currents in the coil and compared to the simulation results. The coil was positioned at a 70° angle to B0, which corresponds to the typical position of a coronary guiding catheter in the left coronary ostium.
Results
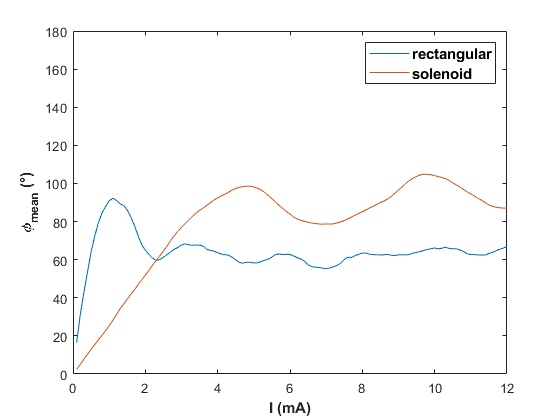
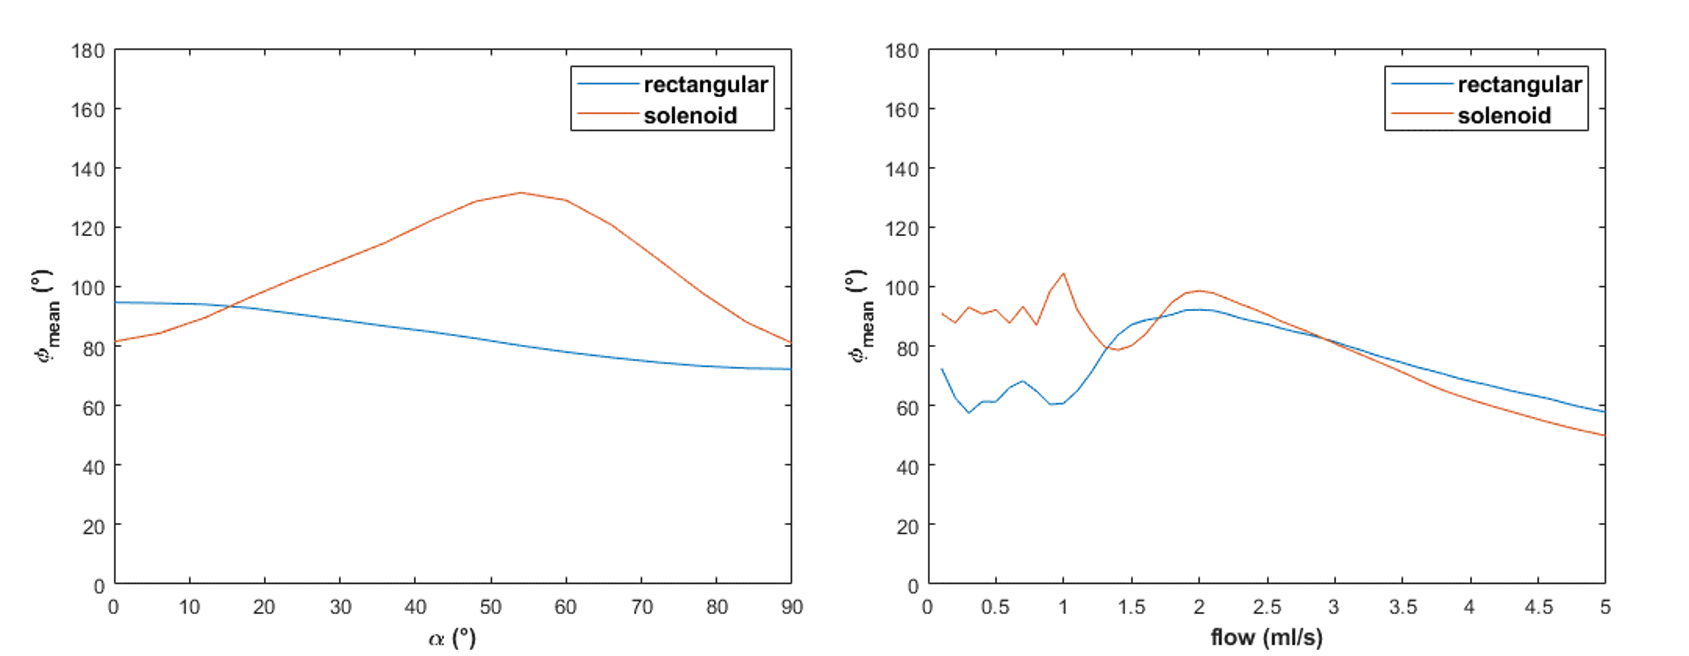
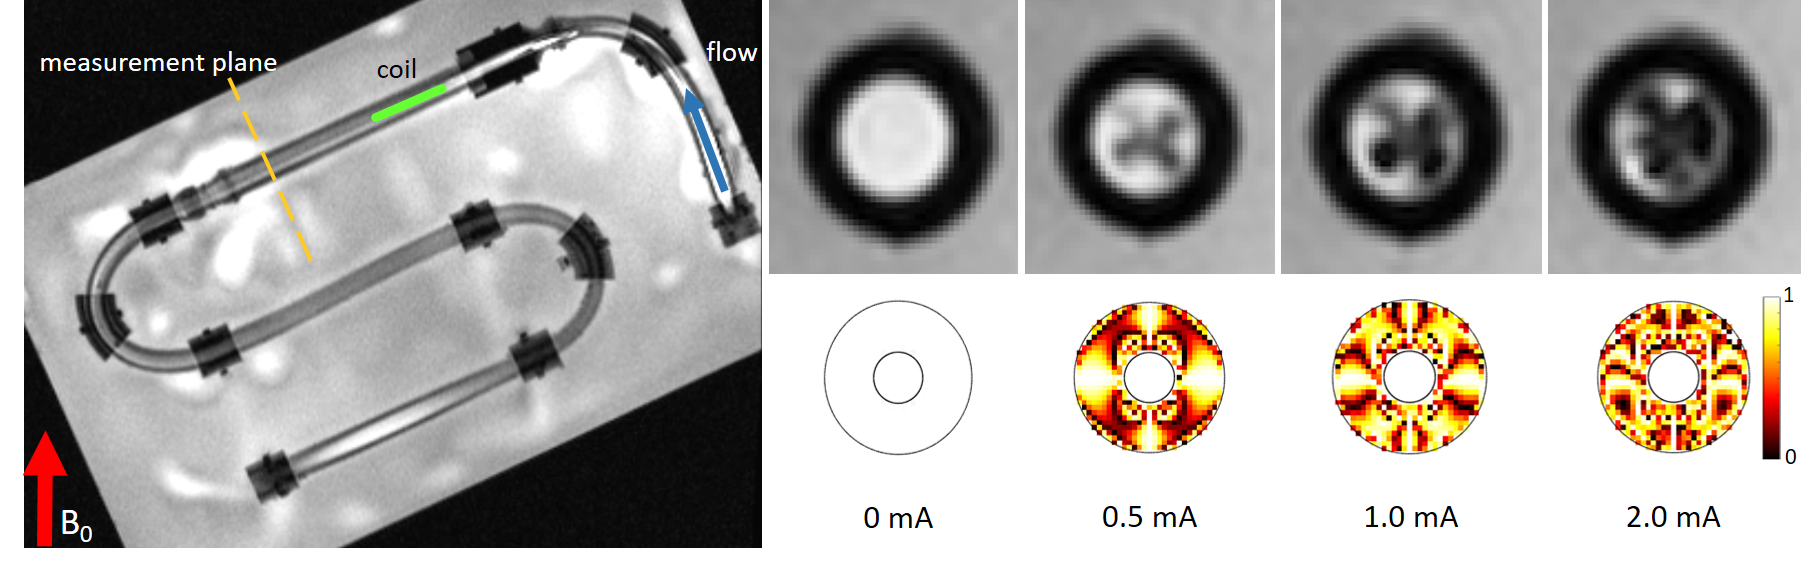
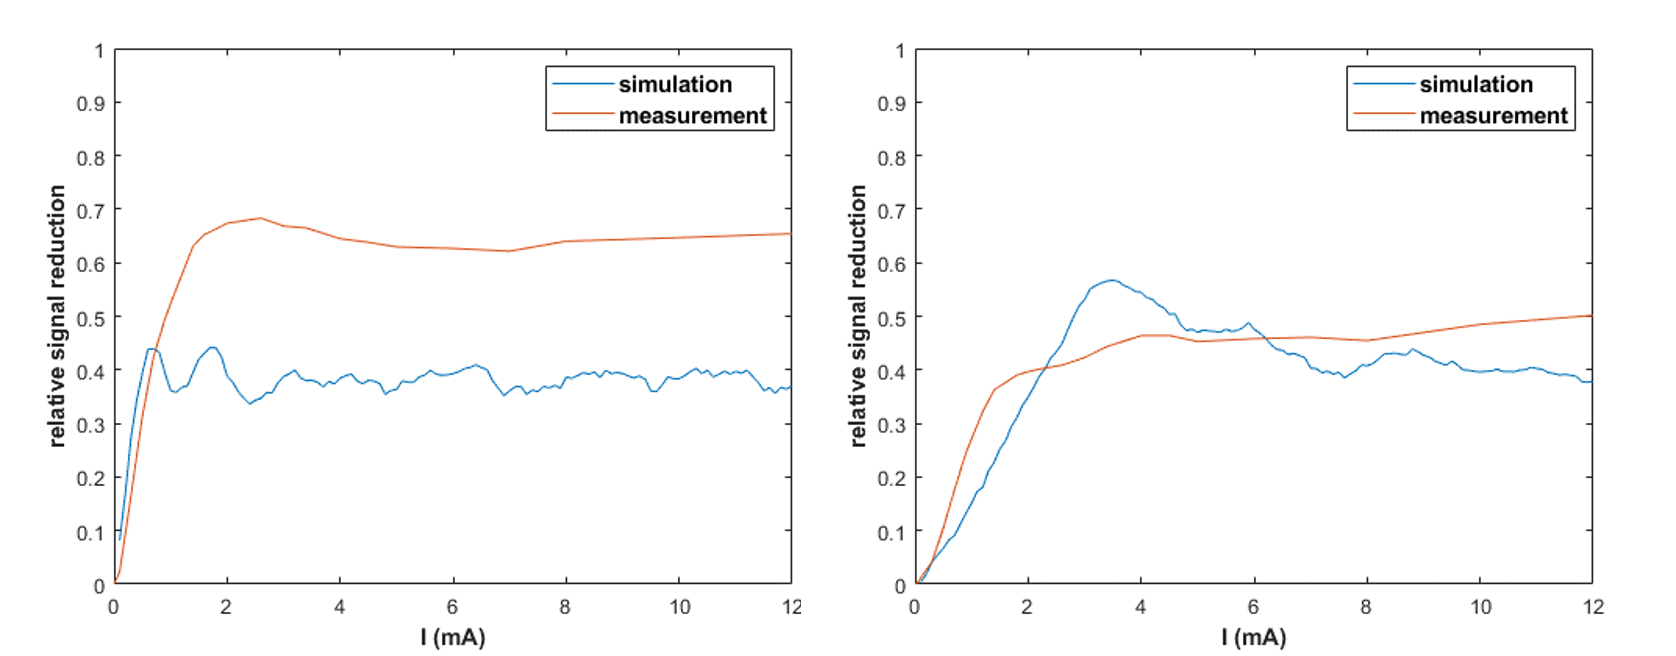
The mean simulated flip angle for the 2 coil geometries is shown in Figure 2 as a function of the RF current. A maximal angle of 105° is reached for the solenoid coil whereas the maximum for the rectangular coil was 92°. The flip angle dependency on the orientation and the flow velocity are shown in Figure 3. Interestingly, only small differences are present between the coil geometries even though they create substantially different B1 profiles. For the rectangular coil the measured signal pattern in a downstream vessel cross section agrees well with the simulation (Fig. 4). The signal reduction between labeled and reference image is shown in Fig. 5.Discussion & Conclusion
Based in this study the labeling efficiency of common catheter coil geometries is limited to a mean flip angle of about 105°, which is reached for a solenoid coil with 7 windings stretched over 5 mm mounted on a 6F catheter and an applied current of 10 mA. This can be explained by the inhomogeneous labeling over the cross section of the artery, the flow velocity profile and the confined geometry of catheter coils. The phantom measurements agree well with the simulations, and the small differences can be attributed to the limitations of the flow model and inaccuracies of the coil positioning. The simulation framework will thus be used to optimize coil geometries and transmit pulse shapes for in-vivo iASL experiments in a porcine model.Acknowledgements
Grant support by the German Research Foundation (DFG) under RE 4876/1-1 is gratefully acknowledged. This study is part of SFB1425 project P15, funded by the Deutsche Forschungsgemeinschaft (DFG, German Research Foundation #422681845).References
1. Heidt, T. et al. Real-time magnetic resonance imaging – guided coronary intervention in a porcine model. Sci Rep 9, 8663 (2019).
2. Heidt, T. et al. Magnetic resonance imaging for pathobiological assessment and interventional treatment of the coronary arteries. Eur Heart J Suppl 22, C46–C56 (2020).
3. Kober, F., Jao, T., Troalen, T. & Nayak, K. S. Myocardial arterial spin labeling. Journal of Cardiovascular Magnetic Resonance 18, 22 (2016).
4. Reiss, S. et al. Quantifying myocardial perfusion during MR-guided interventions without exogenous contrast agents: intra-arterial spin labeling. Zeitschrift für Medizinische Physik S0939388923000028 (2023) doi:10.1016/j.zemedi.2023.01.002.
Figures