2714
Multi-Modality Imaging and Analysis of Mouse Cortex after Focused Ultrasound-Induced Blood-Brain Barrier Opening.1Biomedical Engineering, University of Arizona, Tucson, AZ, United States, 2Wyatt College of Optical Sciences, University of Arizona, Tucson, AZ, United States, 3Medical Imaging, University of Arizona, Tucson, AZ, United States
Synopsis
Keywords: MR-Guided Focused Ultrasound, Focused Ultrasound, 2-photon microscopy
Motivation: The gold-standard for confirmation of blood-brain barrier (BBB) disruption after FUS is T1-weighted MRI with contrast enhancement. Conventional MRI-based metrics cannot differentiate between BBB leakage at the microvascular level, and thus there is a need for validation with higher spatial and temporal resolution modalities
Goal(s): Use 2-photon microscopy to investigate solute extravasation from the microvasculature into the parenchyma and paravascular space.
Approach: This project is an in-vivo validation of BBB opening after FUS using 2-photon microscopy and MRI.
Results: Results suggest BBB opening occurs in capillaries, and that dye extravasation can be measured within minutes of sonication.
Impact: Sub-micron imaging of the microvasculature after BBB opening will provide insight into which vessels are opened after FUS and improve pharmacokinetic understanding of the paravascular space around arterioles and venules.
Introduction
Introduction: Focused ultrasound (FUS) has been introduced as a novel method of transiently opening the blood-brain barrier (BBB) for drug delivery and therapy in neurodegenerative disease1. The gold-standard for confirmation of BBB opening after FUS is T1-weighted MRI with gadolinium-based contrast agent (GBCA) enhancement. While this method provides reliable and accurate localization of BBB opening within the brain2,3,4,5, MRI does not have the spatial resolution to resolve local distribution or kinetics of solute delivery to the brain tissue6. Currently, it is not established which vessels are opened or the spatiotemporal distribution of solutes relative to the targeted cells. In vivo 2-photon microscopy (2PM) can be used to investigate microvascular changes in the cortex after FUS and can be used in combination with MRI to better understand the effect of FUS on tissue microvasculature and parenchymal kinematics. Results from such multimodality experiments are presented here, where FUS, MRI and 2PM are carried out in the brains of mice to investigate the effects of FUS on microvasculature and the movement of molecules across the BBB.Methods
Methods: All experimental procedures were performed at the University of Arizona Translational Bioimaging Resource under approved IACUC protocols. C57BL/6 mice underwent focused ultrasound following the procedure outlined in previous work7. The mice were sonicated using a 2.1 MHz single-element transducer for 30 seconds with 0.01 kw/cm2 power and 1% duty cycle. After sonication, mice received an intraperitoneal (IP) injection of Multihance GBCA and placed in the Bruker BioSpec 7T preclinical MRI scanner for confirmation of BBB opening. Transverse T1-weighted (T1W, TR/TEeffective = 600/8 ms, echo train length = 2, ESP = 8 ms, 16 averages, FOV = 12.8 mm x 25.6 mm x 12.6 mm, 200 x 200 μm in-plane resolution, 0.6 mm slice thickness, 21 contiguous slices, scan time = 5:07 min:sec) and coronal T1W (TR/TEeffective = 600/8 ms, echo train length = 2, ESP = 8 ms, 8 averages, FOV = 19.2 mm x 12.8 mm, 100 x 100 μm in-plane resolution, 0.6 mm slice thickness, 21 contiguous slices, scan time = 5:07 min:sec) images were acquired.For 2PM, 6 control and 6 FUS-treated C57BL/6 mice underwent a skull thinning procedure8. 2PM experimental procedure is outlined in figure 1. A tail-vein catheter was placed, and 3 kDa fluorescently-labeled dextran (Rhodamine, Ex/Em = 545/566 nm) was injected intravenously (IV). A Z-stack (FOV = 400 x 400 μm2, 0.78 x 0.78 μm2 in-plane resolution, 1 μm step size, 200 steps. Frame rate = 824.73 ms) was acquired before and after FUS. A rapid 2D timeseries (FOV = 400 x 400 μm2, 1.57 x 1.57 μm2 resolution, 300 images, 306.59 ms per image) was acquired during a bolus IV injection of 40 kDa fluorescently-labeled dextran (FITC, Ex/Em = 490/525 nm) for short time-scale dye extravasation and identifying arterioles and venules. A second 2D timeseries was collected at higher resolution for 5 minutes (FOV = 400 x 400 μm2, 0.78 x 0.78 μm2 resolution, 375 images, 824.73 ms/image). After the 2D time series, Z-stacks were acquired every 5 minutes for 1 hour post injection.
Results
Results: Application of FUS and microbubbles resulted in consistent and repeatable BBB opening (figure 2). T1W hyperintensities in the region of sonication indicate that GBCA extravasated into the parenchyma within 10 minutes of sonication (figure 2). Difference maps from pre- and post-FUS 2PM experiments show dye leakage into the brain parenchyma after FUS in a non-homogeneous pattern (figure 3). Analysis of intensity profiles in paravascular and parenchymal regions shows consistent dye extravasation within 5 minutes after IV injection for the parenchyma but not for the paravascular space (figure 4). Long term imaging of fluorescence intensity over hours does not show differences between control and FUS groups (figure 5).Discussion
Discussion: Utilizing a multi-modality approach to supplement conventional T1W contrast-enhanced MRI with 2PM yields new insight into microvascular changes after FUS. Most notably, in the region of BBB opening, paravascular (arteriole and venule) spaces did not increase in fluorescence after a bolus injection of labeled dextran, but parenchymal spaces did. This suggests that capillaries are preferentially opened during FUS, and not arterioles or venules, and that dye extravasation can be measured within minutes of sonication.Acknowledgements
Acknowledgements: Research reported in this publication was supported by the National Institute of Aging of the National Institutes of Health under award number T32AG082631-01. This research was also supported by the Arizona Alzheimer’s Consortium.
References
1. Hynynen, K., McDannold, N., Vykhodtseva, N., & Jolesz, F. A. (2001). Noninvasive MR imaging–guided focal opening of the blood-brain barrier in rabbits. Radiology, 220(3), 640-646.
2. Liu, X., Naomi, S. S. M., Sharon, W. L., & Russell, E. J. (2021). The Applications of Focused Ultrasound (FUS) in Alzheimer’s Disease Treatment: A Systematic Review on Both Animal and Human Studies. Aging and disease, 12(8), 1977.
3. Downs, M. E., Buch, A., Sierra, C., Karakatsani, M. E., Chen, S., Konofagou, E. E., et al. (2015). Long-Term Safety of Repeated Blood-Brain Barrier Opening via Focused Ultrasound with Microbubbles in Non-Human Primates Performing a Cognitive Task. PLOS ONE, 10(5), e0125911.
4. Jordão, J. F., Ayala-Grosso, C. A., Markham, K., Huang, Y., Chopra, R., Mclaurin, J., et al. (2010). Antibodies Targeted to the Brain with Image-Guided Focused Ultrasound Reduces Amyloid-β Plaque Load in the TgCRND8 Mouse Model of Alzheimer's Disease. PLoS ONE, 5(5), e10549.
5. Lipsman, N., Meng, Y., Bethune, A. J., Huang, Y., Lam, B., Masellis, M., et al. (2018). Blood–brain barrier opening in Alzheimer’s disease using MR-guided focused ultrasound. Nature Communications, 9(1).
6. Cho, E. E., Drazic, J., Ganguly, M., Stefanovic, B., & Hynynen, K. (2011). Two-photon fluorescence microscopy study of cerebrovascular dynamics in ultrasound-induced blood—brain barrier opening. Journal of Cerebral Blood Flow & Metabolism, 31(9), 1852-1862.
7. Valdez, M. A., Fernandez, E., Matsunaga, T., Erickson, R. P., & Trouard, T. P. (2020). Distribution and Diffusion of Macromolecule Delivery to the Brain via Focused Ultrasound using Magnetic Resonance and Multispectral Fluorescence Imaging. Ultrasound in Medicine & Biology, 46(1), 122-136.
8. Yoder, E. J., & Kleinfeld, D. (2002). Cortical imaging through the intact mouse skull using two-photon excitation laser scanning microscopy. Microscopy research and technique, 56(4), 304-305.
Figures
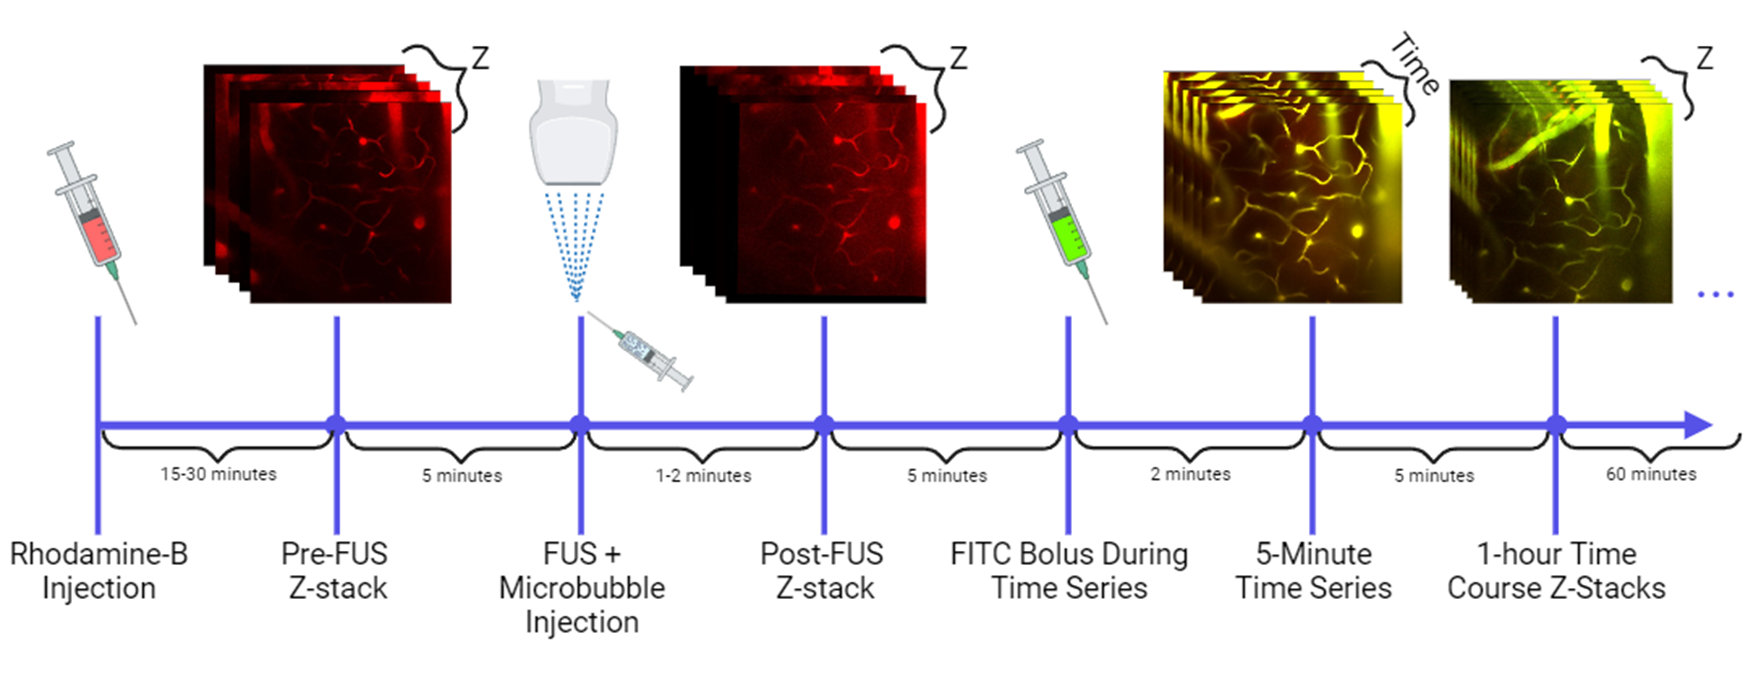
Figure 1: Experimental timeline of 2PM and FUS for short and long timescale dynamics.
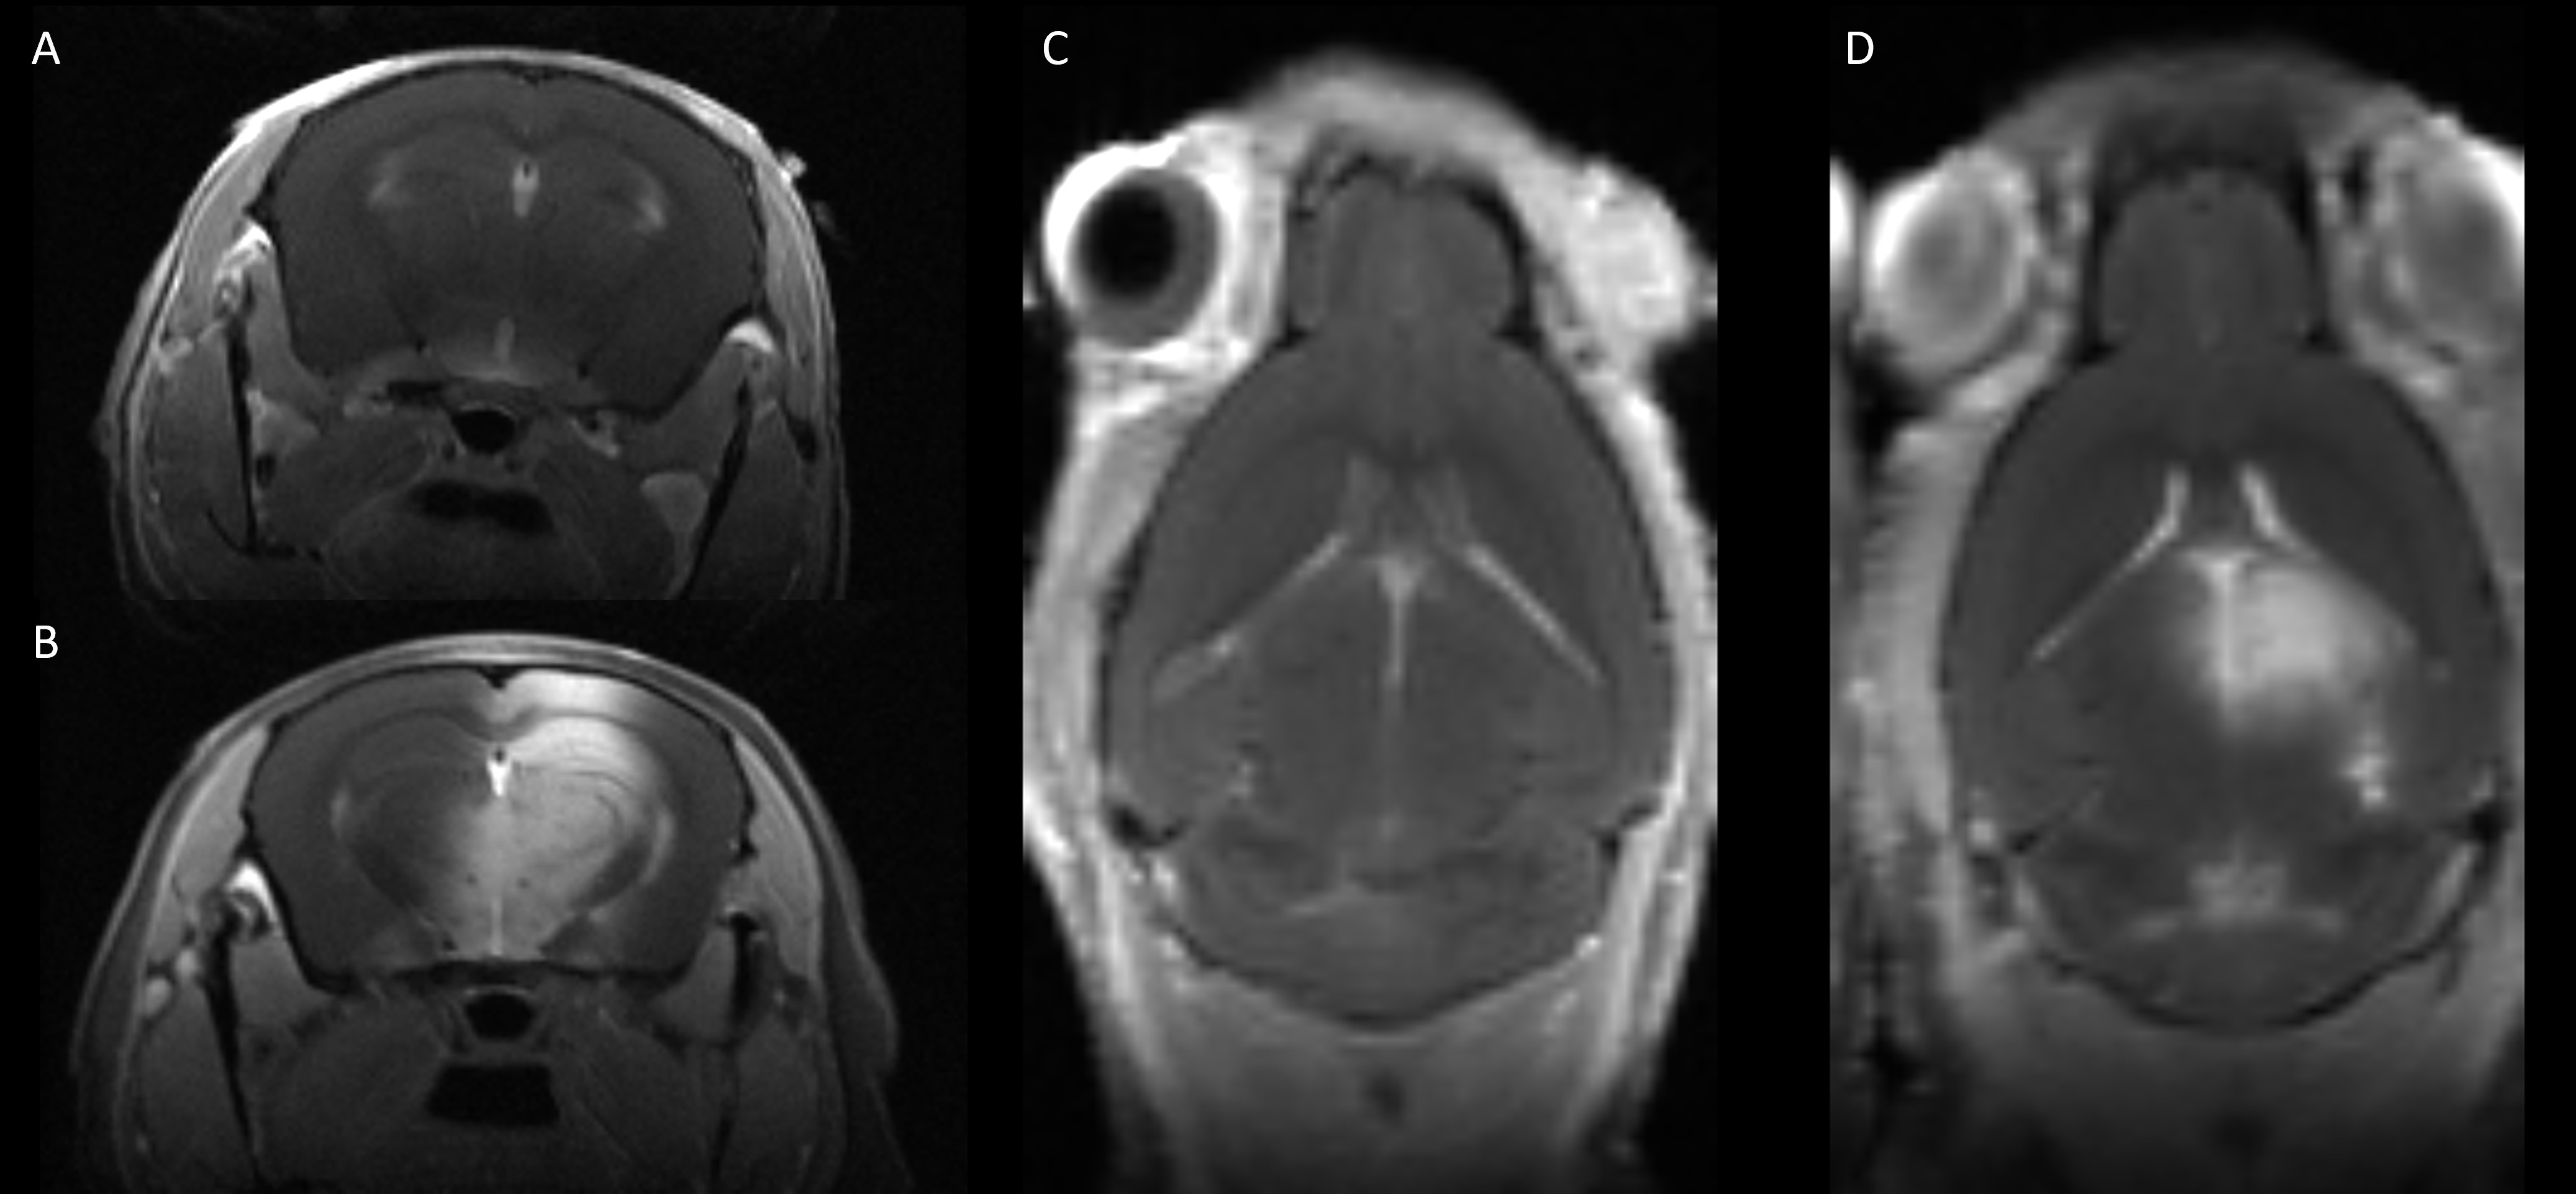
Figure 2: T1-weighted coronal (A) and transverse (C) sections of a mouse that received IP GBCA injection prior to receiving FUS. No BBB opening is observed in the brain parenchyma. T1-weighted RARE coronal (B) and transverse (D) section of a mouse that received IP GBCA injection and FUS. Hyperintensity in Band D demonstrate GBCA leakage across the BBB where FUS has been applied.
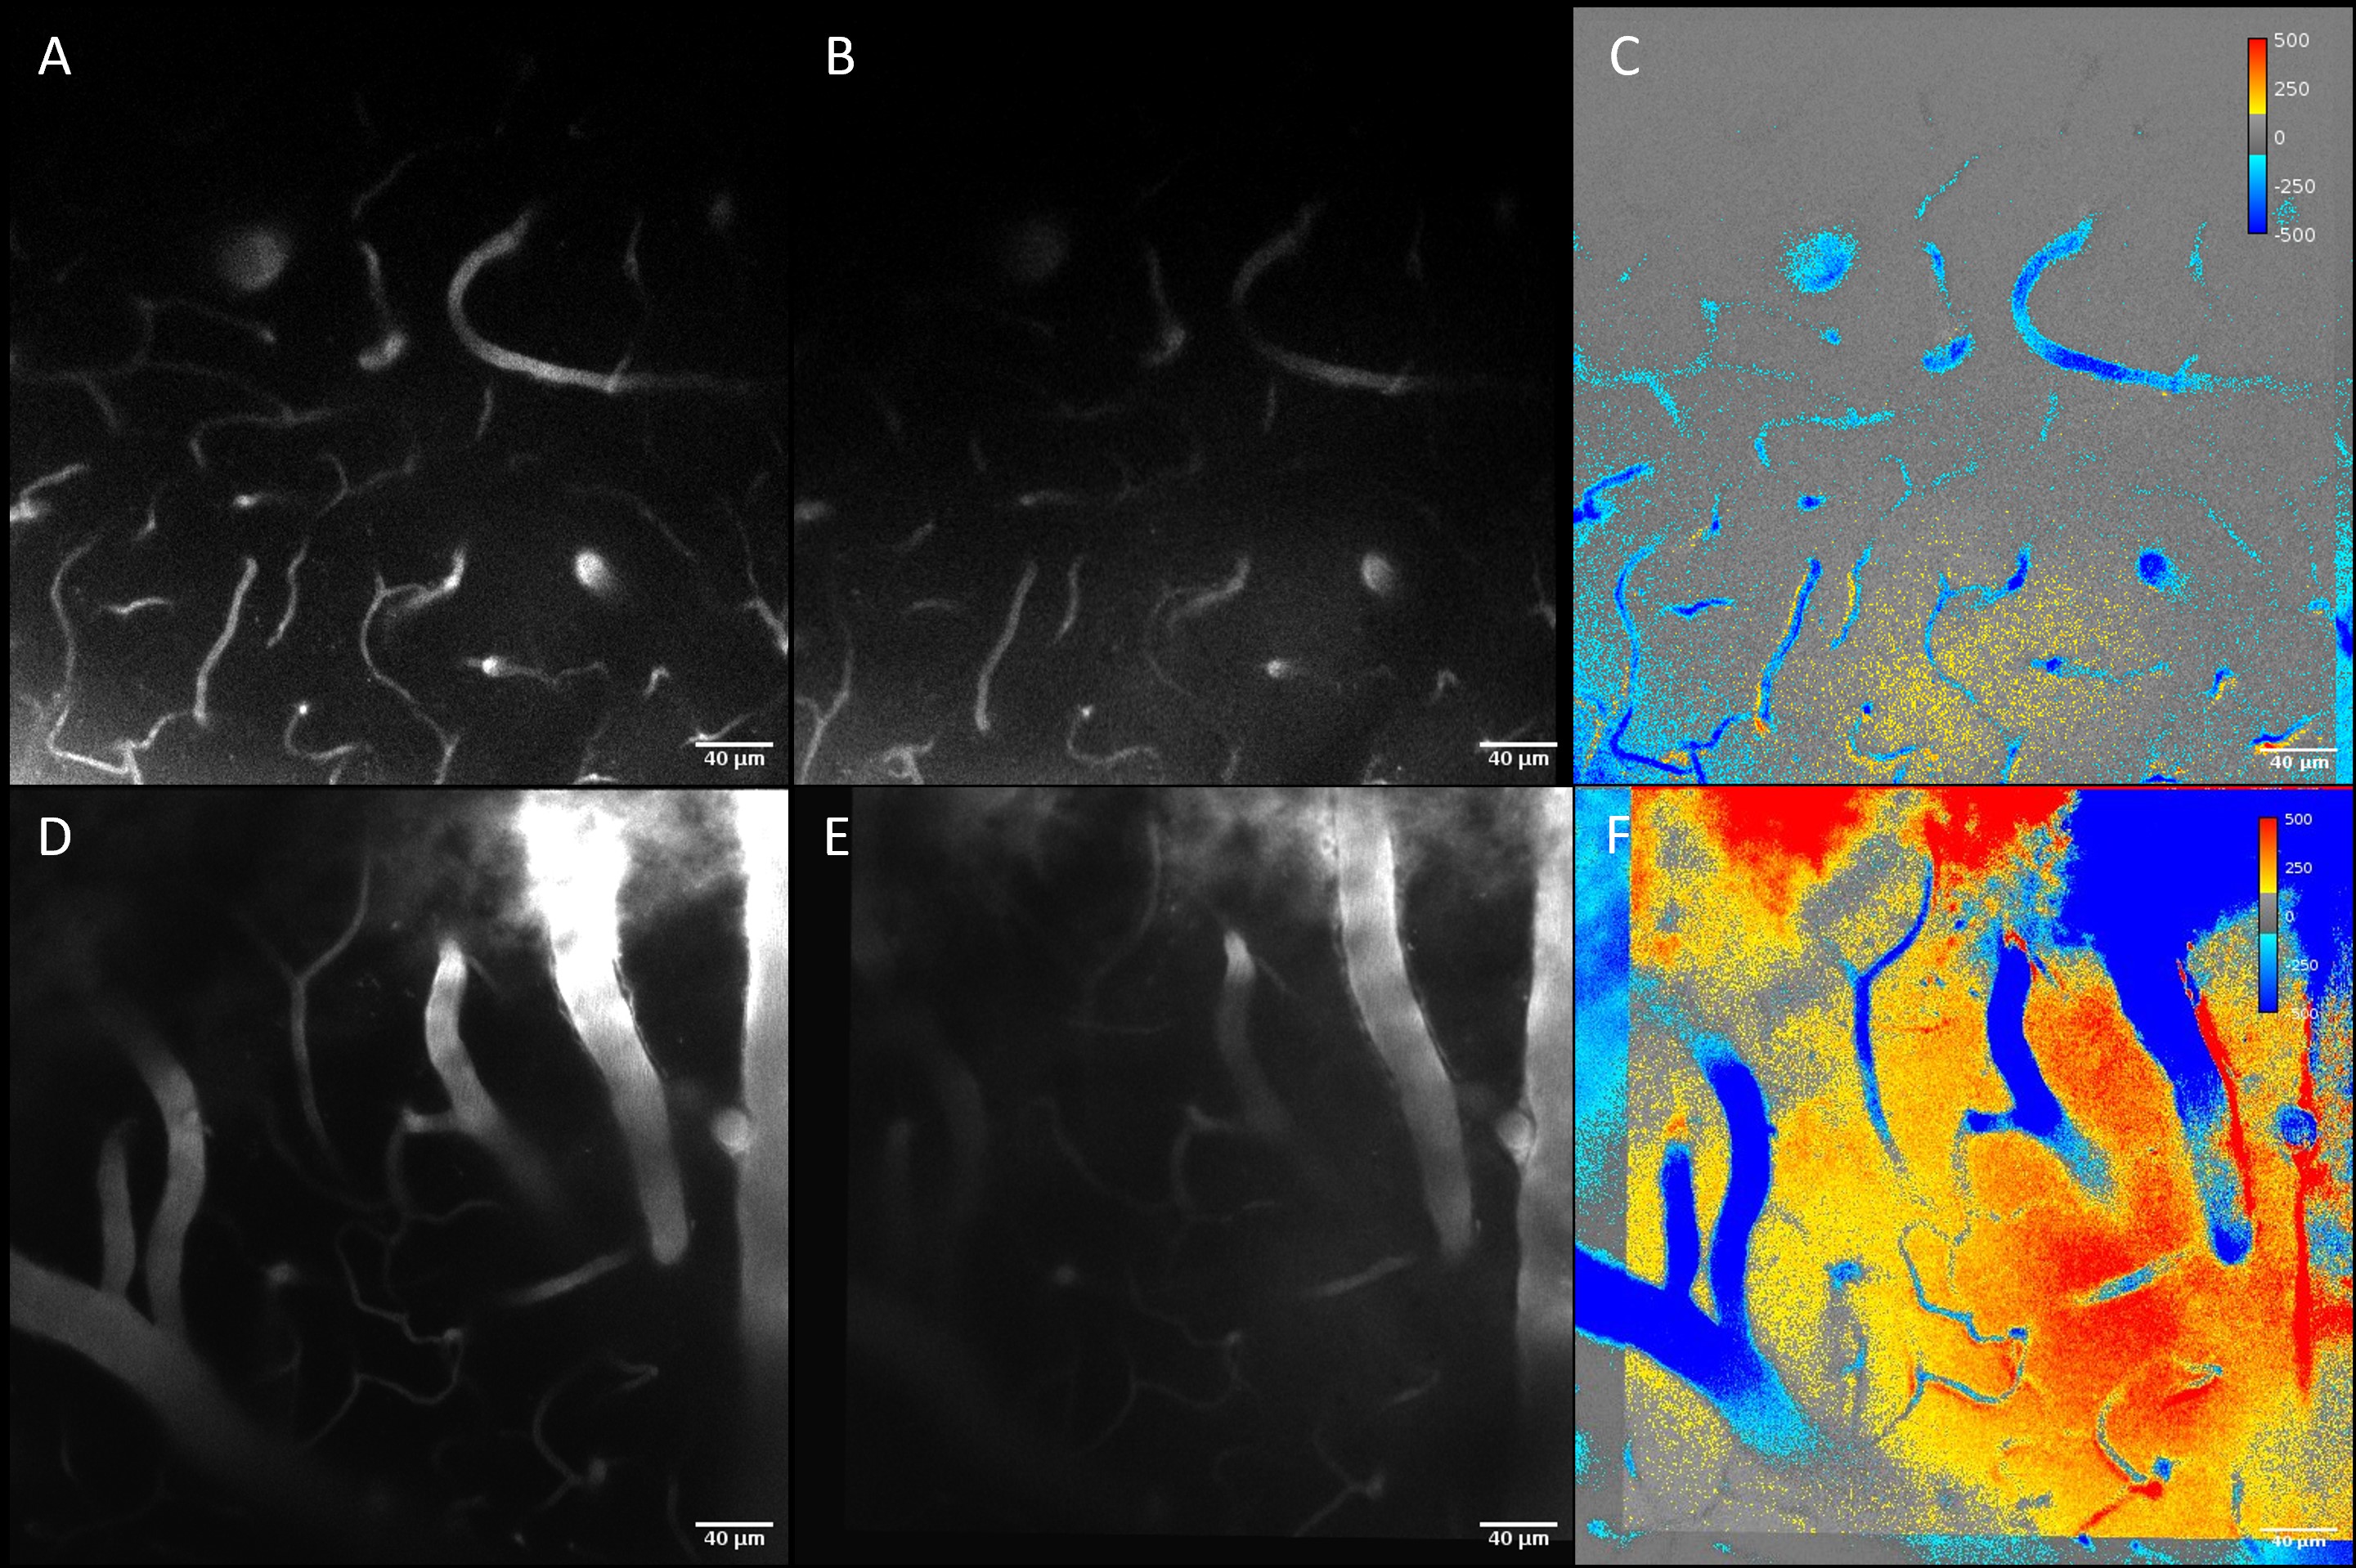
Figure 3: In-vivo 2-photon microscopy of mouse cortex pre and post FUS. A: Z-stack on a control mouse prior to FUS. B: Z-stack of control mouse after sham FUS. C: Subtraction map of the Z-stacks in (B) and (A). Blue indicates signal decrease, red indicates signal increase. D: Z-stack on a mouse prior to FUS. E: Z-stack on a mouse after FUS. F: Subtraction map from mouse depicted in D and E. Increases in signal is observed in the brain parenchyma while signal in the vessels decrease.
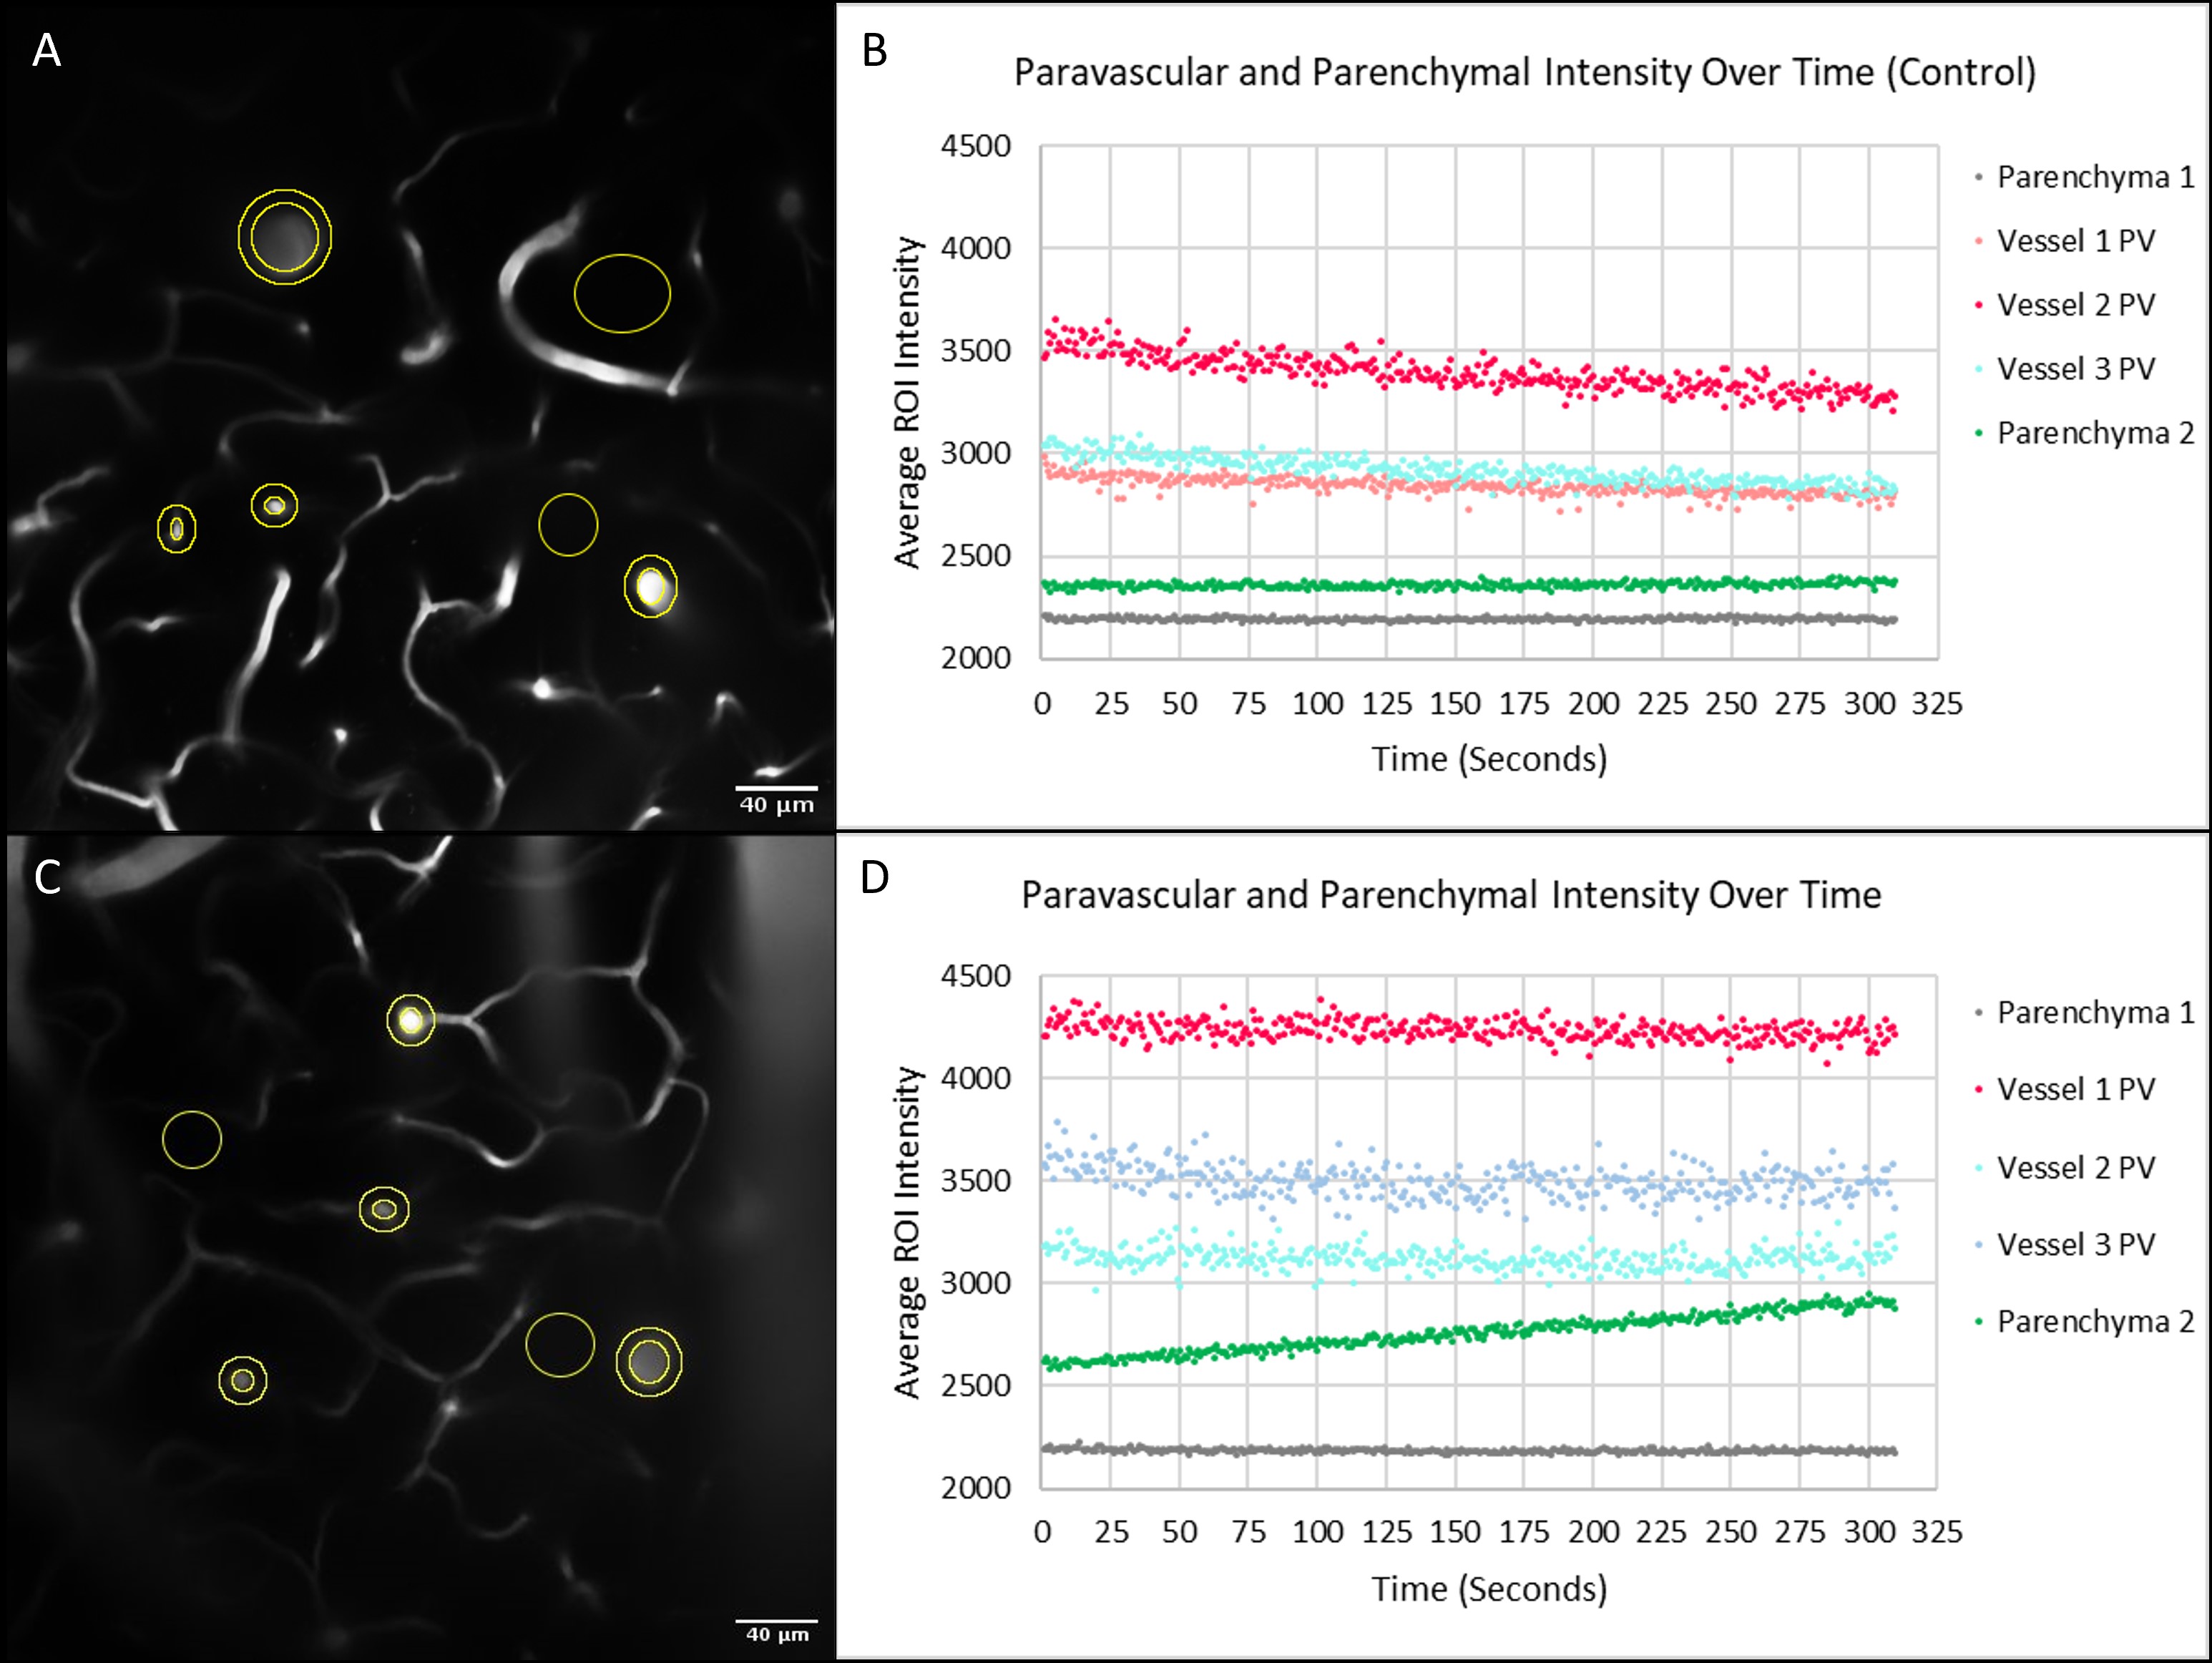
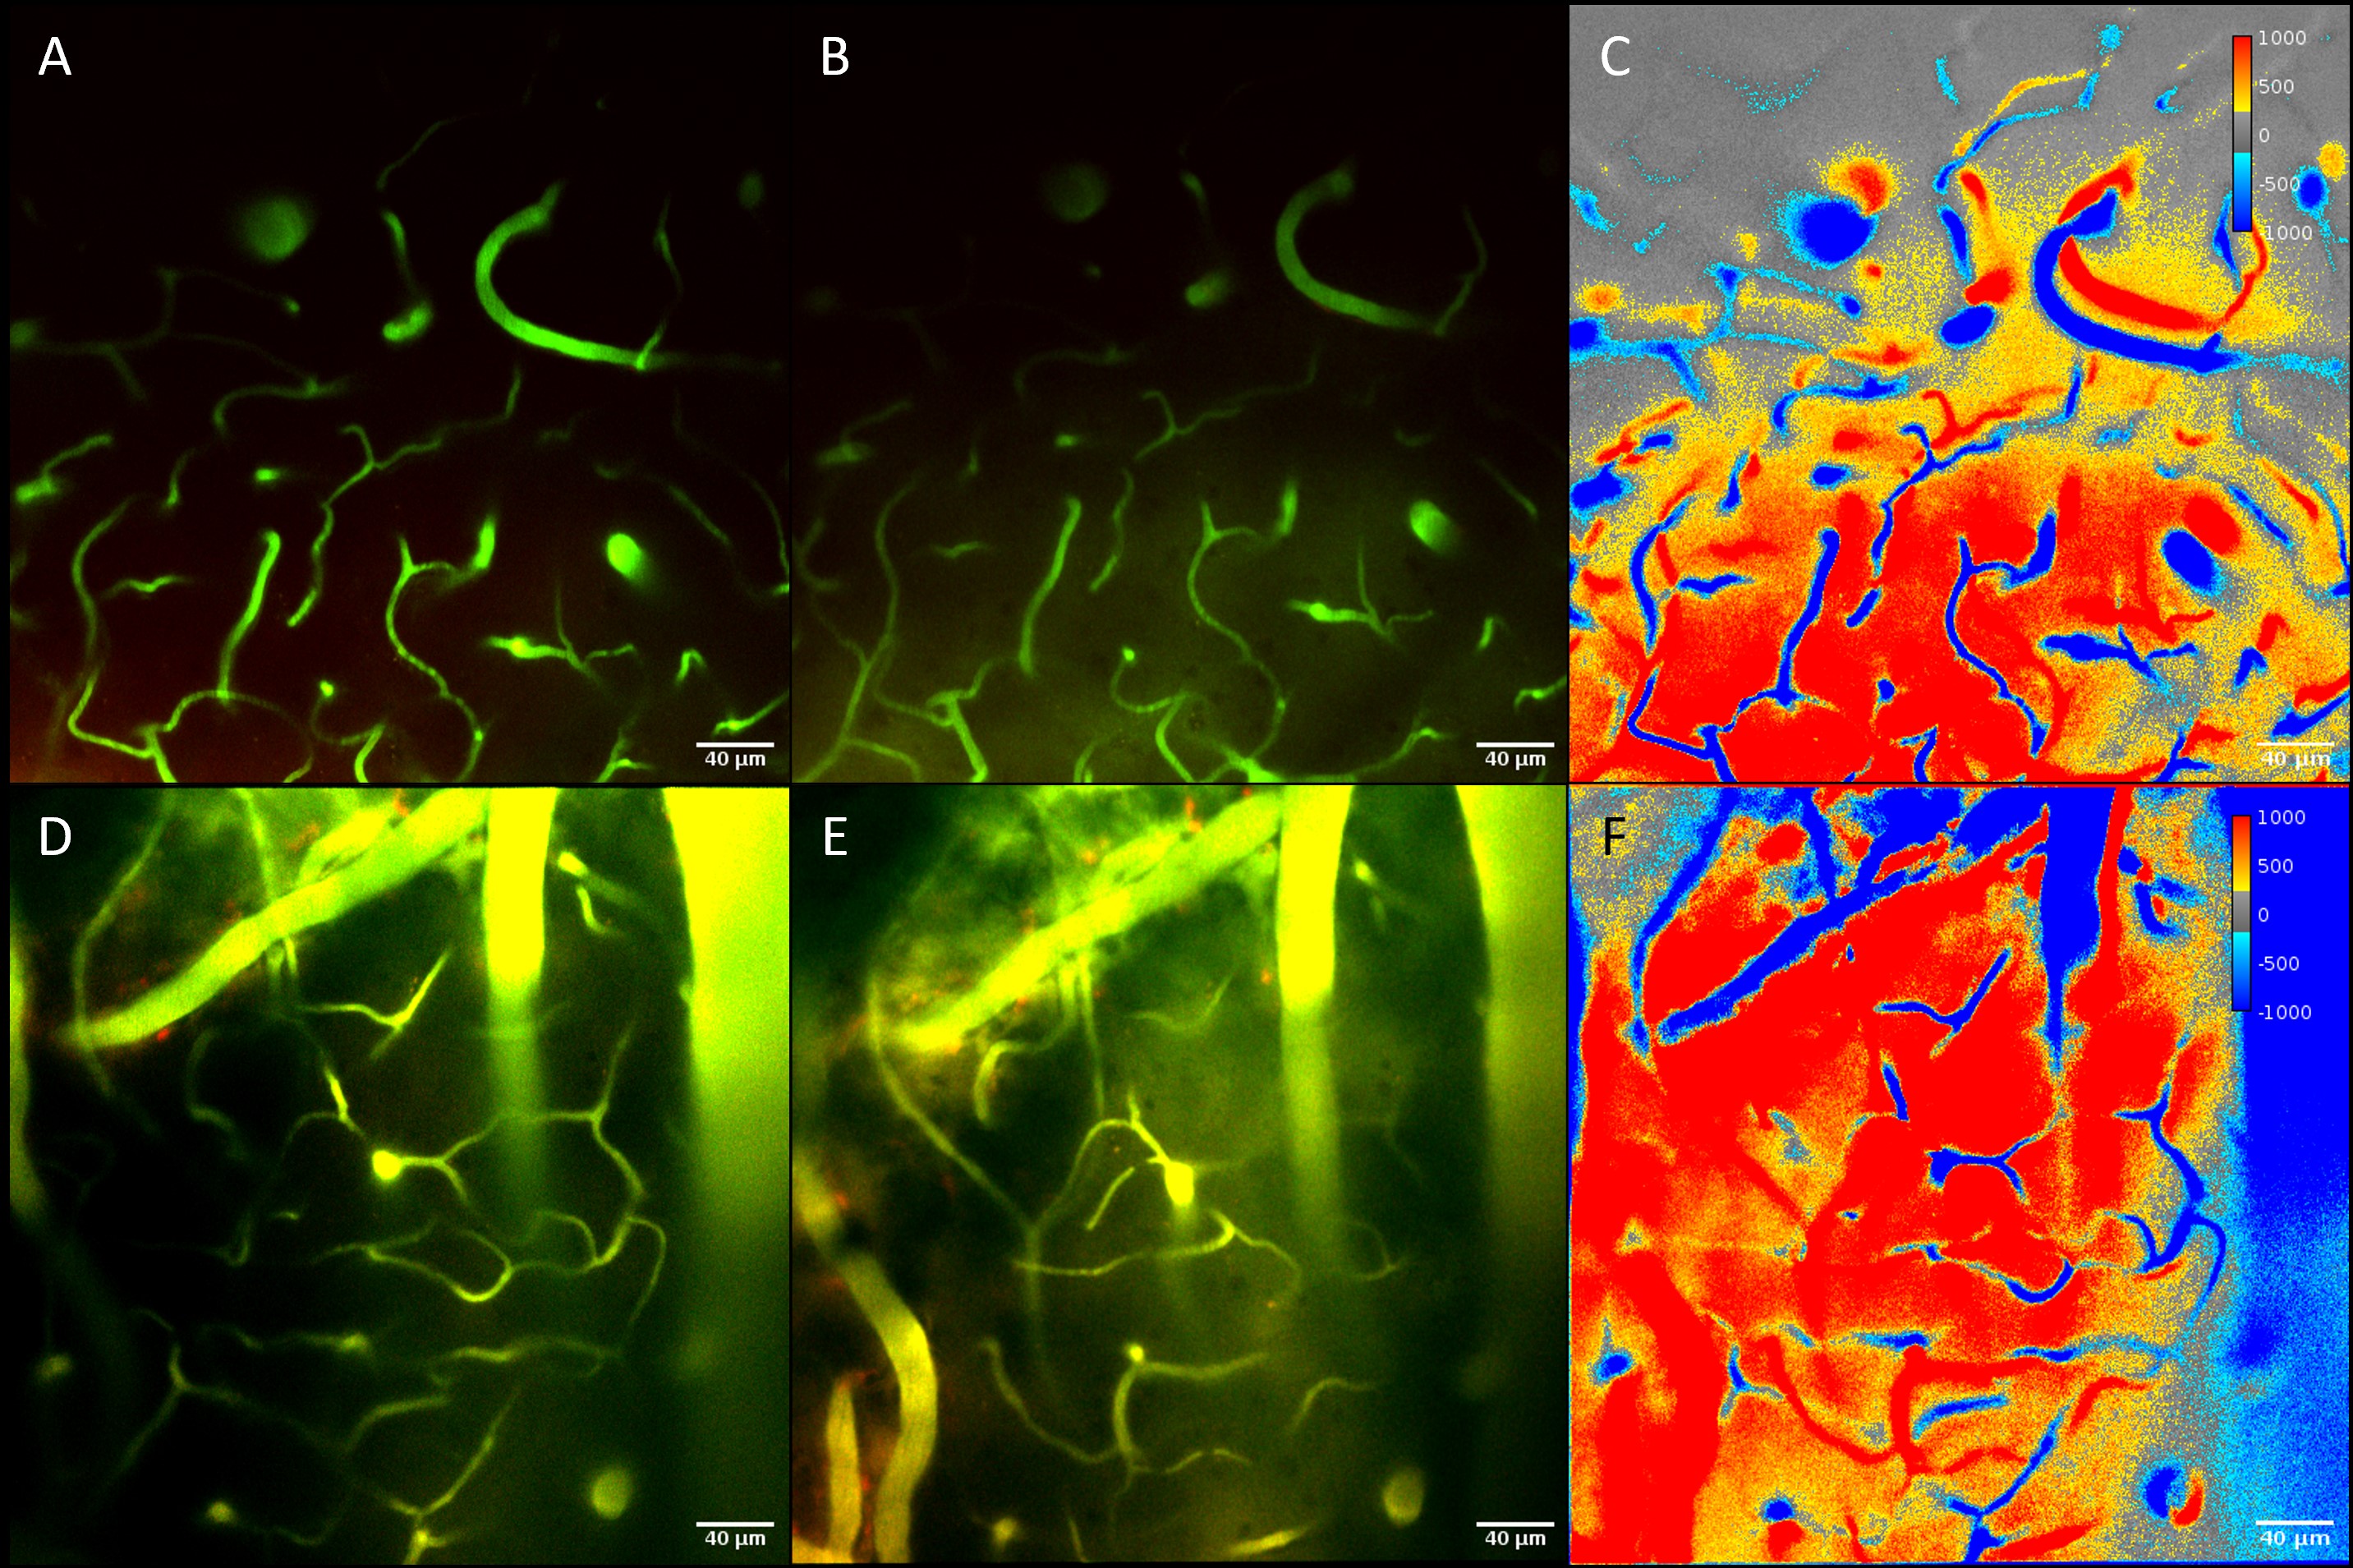
Figure 5: Average intensity z-projections from control (A, B, C) and FUS-treated (D, E, F) mice after FITC bolus injection. A: Z-project 5 minutes after FITC bolus. B: Z-projection 1 hour after FITC bolus. C: Subtraction map of (B) minus (A). D: Z-projection 5 minutes after FITC bolus. E: Z-projection 1 hour after FITC bolus. F: Subtraction map of (E) minus (D).