2712
MR-ARFI for transcranial ultrasound neuromodulation: The effect of varying frequency and depth.1Radiology, Stanford University, Stanford, CA, United States, 2Electrical Engineering, Stanford University, Stanford, CA, United States
Synopsis
Keywords: MR-Guided Focused Ultrasound, Focused Ultrasound
Motivation: Previous MR-ARFI optimizations have incorporated tissue response times, but assumed those were constant in a homogenous medium.
Goal(s): To demonstrate that tissue response times vary with ultrasound parameters such as frequency and depth, and to use those to optimize MR-ARFI.
Approach: We measured displacement response time in a tissue-mimicking phantom at 0.5MHz and 1.0MHz ultrasound frequencies and depths of 40- and 60-mm.
Results: With our tissue-mimicking phantom, the time constants were approximately 3ms and 6ms for 1.0MHz and 0.5MHz ultrasound frequencies, respectively.
Impact: Ultrasound parameters of frequency and depth affect tissue response and can be used to optimize the acquisition to maximize SNR and minimize ultrasound dose.
INTRODUCTION
A major barrier to translating transcranial ultrasound stimulation (TUS) to human clinical trials is the need for confirmation of precise neuroanatomical targeting through the human skull which is strongly attenuating to ultrasound waves.1–3. In MR-guided focused ultrasound ablation procedures, a high ultrasound intensity induces a focal and transient 15-20oC increase in temperature that can be measured with MR-thermometry. However, in neuromodulation at much lower intensities, the temperature rise may be insignificant and difficult to localize on MR thermometry4,5. MR acoustic radiation force imaging (MR-ARFI) has been demonstrated to provide reliable in vivo imaging of the focal spot, with ultrasound pressures of 2.0 MPa6. The purpose of current study is to optimize MR-ARFI to allow a reduced ultrasound pressure in human applications. Previously MR-ARFI optimizations7,8 used tissue stiffness at the target to determine the optimal timing. In this study, we showed that tissue temporal response, measured with MR-ARFI, can vary not just with tissue stiffness, but also with ultrasound parameters such as frequency and depth.METHODS
MR images analyzed in this work were acquired on a 3T GE Signa MR scanner (GE Healthcare, Milwaukee, WI) using an 8-channel head coil with a spin echo sequence with 800 ms repetition time, 60 ms echo time, and 256 x 128 acquisition matrix. Two ultrasound transducers were used: a 1.0 MHz 128-element phased array (Image Guided Therapy, France) and a 0.5 MHz 4 element annular array (Neurofus System, UK). An in situ peak pressures of approximately 700 kPa, as measured with a calibrated hydrophone (Onda, Sunnyvale, USA) was used. To measure tissue response with MR-ARFI, the ultrasound-generated displacement was measured in a soft tissue-mimicking phantom (Computerized Imaging Referencing System, Virginia, USA). A 10 ms ultrasound displacement was sampled by overlapping a 1 ms unipolar encoding gradient, (Fig.1). The start time of the ultrasound pulse was set earlier in successive images, such that the images were samples of the ultrasound displacement curves in 1 ms steps. The displacement phase is calculated using Eq. 1:$$γ \int_{T0}^{Tenc} G(t)X(t) \,dt$$
where Φ is phase shift of MR signal (rad), γ is gyromagnetic ratio (γ/2π = 42.58 MHz), G(t) is the gradient magnitude (0.05 T/m), T0 and Tenc are the encoding times, and X(t) is the time-varying tissue displacement in response to acoustic radiation force that can be approximated by an exponential function. The displacement phase was calculated from the complex phase difference of two acquisitions with and without ultrasound. The averaged displacement phase in the focal spot map normalized to the maximum displacement phase obtained at an offset of 10 ms was used for plotting as a function of offset time between ultrasound and the second unipolar gradient. To compare focal spot size, acoustic pressure was simulated in the k-Wave toolbox9 (MATLAB 2021b, Mathworks, USA) at two frequencies and depths using acoustic properties of water.
RESULTS
Fig. 2 panels A and B show the phase difference image when ultrasound-generated displacement was sampled at 1 ms steps using unipolar MEG and two different frequencies. Panels C and D show corresponding quantified average displacement at the focal spot as a function of the gradient-ultrasound offset time. Phantom response was characterized by finding fits to the displacement data in which rise time was found to be 3.5 ms and 5.7 ms for 1.0MHz and 0.5 MHz ultrasound frequencies, respectively. Fig. 3A demonstrates the rise time constant of the phantom as a function of frequency and depth. The data in this figure shows a negative correlation between temporal time constant of the phantom and frequency. This trend is most likely not due to focal spot size as the data at different depths suggest an opposite trend in which the difference seems to be insignificant. The lack of correlation between rise time constant and simulated focal spot size is shown in Fig.3B where simulation of acoustic field at two different depths and frequencies in free water was performed.DISCUSSION
We demonstrated that temporal response to acoustic radiation force in a soft tissue-mimicking phantom correlates with ultrasound parameters such as frequencies and depth. These preliminary results suggest that a more comprehensive model of MR-ARFI for optimization must include not only biomechanical properties such as viscoelasticity, but also the effects of frequency and ultrasound attenuation on the temporal characteristics of tissue displacement during ARFI. More measurements are needed to clarify these mechanisms and establish significance.CONCLUSION
MR-ARFI measured tissue temporal response to acoustic radiation force is dependent on ultrasound frequency and depth which should be incorporated in future MR-ARFI optimization protocols to maximize SNR and minimize ultrasound dose.Acknowledgements
This work was supported by NIH MH131684.
References
neuromodulation. Clin. Neurophysiol. 135, 51–73 (2022).
2. Gaur, P. et al. Histologic safety of transcranial focused ultrasound neuromodulation and magnetic resonance acoustic radiation force imaging in rhesus macaques and sheep. Brain Stimul. 13, 804–814 (2020).
3. Marsac, L. et al. MR-guided adaptive focusing of therapeutic ultrasound beams in the human head. Med. Phys. 39, 1141–9 (2012).
4. Ghanouni, P. et al. Transcranial MRI-guided focused ultrasound: A review of the technologic and neurologic applications. Am. J. Roentgenol. 205, 150–159 (2015).
5. Ozenne, V. et al. MRI monitoring of temperature and displacement for transcranial focus ultrasound applications. Neuroimage 204, 116236 (2020).
6. Mohammadjavadi, M. et al. Transcranial ultrasound neuromodulation of the thalamic visual pathway in a large animal model and the dose-response relationship with MR-ARFI. Sci. Rep. 12, 19588 (2022).
7. Kaye, E. A. & Pauly, K. B. Adapting MRI acoustic radiation force imaging for in vivo human brain focused ultrasound applications. Magn. Reson. Med. 69, 724–733 (2013).
8. Li, N., Gaur, P., Quah, K. & Butts Pauly, K. Improving in situ acoustic intensity estimates using MR acoustic radiation force imaging in combination with multifrequency MR elastography. Magn. Reson. Med. 88, 1673–1689 (2022).
9. Treeby, B. E. & Cox, B. T. k-Wave: MATLAB toolbox for the simulation and reconstruction of photoacoustic wave fields. J. Biomed. Opt. 15, 021314 (2010).
Figures
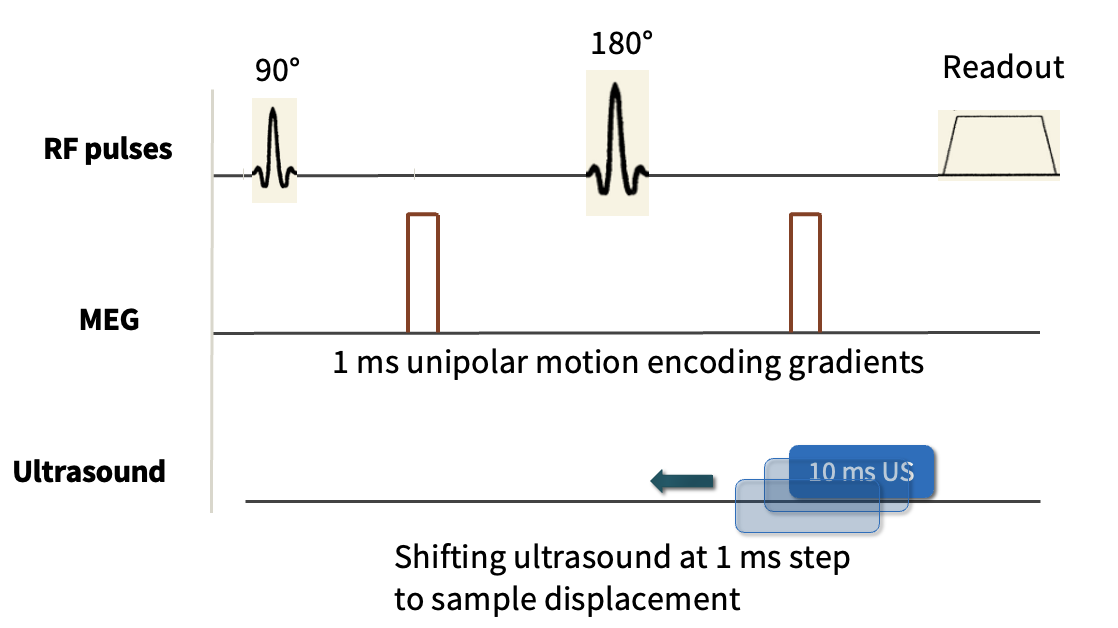
Figure 1. Diagram of pulse sequence for measurement of tissue time constants. Short unipolar gradients are used (in red). Tissue displacement corresponding to 10 ms ultrasound pulse is shown in blue. Black arrow indicates the direction of shifting US pulse at 1ms steps where the offset of 0 ms corresponds to synchronized MEG and the start of the ultrasound pulse and the offset of 10 ms overlaps the MEG with the last 1ms of the US pulse.
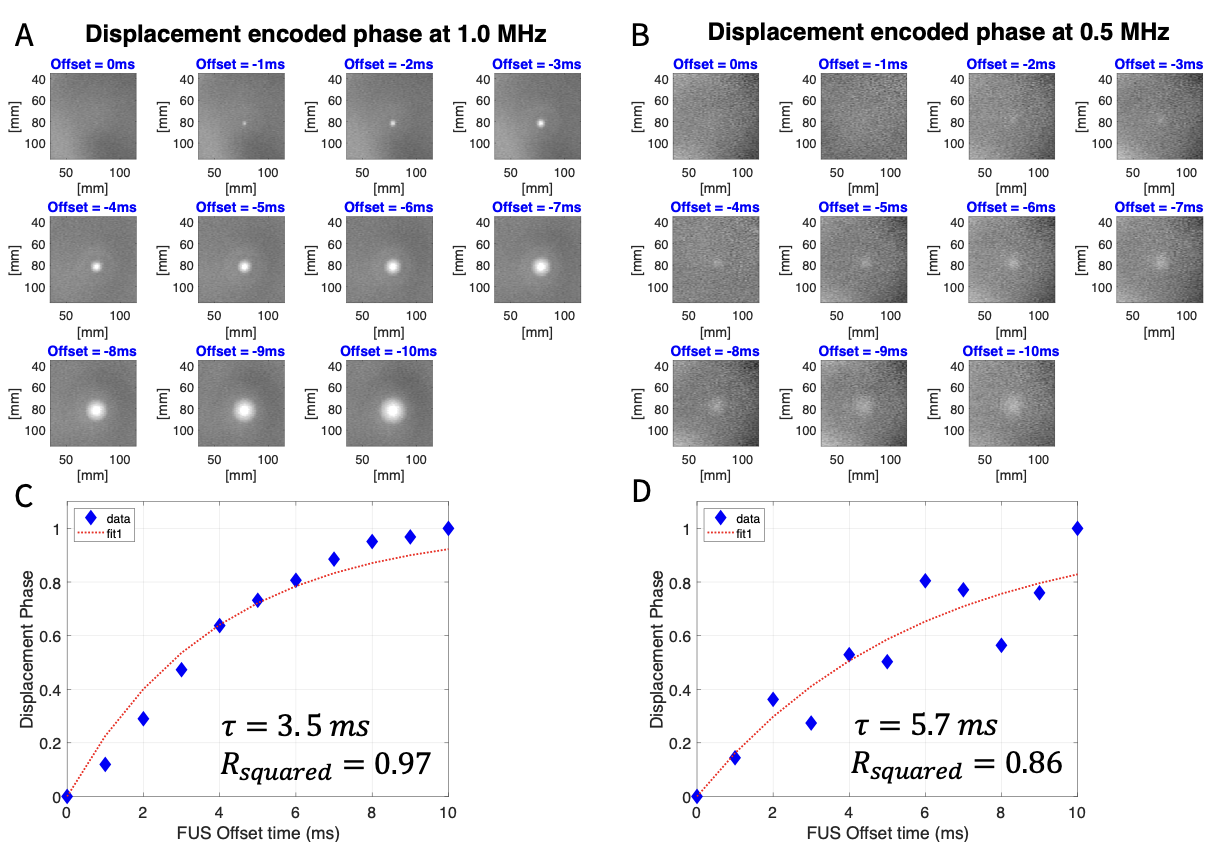
Figure 2. Panel (A) and (B) representative MR-ARFI displacement encoded phase images using 1.0MHz and 0.5 MHz ultrasound frequency at 60mm depth, respectively. Panel (C) and (D), normalized mean displacement phase at the focal spot shown in A and B is plotted as a function of offset time for 1.0MHz and 0.5 MHz ultrasound frequency, respectively. The offset time of 0 ms corresponded to the case where the encoding gradient and the start of the ultrasound pulse were synchronized.
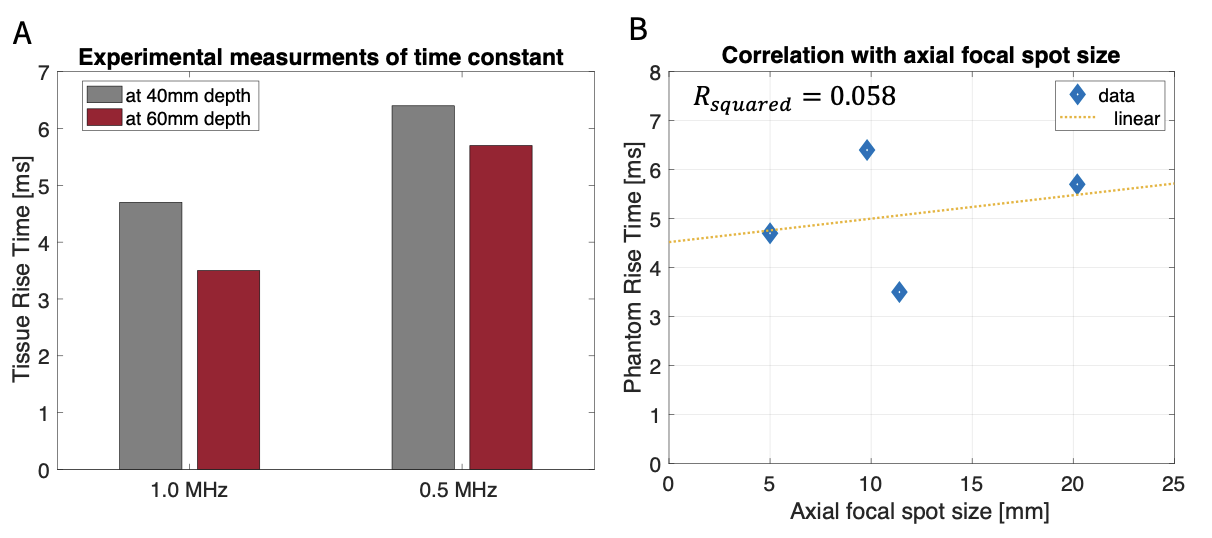
Figure 3. Panel (A) shows the time constant measured experimentally at two frequencies and two focal depths. Panel (B) shows there is no correlation between focal spot size and phantom rise time constant.