2703
Absolute MR Thermometry in the breast using interleaved echo planar spectroscopic imaging1Radiology and Imaging Sciences, University of Utah, Salt Lake City, UT, United States
Synopsis
Keywords: Thermometry/Thermotherapy, Thermometry, Breast, Spectroscopic imaging
Motivation: Clinically available MR thermometry methods only measures relative temperature change. Availability of absolute temperature measurements has high impact potential to improve monitoring and evaluation of thermal therapies.
Goal(s): Develop an efficient and practical approach for spatial absolute MR thermometry in the breast.
Approach: A multi-echo echo-planar spectroscopic imaging pulse sequence was implemented and tested in ex vivo human breast fat samples and healthy volunteers. Comparisons to single voxel spectroscopy was performed.
Results: Water and fat peaks can be detected in both ex vivo samples and in vivo, and converted to absolute temperature measurements. Potential of spatial absolute thermometry is demonstrated.
Impact: Absolute MR thermometry has the potential to improve treatment monitoring and evaluation of thermal therapies, and is demonstrated in the breast using a new efficient high-resolution interleaved echo planar spectroscopic imaging pulse sequence.
Introduction
MR thermometry is used to monitor and evaluate thermal treatments such as focused ultrasound and laser interstitial thermal therapy. Many MR parameters have a temperature dependence and have been investigated for thermal monitoring.1 Most of these approaches can only measure change in temperature. However, spectroscopic approaches have been shown to be able to measure absolute temperature changes by using the temperature insensitive resonance frequency of one proton pool as a reference for another, temperature sensitive, proton pool. This has, e.g., been demonstrated for water and fat in the breast and for water and N-acetylaspartate (NAA) in the brain.2–6 Typically, MR spectroscopy and spectroscopic imaging approaches have low spatial and temporal resolution and are not well suited for thermal therapy monitoring. The goal of this work is to implement and evaluate a new interleaved echo planar spectroscopic imaging (iEPSI) pulse sequence for absolute MR thermometry in the breast.Methods
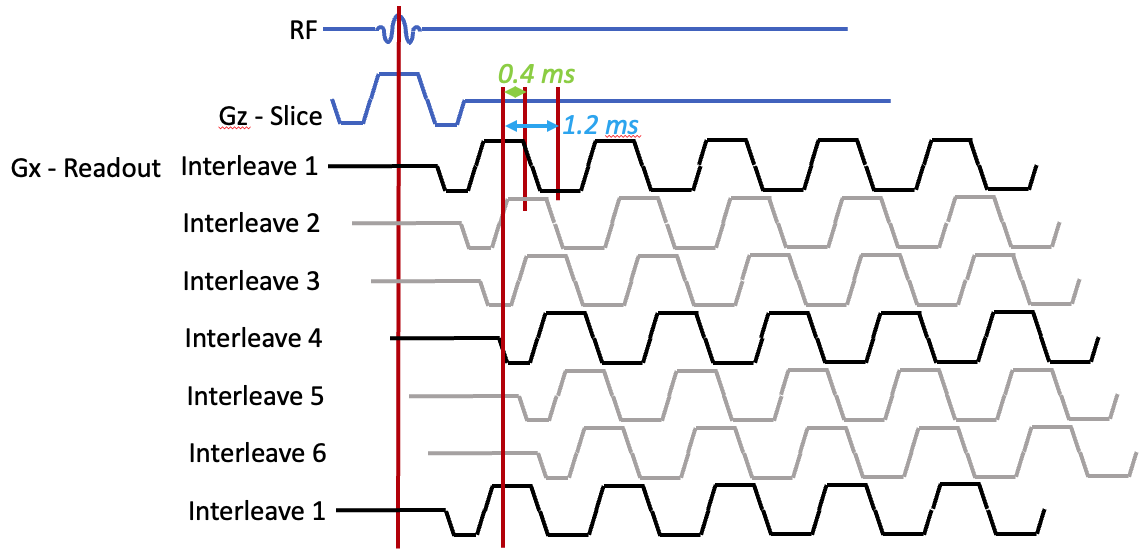
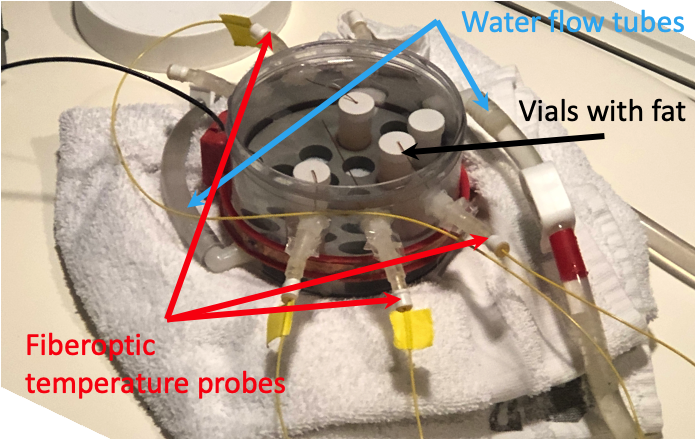
A multi-echo gradient recalled echo pulse sequence was modified to allow acquisition of up to 32 mono- or bi-polar echoes. In addition, the sequence was modified to allow interleaving multiple sets of the 32 echoes to effectively achieve a smaller echo spacing, Figure 1. In this work, each set of spatial phase encodings for the excitation and echo train readout is repeated 6 times with a time shift of 0.4 ms relative to the RF excitation between each interleave: 1st interleave: TE=1.55, 2.75, 3.95, …, 38.75 ms; 2nd interleave: TE=1.95, 3.15, 4.35, …, 39.15 ms, etc. For spectral processing and to minimize artifacts due to gradient polarity, the measurements are separated by gradient polarity. Each set of measurements (positive lobe and negative lobe) are then interleaved and sorted in echo-time order (in order of time from the RF pulse). These sorted measurements yield effective FID measurements with dwell times of 0.4 ms, and 38.4 ms total FID duration (96 echoes x 0.4 ms/echo). These values yield a frequency bandwidth of 2500 Hz and a spectral resolution of 26 Hz. Experiments were performed in ex vivo breast fat samples and, after local IRB approval and informed consent, in one healthy volunteer in a dedicated breast MR guided FUS system. The breast fat samples were cooled and heated between 3-35 °C in water bath setup, Figure 2. Other imaging parameters included; (Breast fat in vials) TR=50 ms, flip angle=20°, FOV=192x156x3 mm, matrix=128x104x1, voxel dimensions=1.5x1.5x3 mm3, acquisition time=31 s per 2D spectroscopic image. (Human volunteers) TR=45 ms, flip angle=20°, FOV=192x162x28 mm, matrix=128x108x12, voxel dimensions=1.5x1.5x2 mm3, acquisitions time = 261s per 3D spectroscopic image volume. For comparison a stock vendor single voxel PRESS spectroscopy (SVS) sequence was run with acquisition parameters including TR=1500 ms, TE=100 ms, 10 mm3 voxel, flip angle=90°, dwell time=0.357 ms, number of samples (nsamp)=2176, frequency bandwidth=1/dwell time=2.8 kHz, frequency resolution=frequency bandwidth/nsamp=1.29 Hz, 1024 dynamic measurements. All experiments were performed at 3T (Prisma and Vida, Siemens) and data were processed using custom Matlab scripts (MathWorks).To convert frequency difference to temperature a direct relationship according to
$$T=\frac{\Delta{f}-\Delta{f_0}}{\gamma B_0 \alpha}+T_0$$
is assumed. Without knowing the absolute temperature relationship, it was assumed there is a frequency difference, $$$\Delta{f_0}$$$ , at which the temperature is $$$T_0$$$.
Results
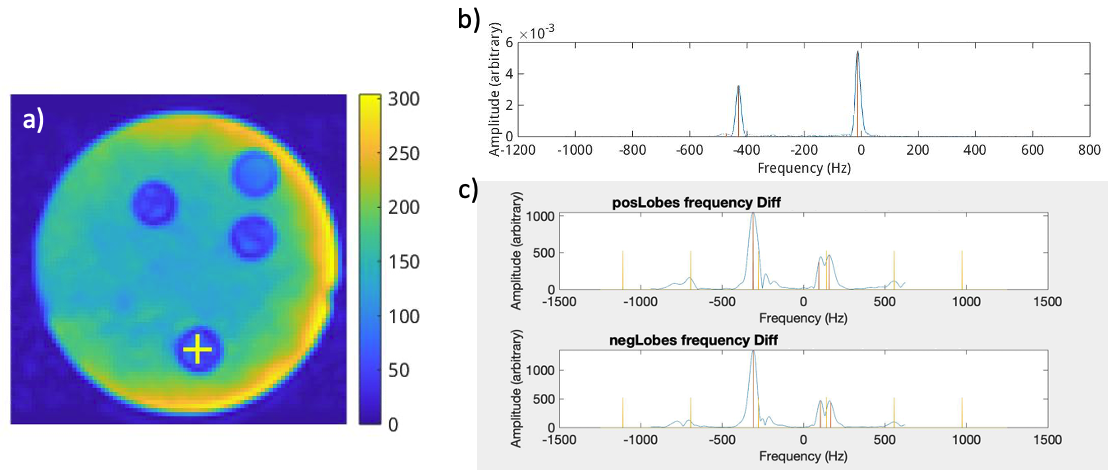
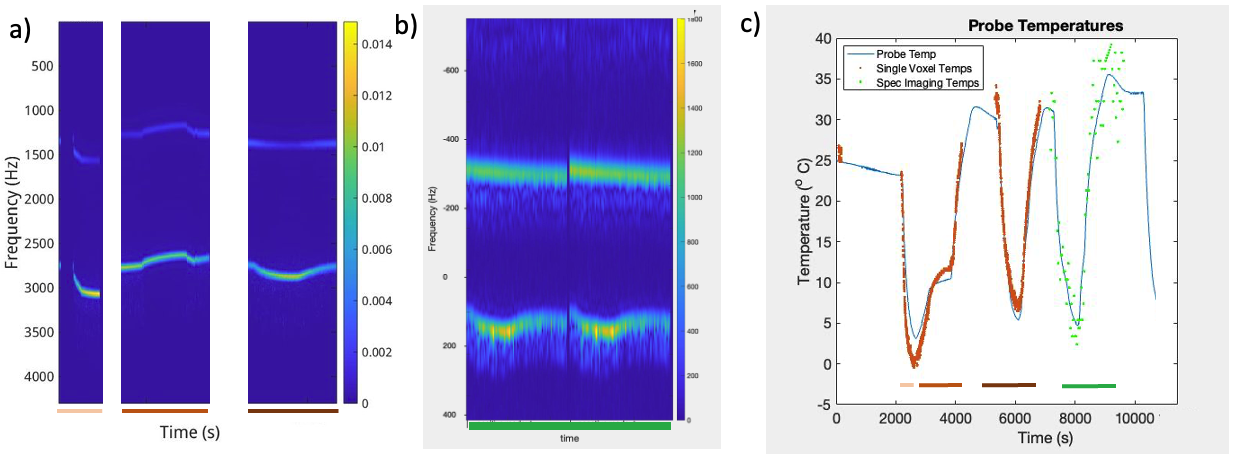
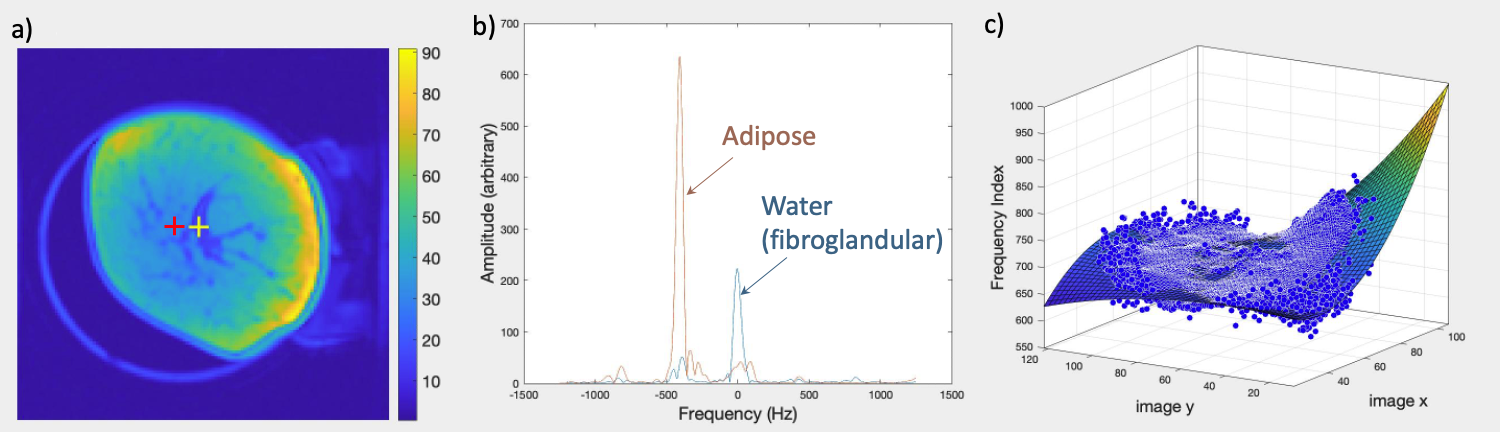
Figure 3 shows spectra from single voxels using SVS (10 mm3 voxel) and the described iEPSI pulse sequence (1.5x1.5x2 mm3 voxel) in the ex vivo breast fat sample, indicating that the fat and water peaks can be detected using both approaches. Figure 4 shows frequency spectra as a function of time as the temperature is changing, and conversion of the detected frequency difference into temperature, compared to fiberoptic probe measurements. Figure 5 shows in vivo feasibility in a healthy volunteer. Both fat and water peaks can be detected in both fibroglandular and adipose tissue. The detected frequency spacing can be extrapolated across the full breast demonstrating the spatial monitoring potential of the iEPSI technique.Discussion and Conclusions
An efficient approach to acquire high resolution spectroscopic images using an interleaved echo-planar imaging-type pulse sequence has been developed and evaluated for absolute temperature measurements in ex vivo breast fat samples and a healthy volunteer. Compared to SVS the acquired spectra are naturally noisier, considering the voxel size is less than 1/200, however the clinical impact of this information could be high. To improve quality of the iEPSI spectra more advanced peak-finding algorithms, filtering methods, and spatial and temporal averaging could be performed. It is hypothesized that in vivo absolute temperature measurements will contribute to more accurate treatment monitoring and evaluation, e.g., by providing accurate starting temperatures for thermal dose calculations.Acknowledgements
NIH grants R37CA224141, R01CA259686, S10OD026788, and S10OD018482.References
1. Odéen H, Parker DL. Magnetic resonance thermometry and its biological applications - Physical principles and practical considerations. Prog Nucl Magn Reson Spectrosc. 2019;110:34-61. doi:10.1016/j.pnmrs.2019.01.0032.
2. McDannold N, Barnes AS, Rybicki FJ, et al. Temperature mapping considerations in the breast with line scan echo planar spectroscopic imaging. Magn Reson Med. 2007;58(6):1117-1123. doi:10.1002/mrm.213223.
3. Corbett R, Laptook A, Weatherall P. Noninvasive Measurements of Human Brain Temperature Using Volume-Localized Proton Magnetic Resonance Spectroscopy. Journal of Cerebral Blood Flow & Metabolism. 1997;17(4):363-369. doi:10.1097/00004647-199704000-000014.
4. Weis J, Covaciu L, Rubertsson S, Allers M, Lunderquist A, Ahlström H. Noninvasive monitoring of brain temperature during mild hypothermia. Magn Reson Imaging. 2009;27(7):923-932. doi:10.1016/J.MRI.2009.01.0115.
5. Covaciu L, Rubertsson S, Ortiz-Nieto F, Ahlström H, Weis J. Human brain MR spectroscopy thermometry using metabolite aqueous-solution calibrations. J Magn Reson Imaging. 2010;31(4):807-814. doi:10.1002/JMRI.221076.
6. Dehkharghani S, Mao H, Howell L, et al. Proton resonance frequency chemical shift thermometry: Experimental design and validation toward high-resolution noninvasive temperature monitoring and in vivo experience in a nonhuman primate model of acute ischemic stroke. American Journal of Neuroradiology. 2015;36(6):1128-1135. doi:10.3174/ajnr.A4241
Figures