2702
Spectral fat saturation and accuracy of proton-resonance frequency shift MR thermometry1Université de Strasbourg, CNRS, ICube, UMR7357, Strasbourg, France
Synopsis
Keywords: Thermometry/Thermotherapy, Thermometry
Motivation: Monitoring thermal ablations with PRFS thermometry ensures therapy safety and efficiency. Spectral fat saturation cannot be 100% efficient: the remaining fat signal may affect PRFS temperature measurements.
Goal(s): This work experimentally evaluates the residual signal after spectral fat saturation, and the error it causes in PRFS thermometry.
Approach: The IDEAL algorithm is used to quantify fat signal after spectral fat saturation. The error in PRFS thermometry with spectral fat saturation is evaluated in fat-water phantoms.
Results: The residual fat signal after spectral fat saturation leads to errors in PRFS thermometry, that increase with the fat content, and oscillate with TE and absolute temperature.
Impact: This work demonstrates experimentally that PRFS temperature errors can be significant during hyperthermia despite fat suppression methods. Careful selection of the TE according to spectral fat saturation strategy can mitigate such errors and improve the accuracy of PRFS thermometry.
Introduction
MRI-PRFS (Proton Resonance Frequency Shift)1 is the gold standard for the monitoring of MR-guided thermal ablations. PRFS relies on the variation of the resonance frequency of hydrogen in water molecules. In comparison, the frequency of hydrogen in fat molecules does not change with temperature, resulting in errors in temperature estimates in fat-containing tissues. Spectral fat saturation is hence employed to suppress the signal from fat in PRFS thermometry. Spectral fat saturation is commonly optimized for minimizing the signal of fat in magnitude images, even though the 2 fat peaks close to water cannot be saturated. This leads to the choice of saturation pulse flip angles differing from 90° in combination with recommendations regarding TE (in/out of-phase)2,3. Currently, the optimal TE for PRFS is chosen close to the T2*4 of the tissue, the link between TE and the effectiveness of spectral fat saturation is not considered, and fat signal is considered fully attenuated. In this work, we quantify the remaining fat signal after fat saturation, and experimentally evaluate the impact of the residual fat signal on PRFS temperature monitoring.Methods
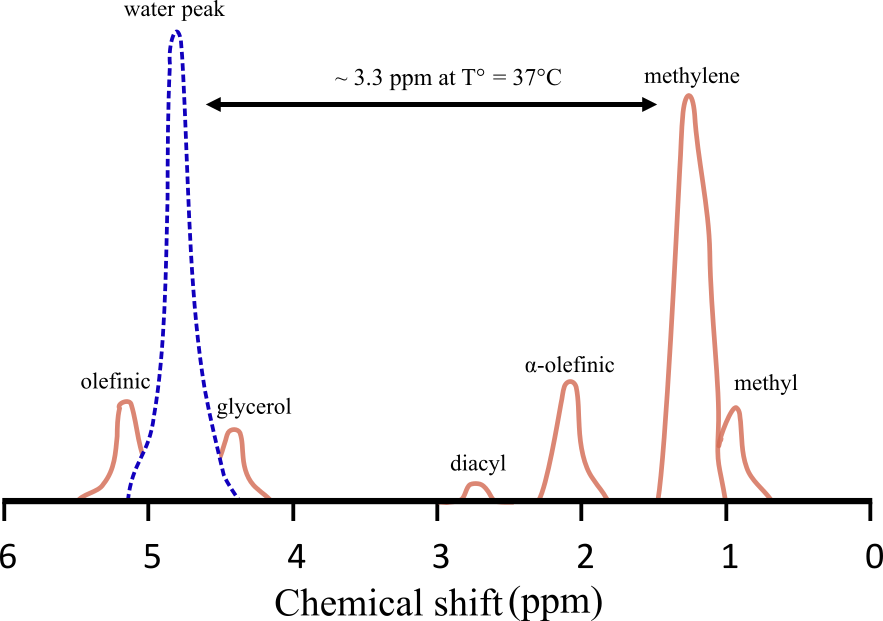
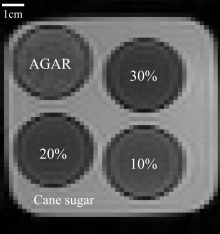
Experiments were conducted on a 1.5T MRI system (MAGNETOM Sola, Siemens Healthcare, Germany). The first experiment aimed at evaluating the effectiveness of clinical spectral fat saturation in pure oil. Peanut oil was chosen due to the resemblance of its NMR spectrum to the one of triglycerides5. A multiecho 2D spoiled gradient-echo (GRE) sequence was used to acquire images with 12 different TEs in each echo train. From those images, the fraction of each fat peak was estimated using the IDEAL algorithm5 assuming no water. Data were acquired with and without spectral fat saturation. The spectral fat saturation pulse corresponds to the vendor “Standard” fat saturation that is used in both diagnostic MRI and PRFS thermometry (Gaussian, bandwidth 197Hz, flip angle 110°). The fat spectrum is generally described as 6 main peaks6; the main peak, methylene, represents 70% of the fat signal (Fig. 1). The diacyl peak is neglected (amplitude <1%). The second experiment focused on evaluating temperature errors in fat-suppressed PRFS-thermometry. Water-fat phantoms (peanut oil)7 were elaborated in vials (diameter 3cm) with proton density fat fraction (PDFF) of 10, 20 and 30 %, and a control sample with only agar hydrogel. Reference temperature values were measured by fiber optic temperature probes (Rugged Monitoring, Canada) placed in the center of each vial. Phantoms were heated to 60°C in a water bath, then placed in a cane sugar filled container in the MRI for the cooling-down experiment (Fig. 2). The multiecho spoiled GRE sequence with spectral fat saturation was acquired during 45 min providing images at different TEs (9.3 to 21.5 ms) from which PRFS thermometry was obtained. B0-drift was corrected from two room-temperature agar tubes placed on the sides. Because PRFS determines temperature variations, the phase image stack can be inverted to mimic the process of heating8. Temperature errors were calculated between PRFS measurements and optical probe data.Results
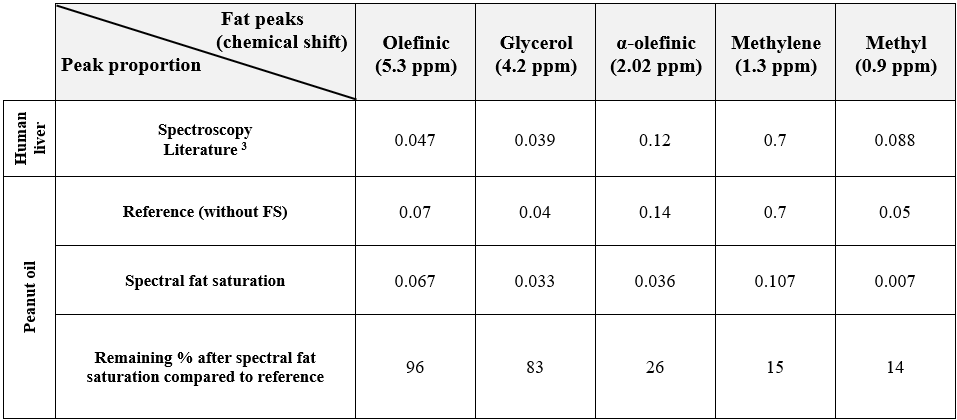
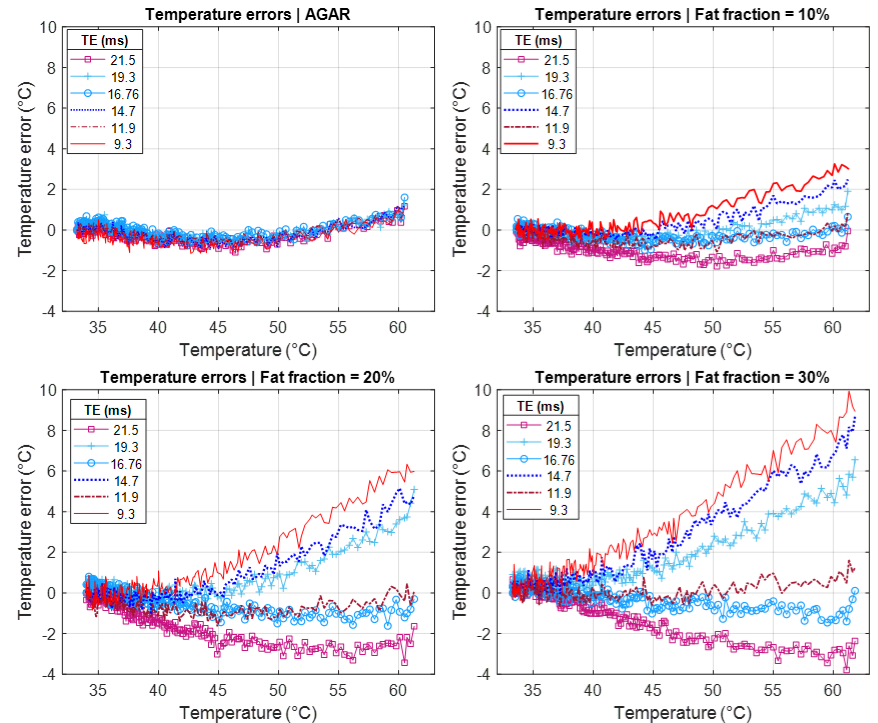
In the peanut-oil phantom, as expected, the fat peaks circling the water peak (Olefinic, Glycerol) are weakly attenuated by spectral fat saturation (Table 1). Between 14 and 26% of the 3 main fat peaks (methylene, α-olefinic and methyl) persist despite spectral fat saturation. Temperature errors in the 4 water-fat phantoms are plotted against absolute temperature and TE for the reversed cooling-down experiment (Figure 3). In the pure agar sample, temperature errors vary between -1°C and +1.6°C. For fat-water phantoms, the maximum positive temperature deviations recorded occur for TE 9.3ms, and increase with PDFF (3.3°C, 6.3°C, and 9.9°C errors in phantoms 10%, 20%, and 30% oil, respectively). Similarly, maximum negative temperature deviations occurred at TE 21.5ms (-1.8°C, -3.4°C, and -3.8°C observed for phantoms 10%, 20%, and 30% oil, respectively). Minimum temperature errors were found for TE 11.9ms (methylene peak, out-of-phase 37°C).Discussion
Residual fat signal after spectral fat saturation leads to temperature errors during thermal ablations depending on TE, temperature variation and fat fraction. Spectral fat saturation targets the primary methylene fat peak and the 2 peaks surrounding it. Failure to carefully select the TE according to the fat saturation flip angle leads to residual fat signal, when the magnitude from the 2 fat peaks adjacent to water are not balanced by the voluntary remaining signal from the 3 main fat peaks.Conclusion
Spectral fat saturation cannot be 100% efficient, and the remaining fat signal affects fat suppressed PRFS thermometry depending on fat fraction, TE and temperature variation. Carefully selecting TE according to the spectral fat saturation strategy mitigates this bias in fat-containing tissues.Acknowledgements
This work has benefitted from funding of the FUI (Fonds Unique Interministériel, BPI France) for the UFOGUIDE project, and the ANR (Agence Nationale de la Recherche) French national program ‘Investissements d’Avenir’ for the LABEX-CAMI (ANR-11-LABX-0004), the TechnoFUS joint laboratory project (ANR-21-LCV3-0007-01), and the IHU Strasbourg (Institute of Image Guided Surgery, ANR-10-IAHU-0002).References
1. Ishihara Y, Calderon A, Watanabe H et al. A Precise and Fast Temperature Mapping Using Water Proton Chemical Shift. Magn. Reson. Med. 1995;34(6):814–823.
2. Kuroda K, Oshio K, Mulkern R. V et al. Optimization of Chemical Shift Selective Suppression of fat. Magn. Reson. Med. 1998;40(4):505-510.
3. Mao J, Yan H, Brey W. W et al. Fat tissue and fat suppression. Magn Reson. Imaging. 1993;11(3):385-393.
4. Chung A. H, Hynynen K, Colucci V et al. Optimization of spoiled gradient-echo phase imaging for in vivo localization of a focused ultrasound beam. Mag Reson Med. 1996;36(5):745-52.
5. Yu H, Shimakawa A, McKenzie C. A et al. Multiecho Water-Fat Separation and Simultaneous R2* Estimation with Multifrequency Fat Spectrum Modeling. Magn. Reson. Med. 2008;60(5):1122–1134.
6. Hamilton G, Yokoo T, Bydder M et al. In vivo characterization of the liver fat 1H MR spectrum. NMR Biomed. 2011;24(7).
7. Bush E. C, Gifford A, Coolbaugh C. L et al. Fat-Water Phantoms for Magnetic Resonance Imaging Validation: A Flexible and Scalable Protocol. JoVE. 2018;No. 139, 57704.
8. Rieke V, Pauly K. B. MR thermometry. Journal of Magnetic Resonance Imaging. 2008; 27(2):376 –390.
Figures