2698
Point-wise k-space evaluation for spatial encoding magnetic fields for magnet optimizations1Singapore University of Technology and Design, Singapore, Singapore, 2Chiba University, Chiba, Japan, 3Jiangsu LiCi Medical Device Co. Ltd, Lianyungang, China, 4Zhejiang University, Hangzhou, China
Synopsis
Keywords: Low-Field MRI, Magnets (B0)
Motivation: The current optimizations of permanent magnet array (PMA) designs are guided by checking field properties, not reflecting the quality of reconstructed images.
Goal(s): We aim to propose indicating parameters for the encoding capability of spatial encoding magnetic fields (SEMs) to guide PMA designs.
Approach: Local k-spaces are pushed to be point-wise. The coverage area of the point-wise k-spaces between the spokes of the maximum and minimum angles is calculated to indicate the encoding capability.
Results: The proposed method is fast, enlarging the optimization space, resulting in SEMs having superior encoding capability with stronger field, higher gradient, and lower NRMSE of the resultant images.
Impact: The proposed point-wise k-space evaluation enlarges the solution space for the PMA optimizations thus significantly improves the performances of the outcomes, i.e., SEMs having superior encoding capability with higher field strength and higher gradient compared to that from conventional approachs.
Introduction
Permanent magnet array (PMA) designs are important for portable magnetic resonance imaging (MRI) due to low power consumption. The current PMA designs with built-in gradients are guided by checking the quality of simulated reconstruction images1. This time-consuming process is usually simplified to checking target field properties (strength and patterns) to save time1,2. However, field properties and image quality may not always be correlated. Here, we proposed point-wise k-space, an intermediate parameter to indicate the encoding capability of a spatial encoding magnetic field (SEM) to guide PMA designs. It saves time with significantly improved correlation to image quality.Methods
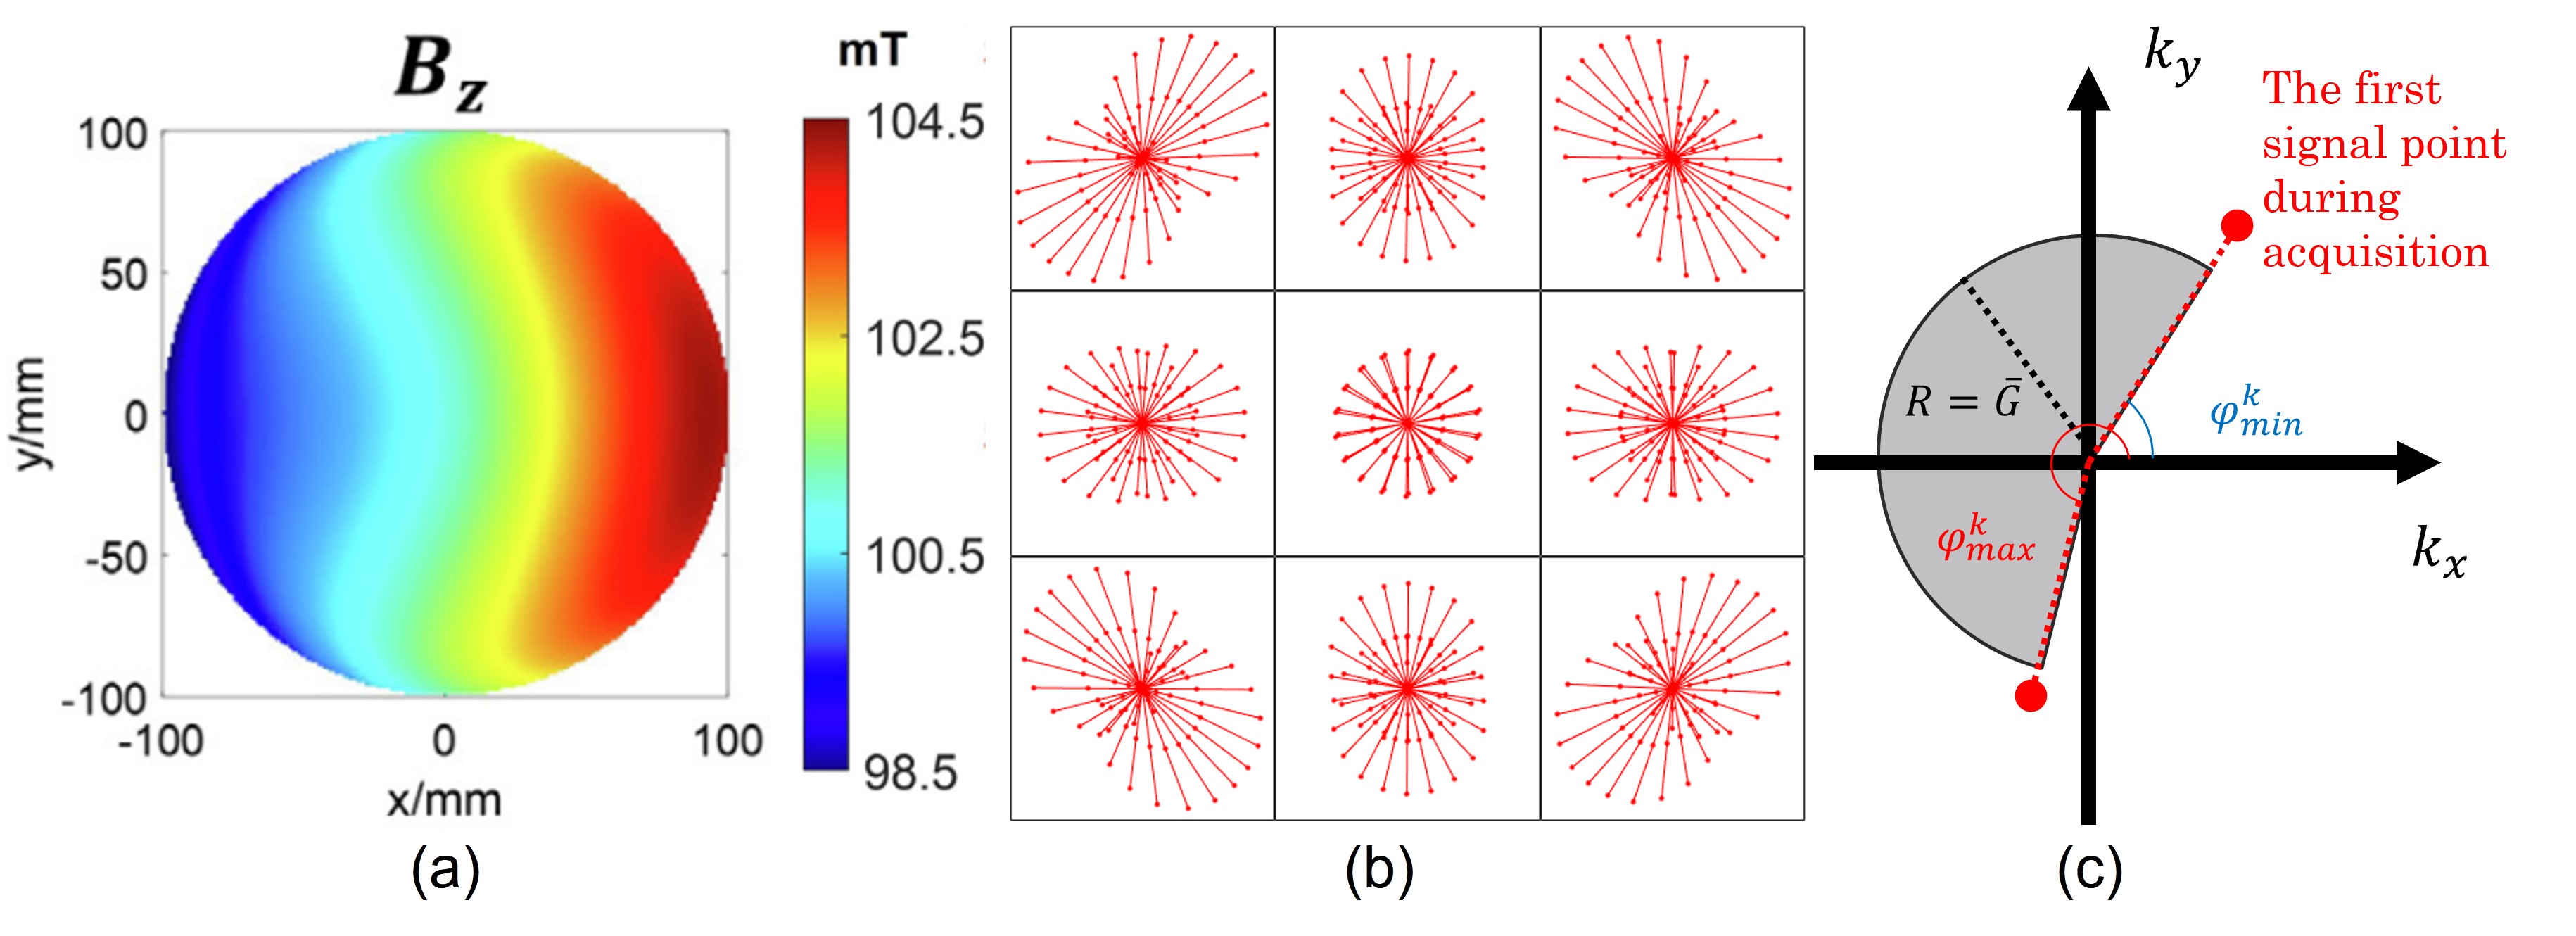
The local k-space is the spatial gradient of the accumulated phase at a location3. Using SEMs, acquisitions are taken at the n-th SEMs with $$$n_t$$$ time steps and a step size of $$$\Delta t$$$. The local k-space during the time $$$t=n_t\cdot\Delta t$$$ is expressed as $$\vec{k}(\vec{r},t,n)=\gamma\sum_0^{n_t}{\nabla\vec{B}_{SEM}(\vec{r},n)\cdot\Delta t} (1)$$ where $$$\gamma$$$ is the gyromagnetic constant, $$$\nabla\vec{B}_{SEM}(\vec{r},n)$$$ is the n-th SEM. When rotational SEMs (rSEMs) are used, the n-th SEM corresponds to an angle $$$\theta$$$, $$$\vec{k}(\vec{r},t,n)=\vec{k}(\vec{r},t,\theta)$$$. Assuming a fixed $$$\Delta t$$$, we can deduce the relationship between the local k-space and the SEM as follows: $$\vec{k}(\vec{r},t,\theta)\propto\nabla\vec{B}_{SEM}(\vec{r},\theta)\cdot\Delta t(2)$$ Therefore, the gradient $$$\vec{G}(\vec{r},\theta)=\nabla\vec{B}_{SEM}(\vec{r},\theta)$$$ is proportional to the local k-space value. For evaluation using local k-space, usually the field-of-view (FOV) is split into a few blocks, and the local k-space at the center is plotted to represent the whole block3. Fig.1(b) shows 3-by-3 local k-spaces of the SEM in Fig.1(a) when it rotates. For each plot, a spoke contains the signal points at one angle. Larger coverage of the spokes (higher gradients and wider spreading) indicates better encoding capability. This approach can only tell the encoding capability of an SEM when it changes slowly, i.e., the block shares similar fields as the center. To evaluate SEMs accurately and efficiently, local k-spaces are pushed to be point-wise. An intermediate parameter, $$$k_p$$$, is proposed to evaluate the encoding capability of the field. For rSEMs, $$$k_p$$$ is defined as the multiplication of the arc-shape area covered by the spokes (Fig.1(c)) and a penalty for gradient ununiformity: $$k_p(\vec{r})=\gamma\Delta t A_\text{arc}(1-\frac{std(G(\vec{r}))}{\bar{G}(\vec{r})}) (3)$$ where $$$A_\text{arc}=\frac{1}{2}(\varphi_{max}^k(\vec{r})-\varphi_{min}^k(\vec{r}))\bar{G}(\vec{r})$$$, $$$\varphi_{max}^k$$$ and $$$\varphi_{min}^k$$$ are the extrema k-space angles among all rotation angles, $$$\bar{G}$$$ and $$$std(G)$$$ are the average and standard deviation of the gradients over different angles at $$$\vec{r}$$$. Furthermore, for an rSEM, the point-wise k-space is axial-symmetric. Therefore, only those points along a radius are evaluated, further accelerating the evaluation process. The proposed parameter was applied to PMA optimizations. A cost function can be formulated as follows, $$L_k=min[\frac{std(k_p)}{\bar{k}_p}+\frac{std(B_{SEM})}{\bar{B}_{SEM}}] (4)$$In (4), both terms have a range of [0,1], with balanced emphasis on both the encoding capability and SEM inhomogeneity.Results & Discussions
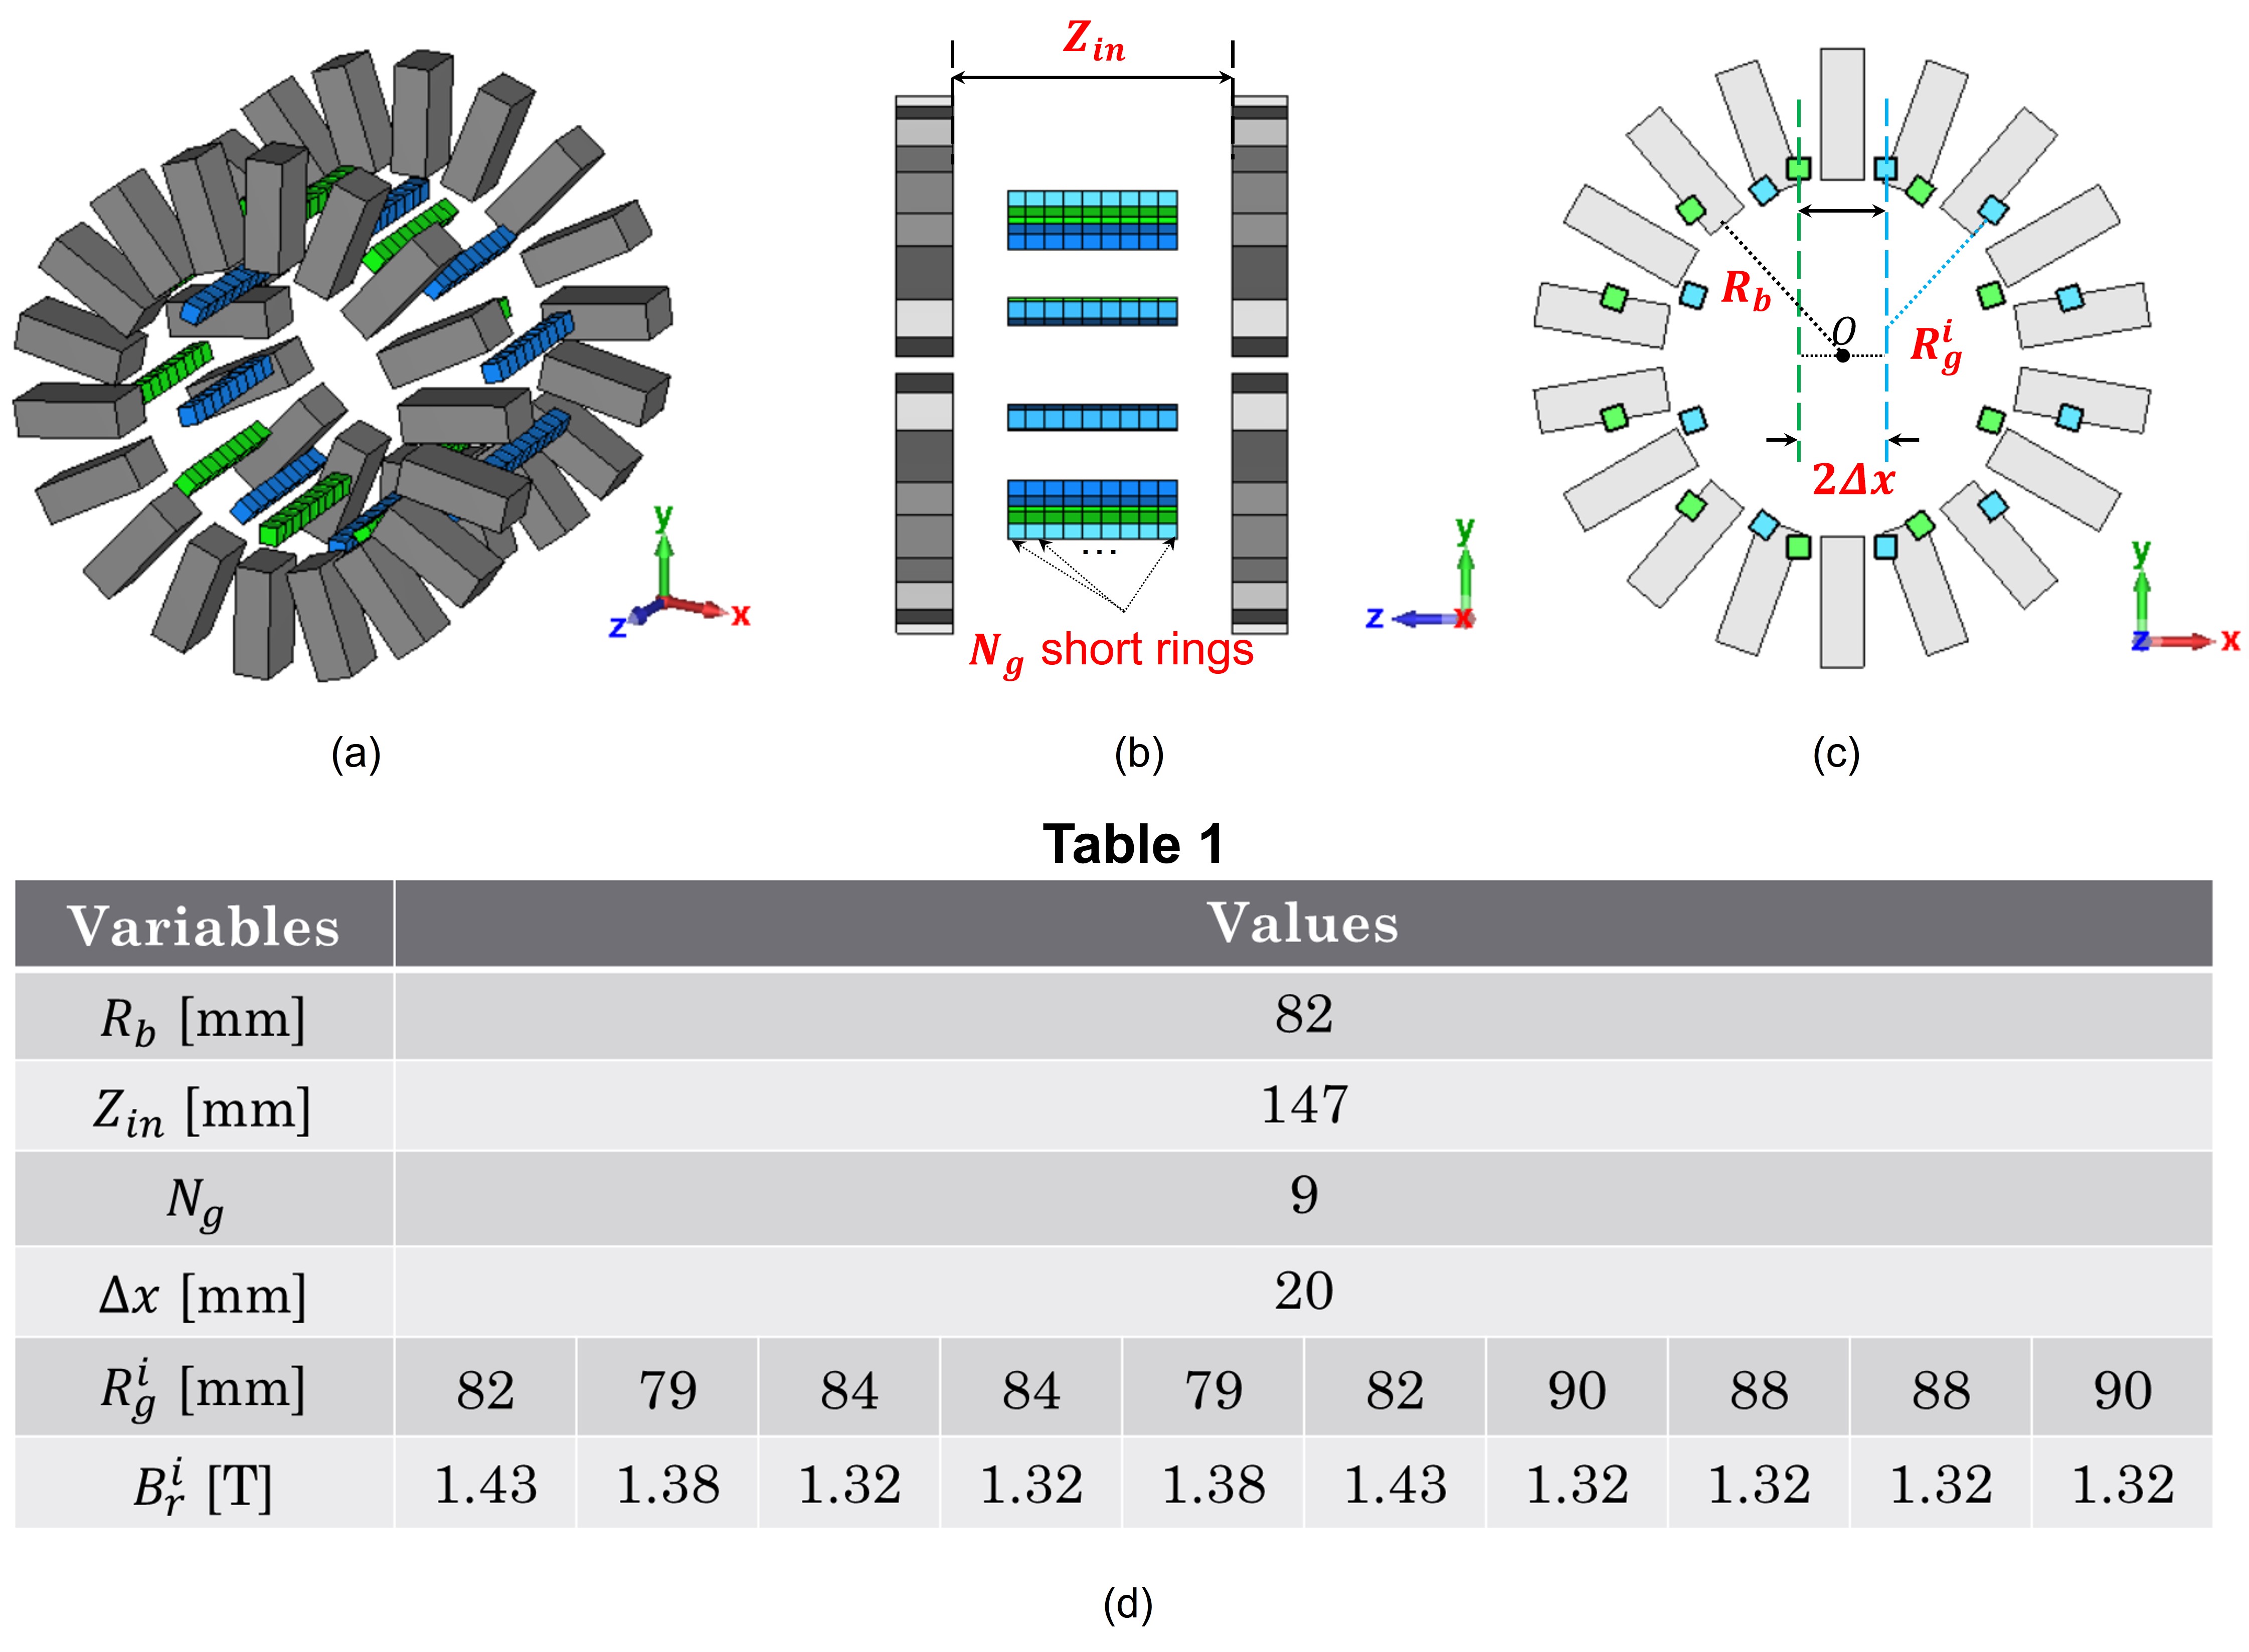
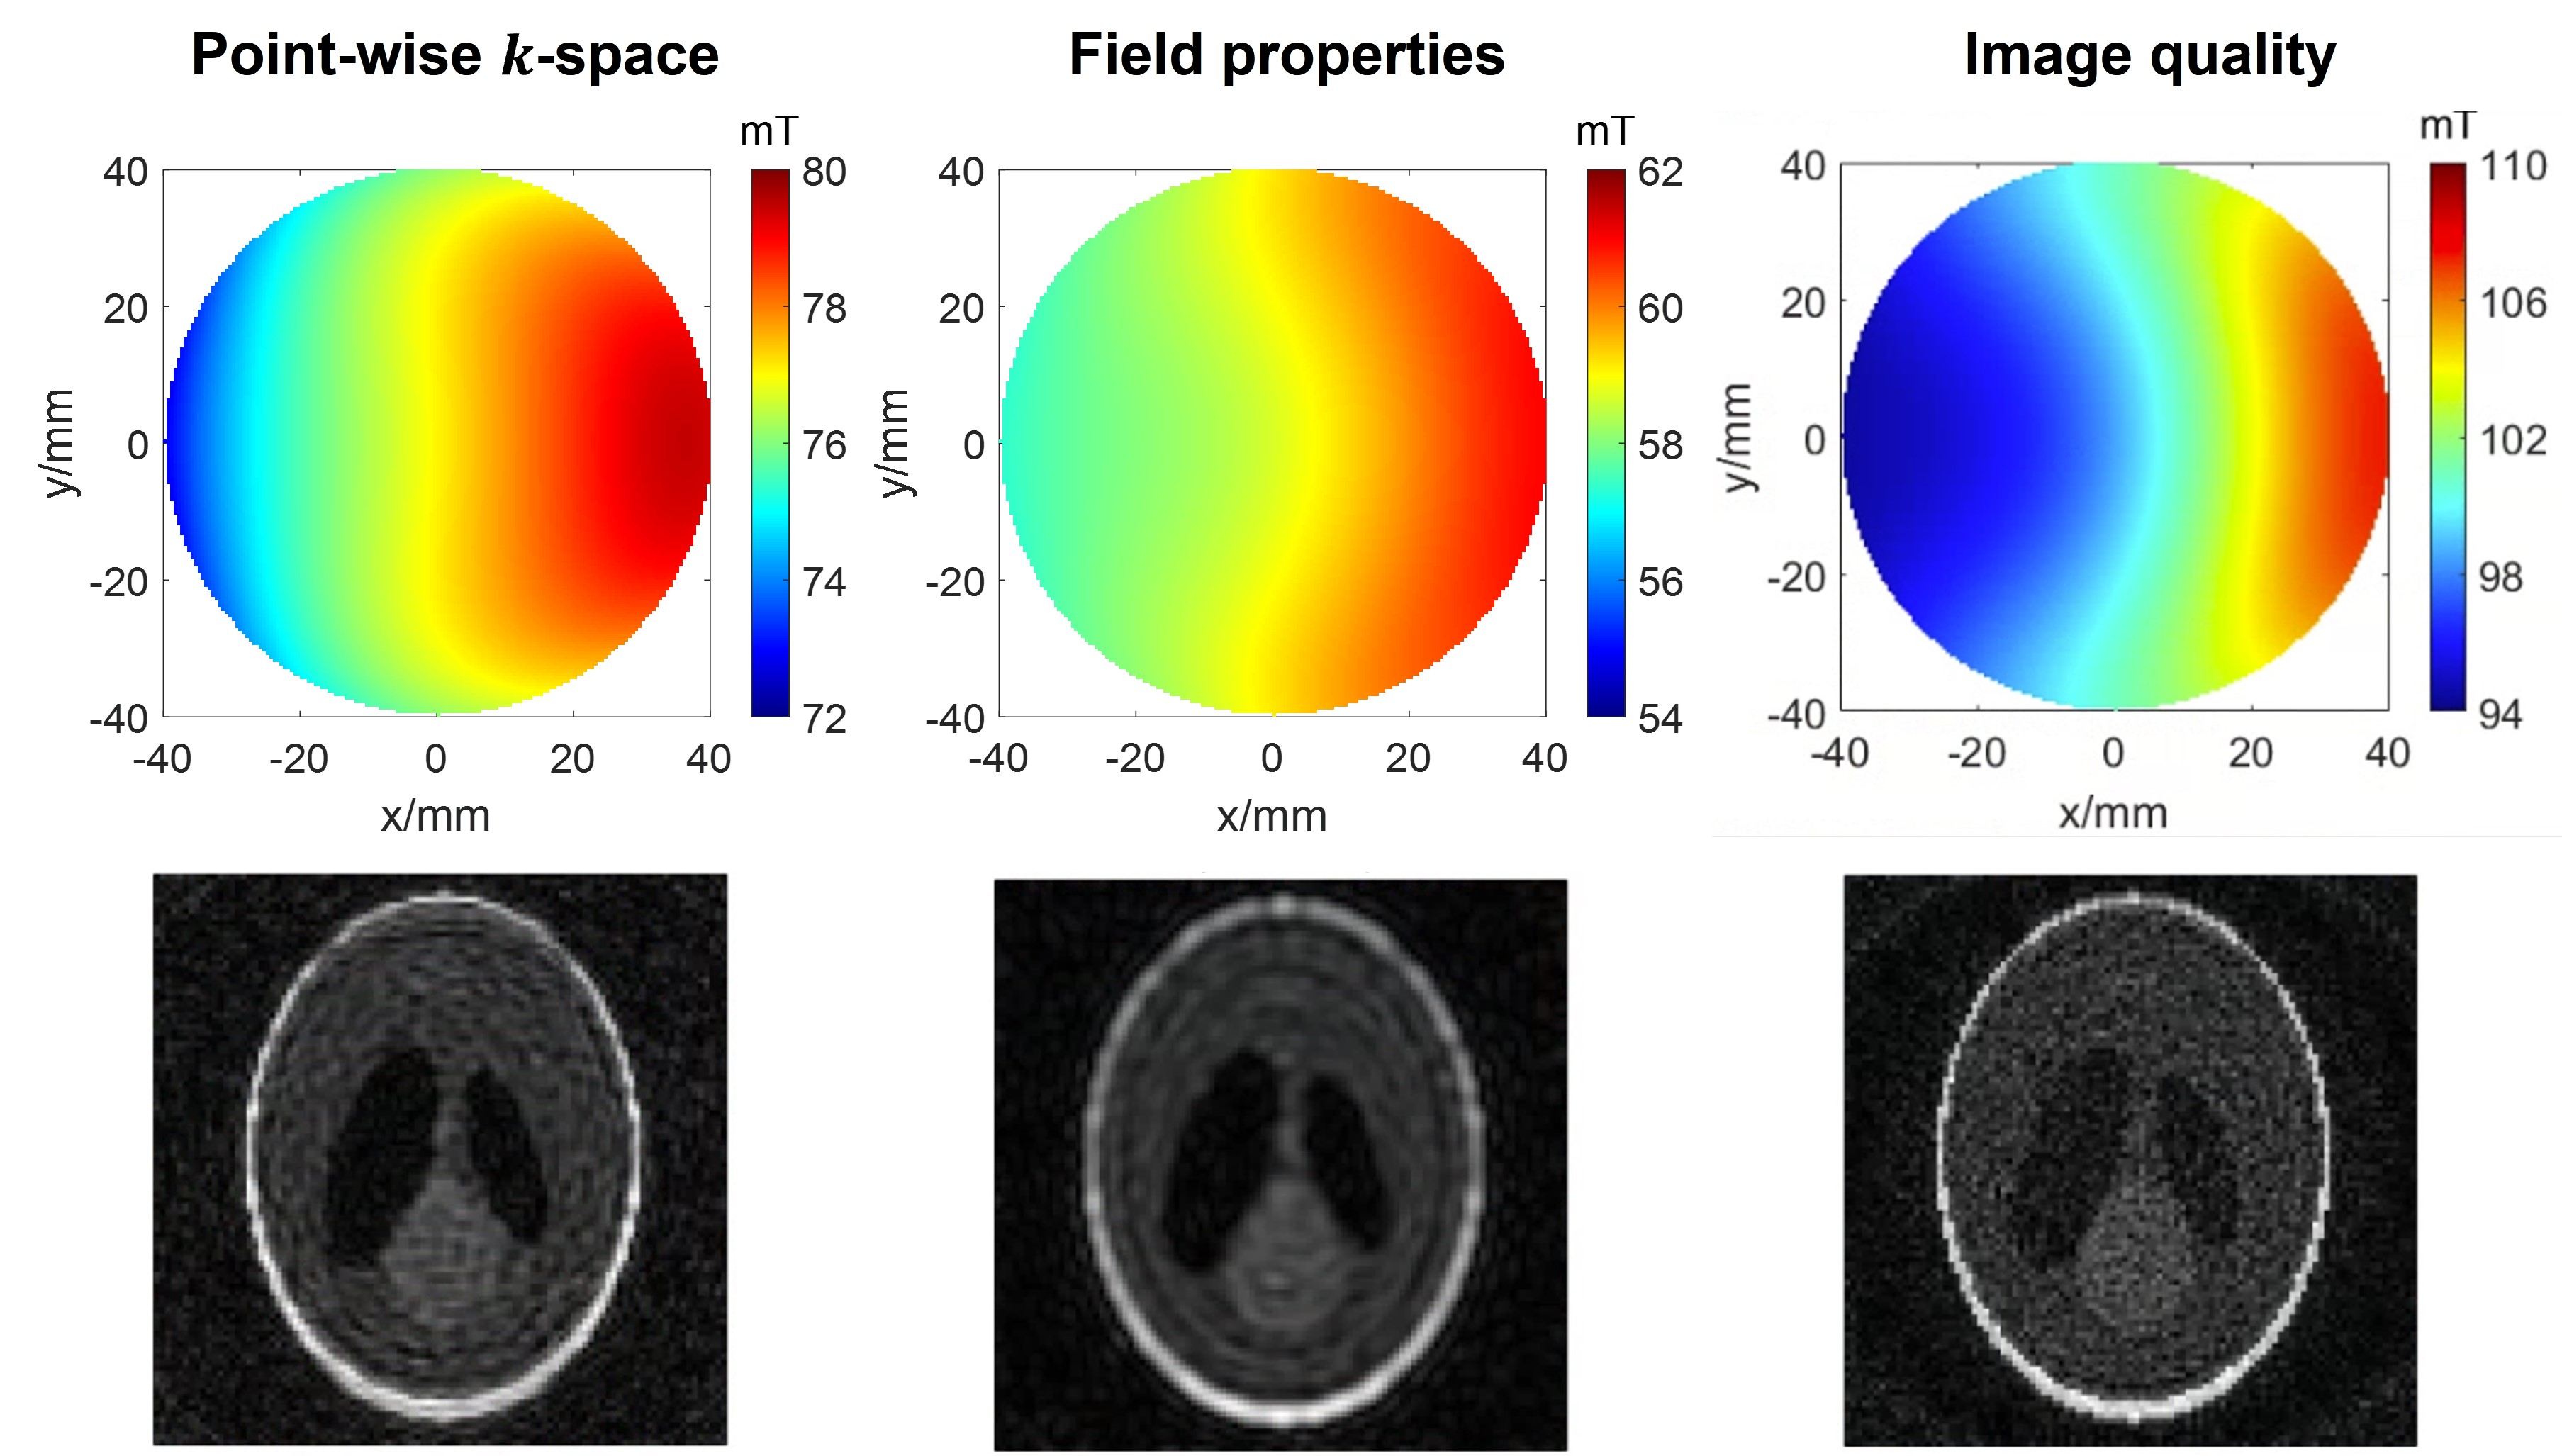
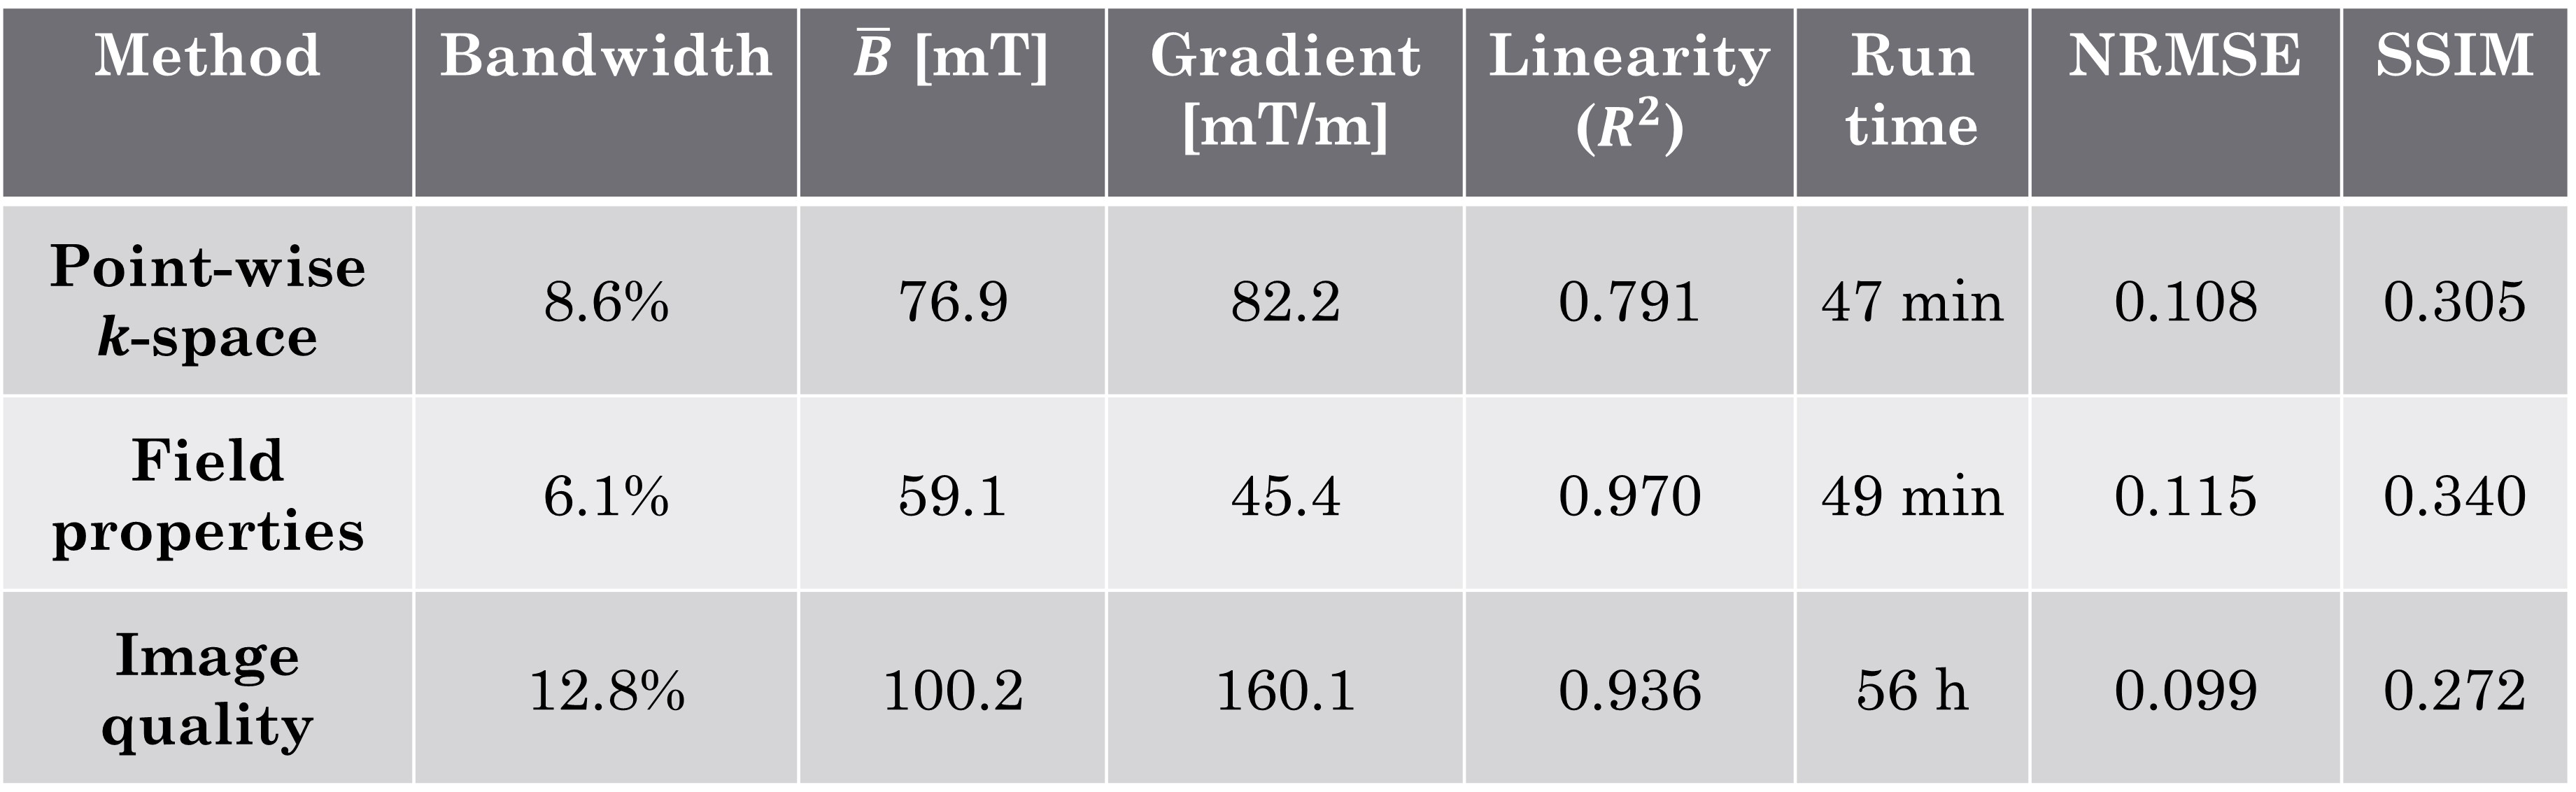
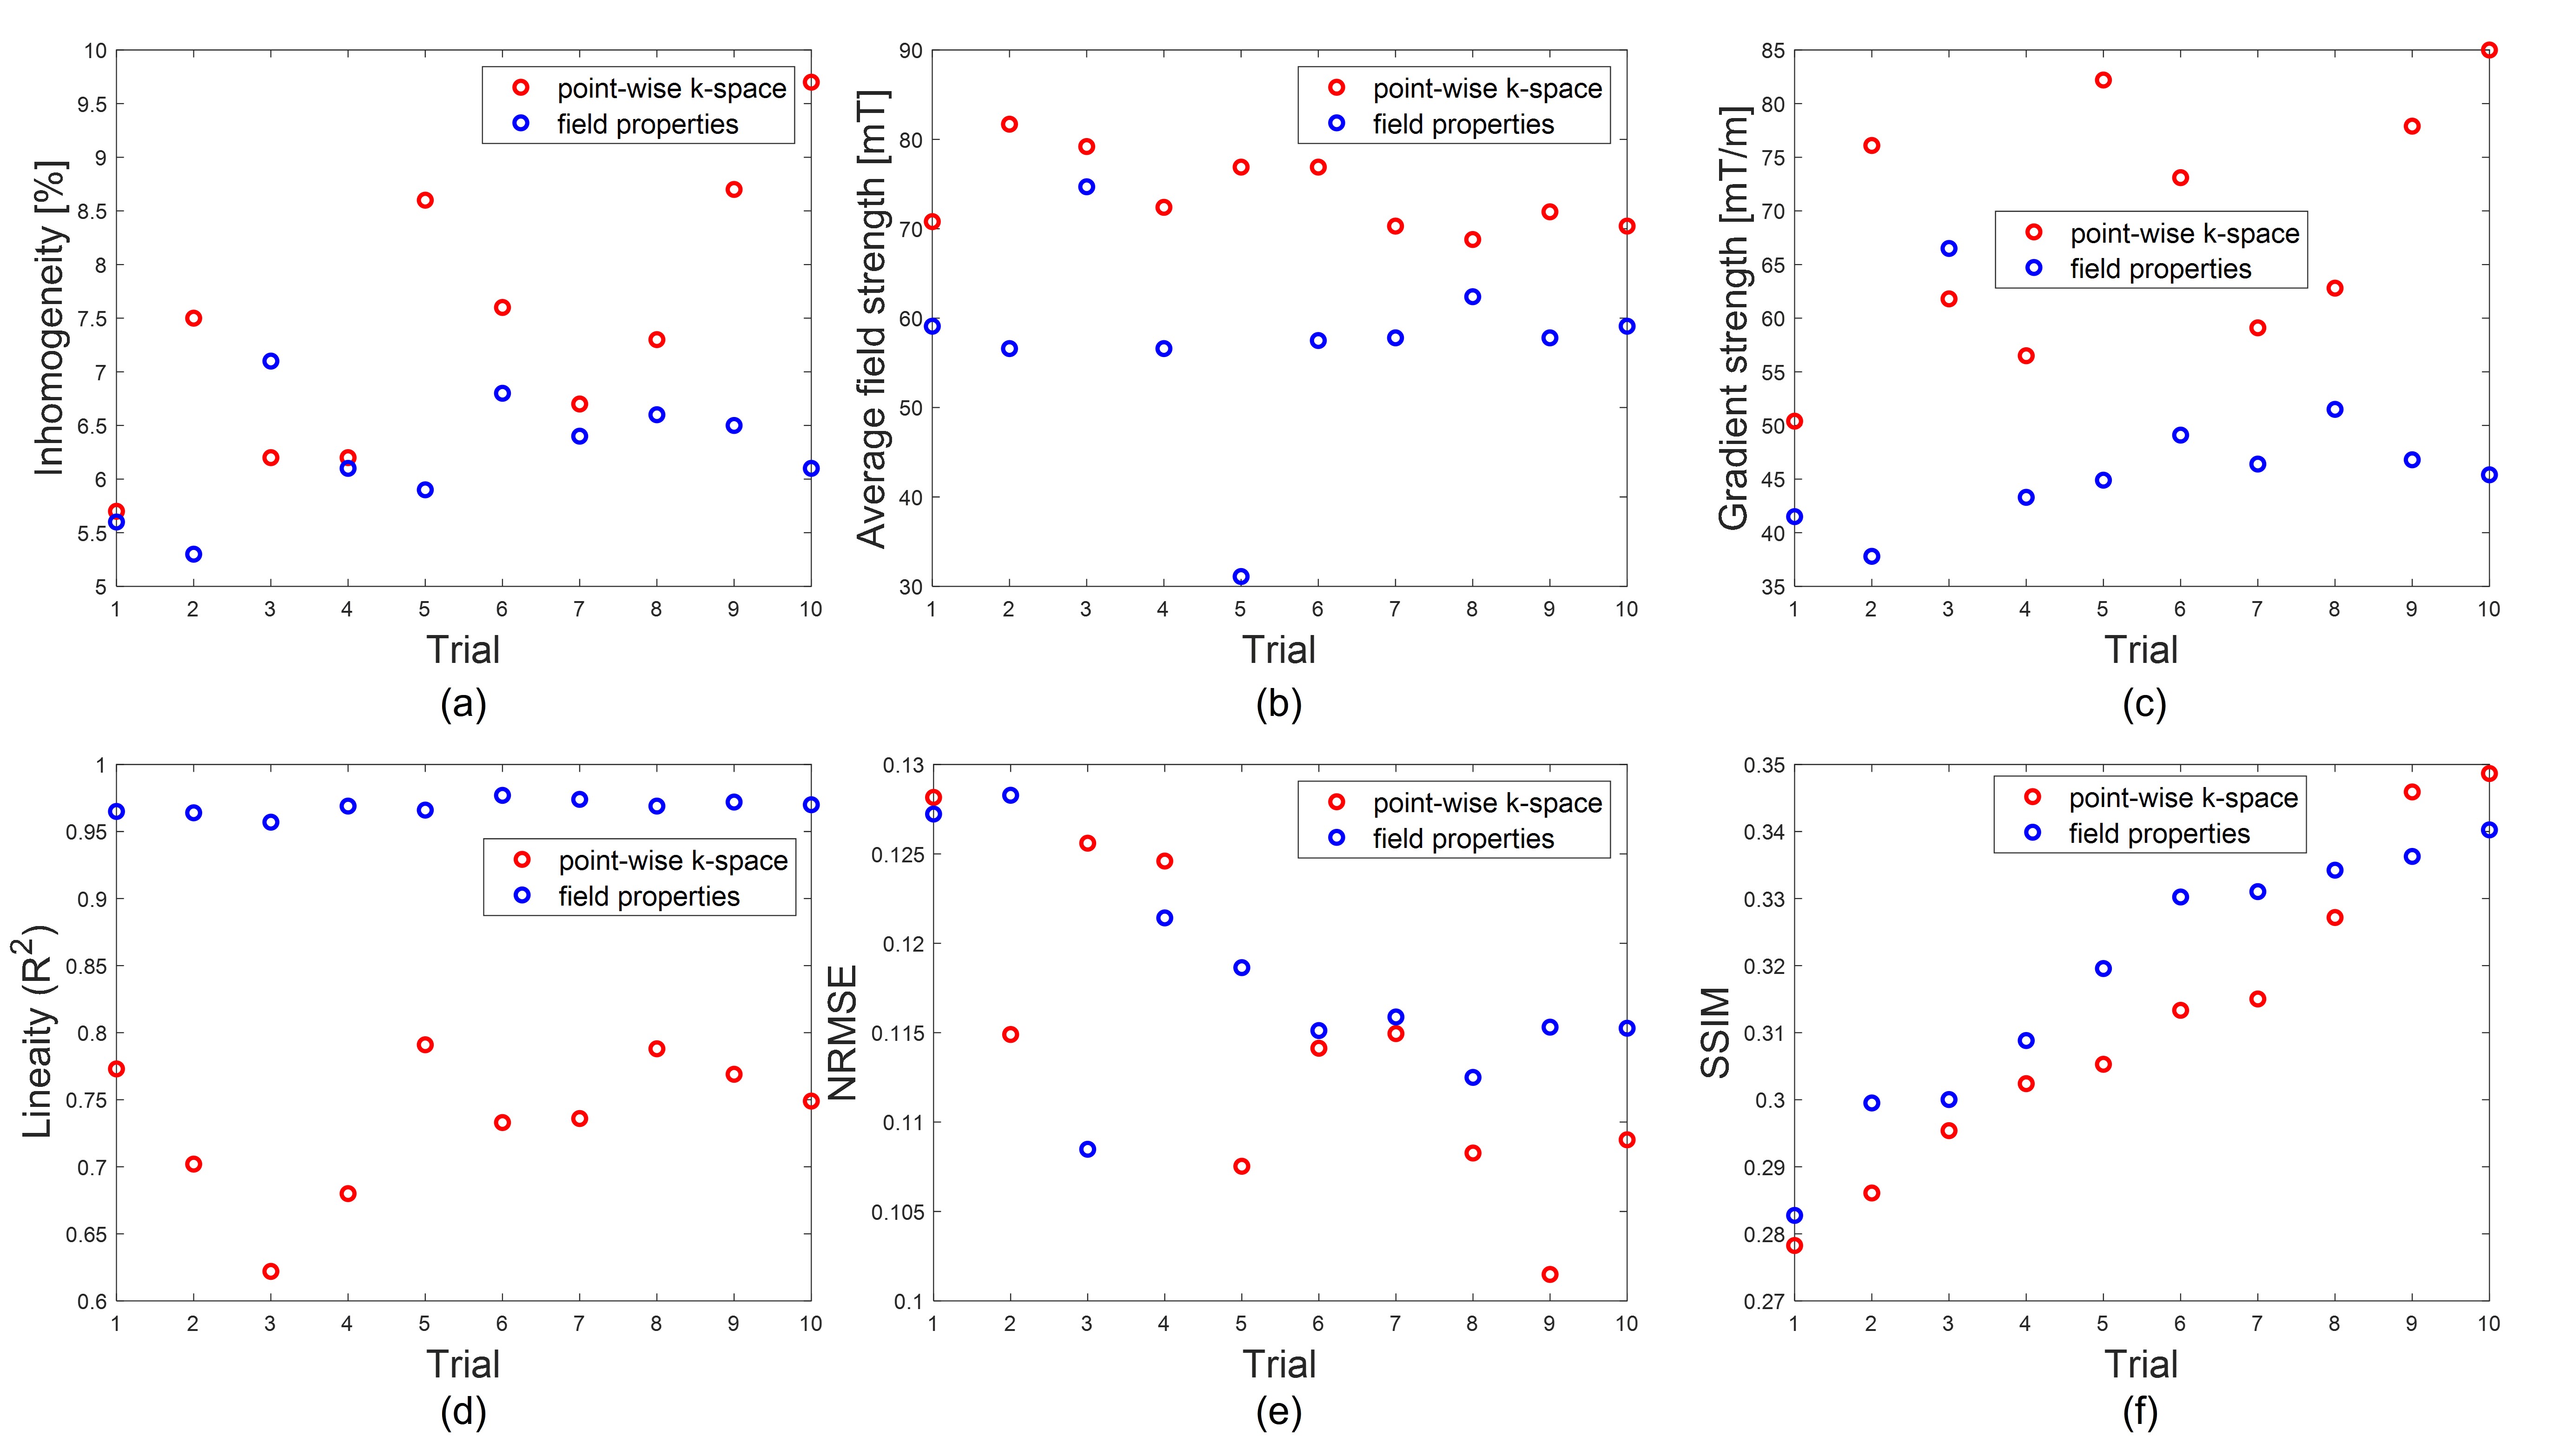
A PMA for wrist imaging (FOV: 80mm DSV) was optimized using genetic algorithm (GA) and the cost function in (4) to show the application of the proposed method. Another two traditional ways of defining the cost functions were implemented for comparison. One using the properties of magnetic field, $$$F_{field}=BW-R^2$$$, where $$$BW$$$ indicates field inhomogeneity, and $$$R^2$$$ is the determination coefficient indicating the field linearity; the other using image quality, $$$F_{image}=\text{NRMSE}-\text{SSIM}+BW$$$, involving the normalized root-mean-square error (NRMSE) and structural similarity index (SSIM). Fig.2 shows the PMA. It consists of a base array (grey), which is an inward-outward (IO) ring4,5, and a symmetric double offset ring (green and blue) to provide gradient in the x-direction1. The variables for optimization are labeled in Fig.2(a)-(c) and tabulated in Fig.2(d). Using GA, all methods have 50 iterations with a population of 50. The number of rotation angles was N=144. Fig.3 shows the optimized SEMs and the simulated images.Table 2 lists the optimization results for all methods. The proposed method and field-method are comparable for the time, while the image-method is 68 times slower. The last two columns show the NRMSE and SSIM of the simulated images in Fig.3. For the two fast methods, the proposed method outputs a design with improved performances than the field-method in terms of field strength, gradients, and the resultant NRMSE with slightly lower SSIM. To check the consistency of the comparison, ten trials were performed for k-space method and field-method with performances plotted in Fig.5. Good consistency is observed.
Conclusion
In this abstract, we propose a point-wise k-space evaluation method to accelerate and improve optimizations of PMA designs considering the SEMs encoding capability. Compared to the traditional method guided by field properties, the proposed method enlarges the optimization space, resulting in SEMs having superior encoding capability with stronger field, higher gradient, and lower NRMSE of the resultant images.Acknowledgements
No acknowledgement found.References
1. Ting-Ou Liang, Yan Hao Koh, Tie Qiu, Erping Li, Wenwei Yu, Shao Ying Huang, High-Performance Permanent Magnet Array Design by a Fast Genetic Algorithm (GA)-based Optimization for Low-Field Portable MRI, Journal of Magnetic Resonance, 2022, 107309, ISSN 1090-7807, https://doi.org/10.1016/j.jmr.2022.107309.
2. Z. H. Ren, J. Gong and S. Y. Huang, "An Irregular-Shaped Inward-Outward Ring-Pair Magnet Array With a Monotonic Field Gradient for 2D Head Imaging in Low-Field Portable MRI," in IEEE Access, vol. 7, pp. 48715-48724, 2019, doi: 10.1109/ACCESS.2019.2909834.
3. D. Gallichan, C. A. Cocosco, A. Dewdney, G. Schultz, A. Welz, J. Hennig, and M. Zaitsev, ‘‘Simultaneously driven linear and nonlinear spatial encoding fields in MRI,’’ Magn. Reson. Med., vol. 65, no. 3, pp. 702–714, 2011.
4. G. Aubert, “Permanent magnet for nuclear magnetic resonance imaging equipment,” July 26, 1994. US Patent 5,332,971
5. G. Miyajima, Cylindrical permanent magnet apparatus, Japanese Patent JPS60210804A (Oct.23, formally Apr. 4, 1984 1985).
Figures