2686
In vivo Breast T1 Mapping at Ultra-Low Field (6.5 mT): Variable Flip Angle Method1MGH/A. A. Martinos Center for Biomedical Imaging, Boston, MA, United States, 2Harvard Medical School, Boston, MA, United States, 3Radiology, Massachusetts General Hospital, Boston, Boston, MA, United States, 4National Institute of Standards and Technology, Boulder, CO, United States, 5University of Colorado, Boulder, CO, United States, 6University of Sydney, Sydney, Australia, 7Department of Physics, Harvard University, Cambridge, MA, United States
Synopsis
Keywords: Quantitative Imaging, Breast
Motivation: The fractional T1 differences between healthy and abnormal tissue are significant larger in the ultra-low-field (ULF) regime (<10 mT) compared to high field.
Goal(s): Despite the challenges of imaging at ULF (predominately low SNR and spatial-temporal resolution), we demonstrate in vivo T1 mapping in the breast at 6.5 mT in 43 minutes.
Approach: A variable flip angle (VFA) method with B1 correction was used.
Results: T1 mapping of CuSO4 solutions showed an average T1 deviation <7% compared to reference T1 measurements. Breast phantom T1 mapping was also performed. Finally, this method was applied on two healthy female volunteers.
Impact: This work explores ultra-low field T1 mapping as potential biomarker for low-cost breast imaging. We demonstrate the feasibility of quantitative T1 mapping of the human breast in healthy female volunteers at 6.5 mT using a variable flip angle method.
Introduction
Proton T1 values of a given tissue decrease with decreasing magnetic field strength, and in general larger fractional T1 differences between tissue-types, a behavior known as T1-dispersion1. To differentiate healthy tissues from tumor tissue2, quantitative ultra-low field (ULF) imaging can be explored as a diagnostic tool, especially in breast cancer patients. Recently, despite its reduced spatial/temporal resolution and SNR, ULF MR has demonstrated significant advances in disease detection, translating into the growing deployment of scanners in healthcare, especially in critical care settings3,4. In this work, we demonstrate the first in vivo T1 measurements of breast tissue at 6.5 mT (276 kHz) using a variable flip angle (VFA) method5. The method was validated in phantoms of different CuSO4 concentrations and in a commercial breast phantom6.Method
The VFA method was used for T1 and B1 mapping. This method applies a 3D spoiled gradient echo (SPGR) sequence at different flip angles. Equation (1) describes the signal $$$S_{n}$$$ resulting from SPGR acquisitions with different flip angles, $$$\alpha_{n}$$$. S0 is the equilibrium signal, TR - the repetition time, and T1 - the longitudinal relaxation time.$$$S_{n}=S_{0}\cdot sin\alpha_{n}\cdot \left( \frac{1-exp\left( -\frac{TR}{T1} \right)}{1-cos\alpha_{n}\cdot exp\left( -\frac{TR}{T1} \right)} \right)$$$ (1)
The nominal flip angle, $$$\alpha_{norm}$$$, and the true flip angle, $$$\alpha$$$ are related by:
$$$\alpha=\eta_{\alpha}\cdot \alpha_{norm}$$$ (2)
where $$$\eta_{\alpha}$$$ is a spatially varying calibration factor that is independent of $$$\alpha_{norm}$$$.
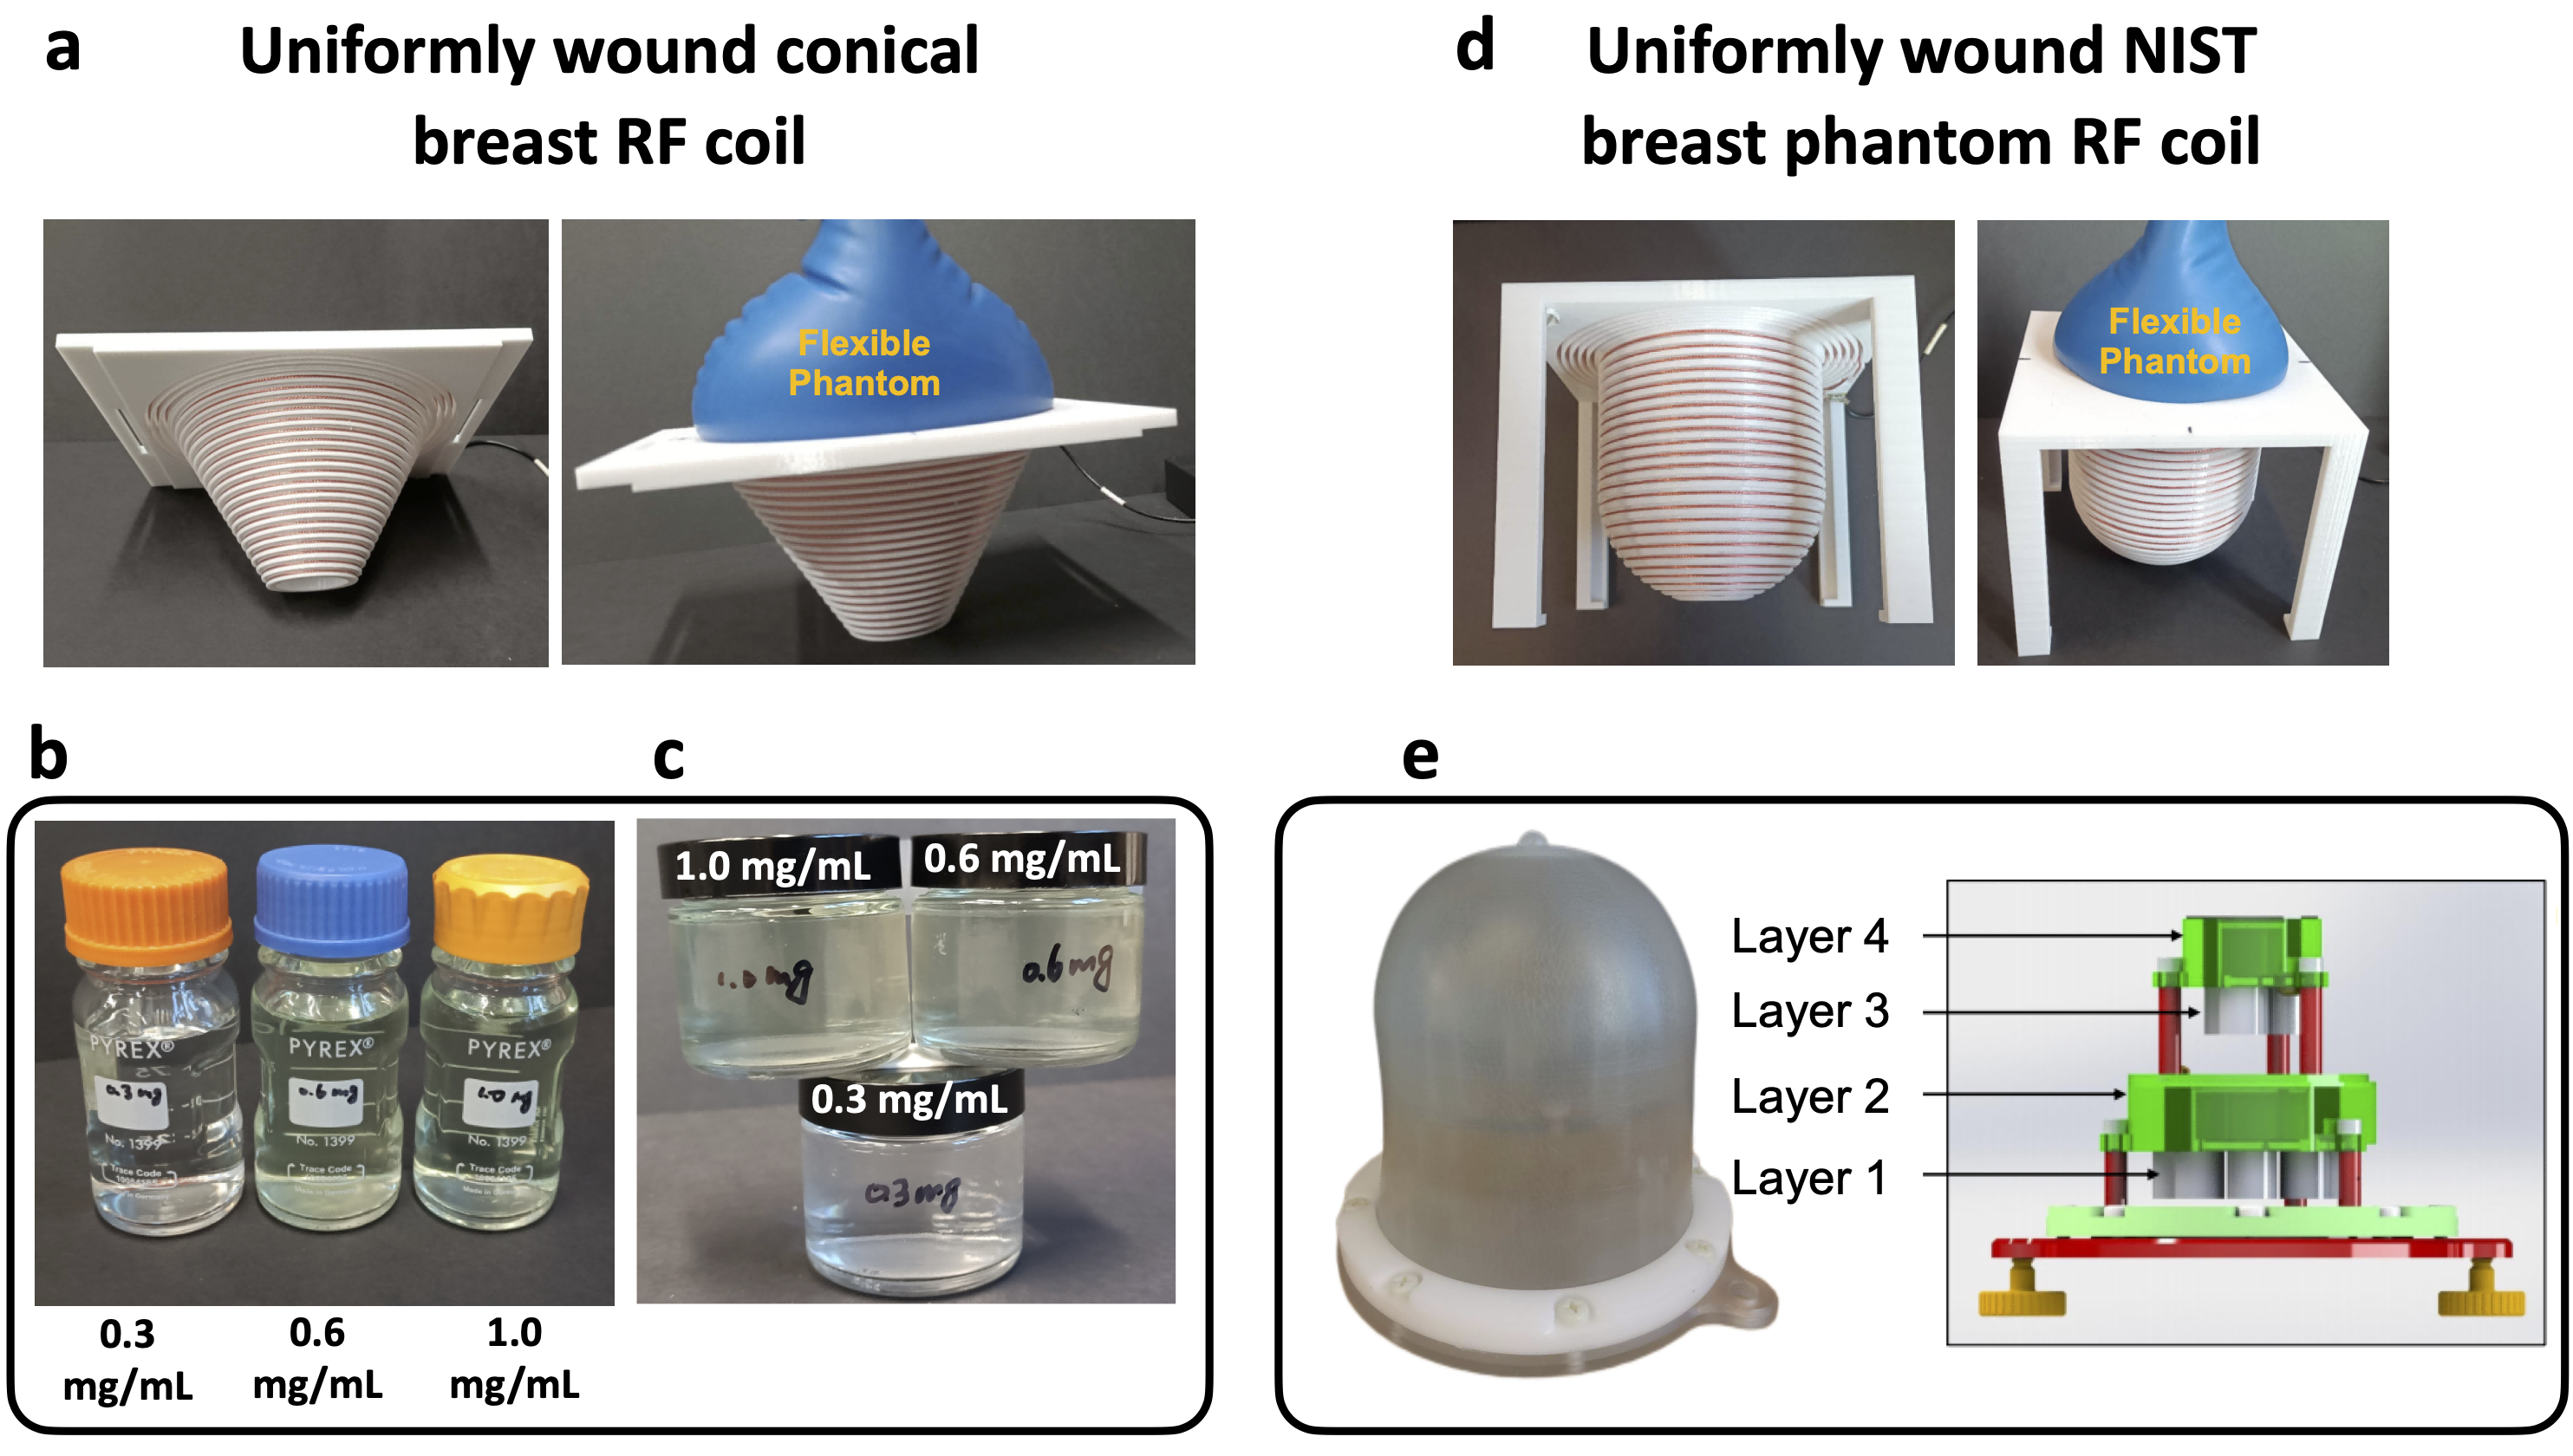
3D B1 map was computed for two RF coils, as in Fig. 1 (a, d), using a flexible phantom of known T1 value (reference value determined with an inverse recovery sequence). The B1 map was calculated using the flexible phantom with an SPGR sequence at two different flip angles and fitting the nominal flip angles and signal $$$S_{n}$$$ into equation (1). The calculated B1 map represents the distribution of the flip angle calibration factor, $$$\eta_{\alpha}$$$, and was used to correct the T1 map.
T1 mapping of various CuSO4 concentrations was performed either individually or simultaneously (in Fig. 1b-c) to evaluate the T1 accuracy of the VFA method. The T1 map of the breast phantom (CaliberMRI) was also computed at 6.5 mT. Then our proposed method was applied in vivo on two healthy participants under IRB consent. In vivo data were reviewed by a breast radiologist.
For CuSO4 phantom imaging and breast imaging, the SPGR sequence parameters were: TE/TR = 13/26 ms, a matrix size of 64 × 72 × 21, voxel size = 3 mm × 3 mm × 8 mm, number of averages (NA) = 50, undersampling ratio = 70%, scan time = 21 minutes 36 seconds.
For breast phantom imaging, the SPGR acquisitions had: TE/TR = 12/24 ms, matrix size = 50 × 50 × 15, voxel size = 2 mm × 2 mm × 20 mm, NA = 150, an undersampling ratio of 70%, scan time = 31 minutes. The flip angles used in all SPGR acquisitions were 9° and 30°.
Results
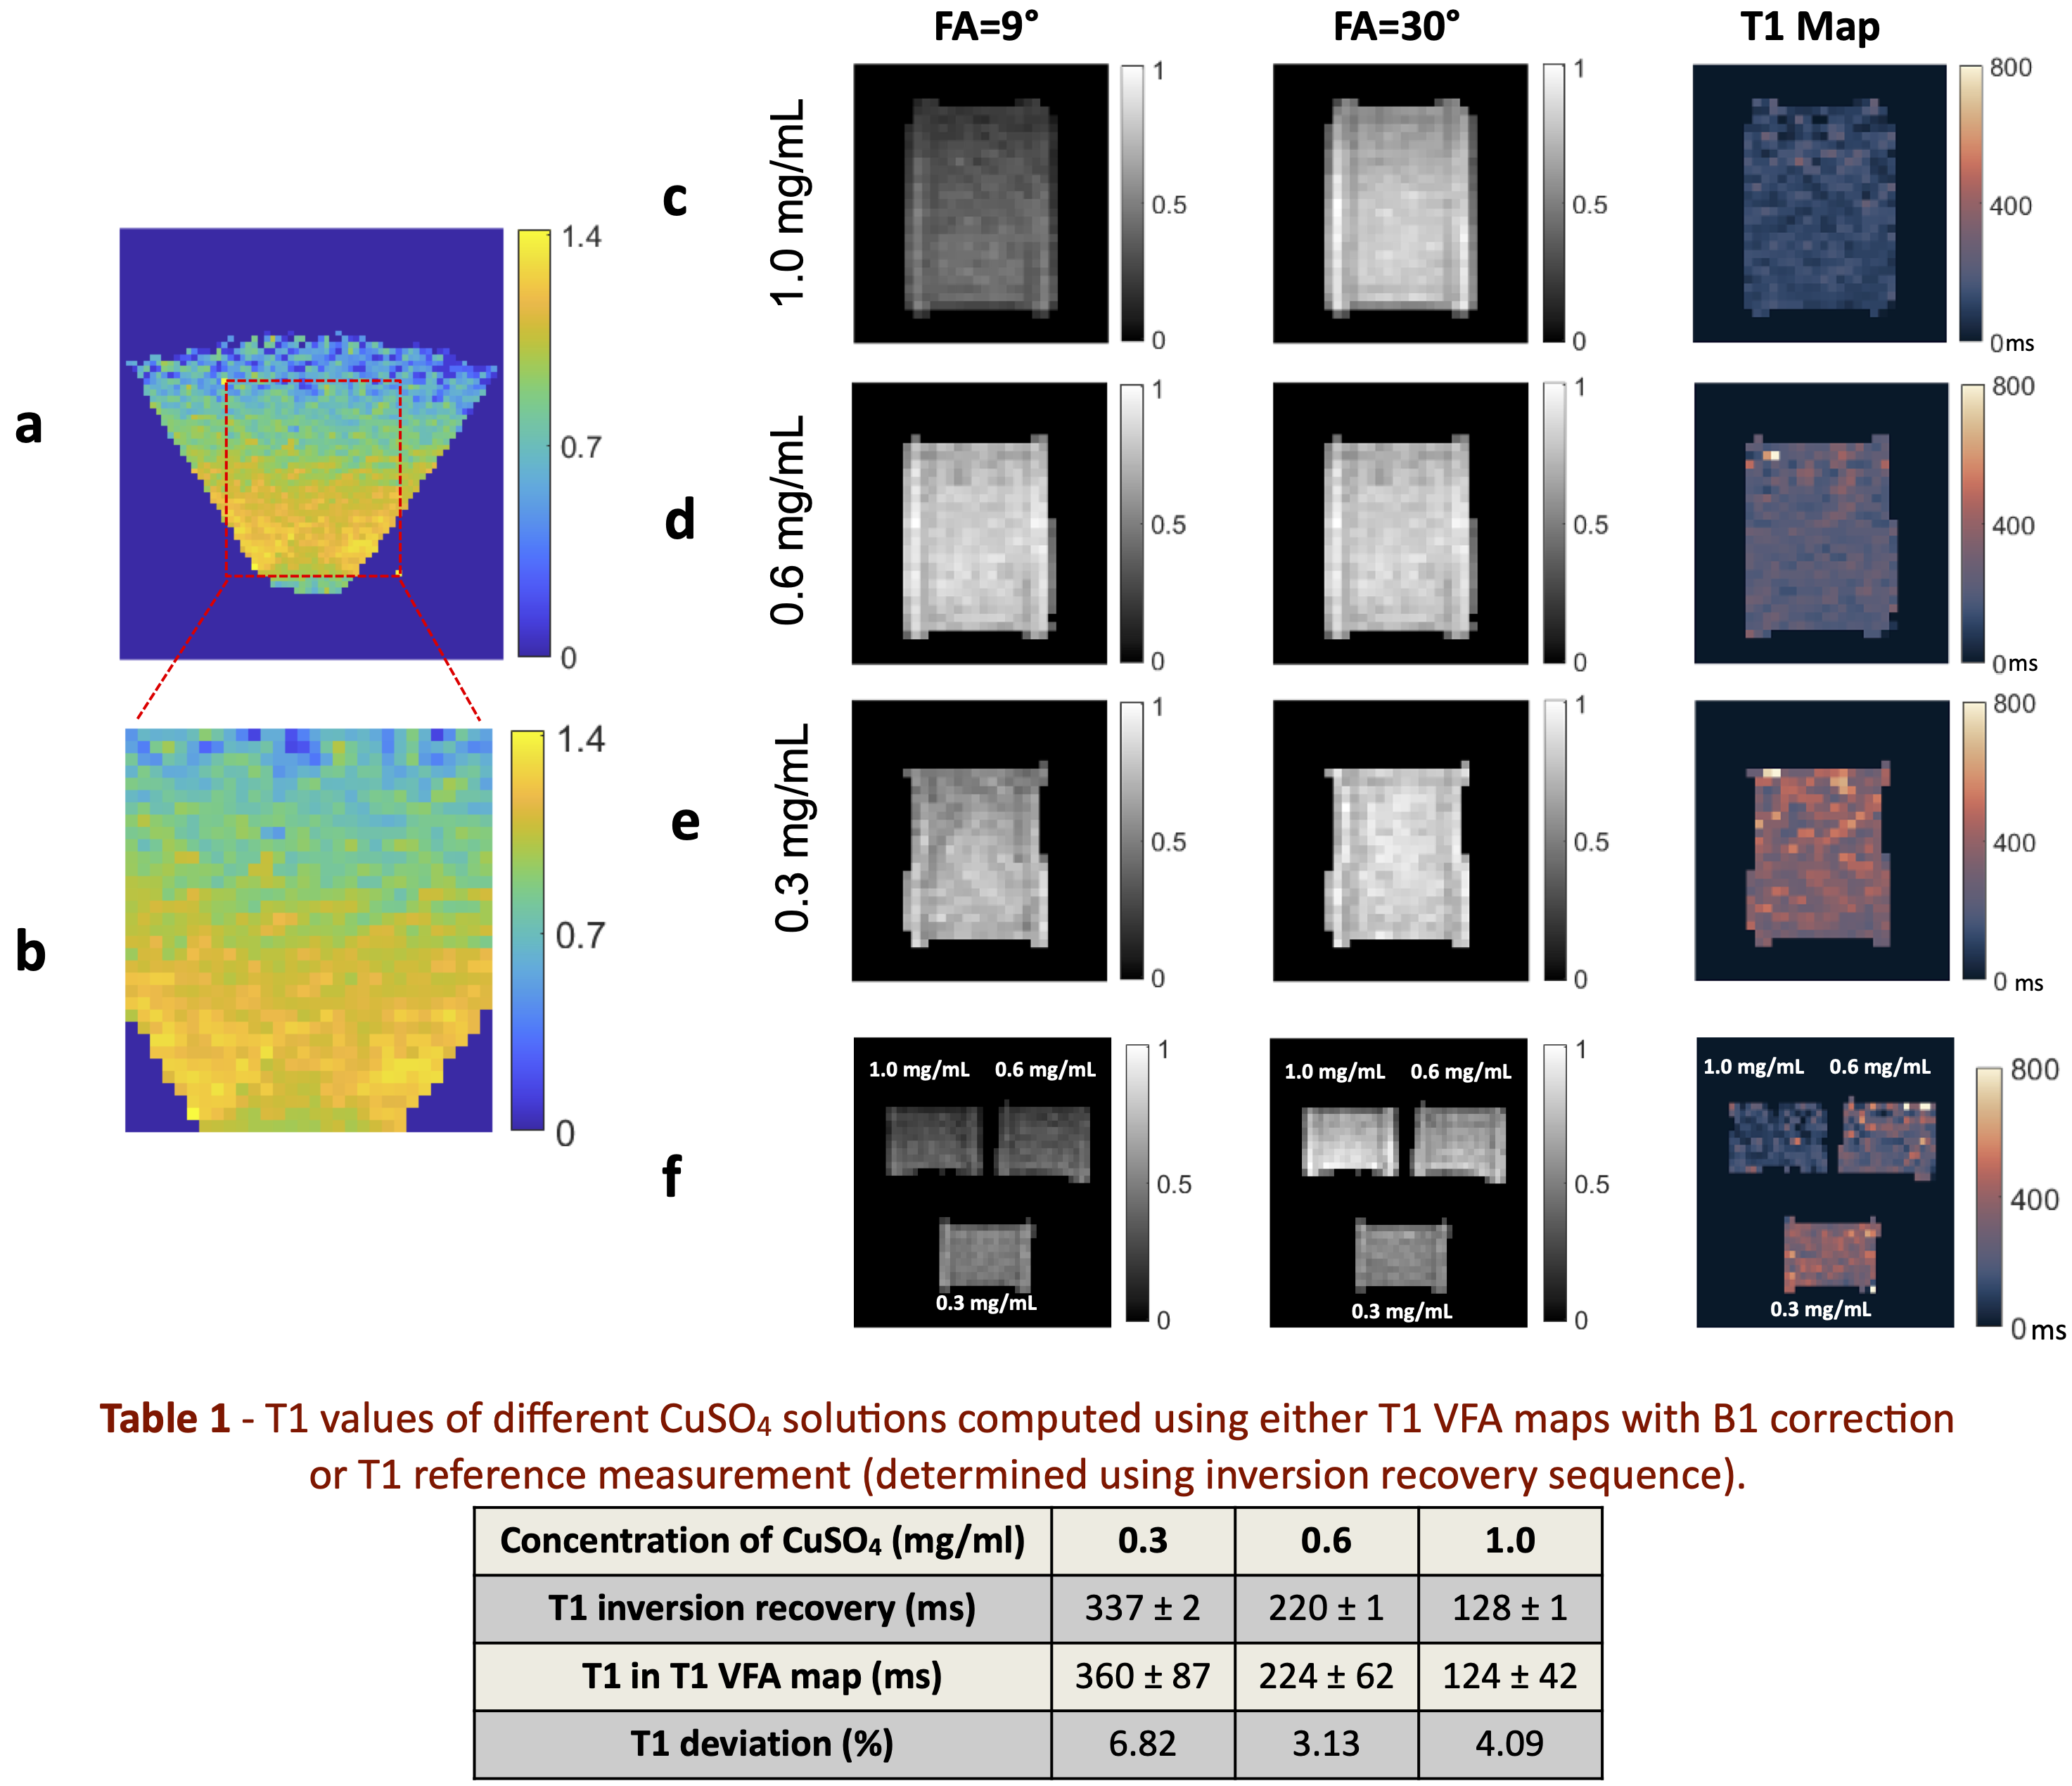
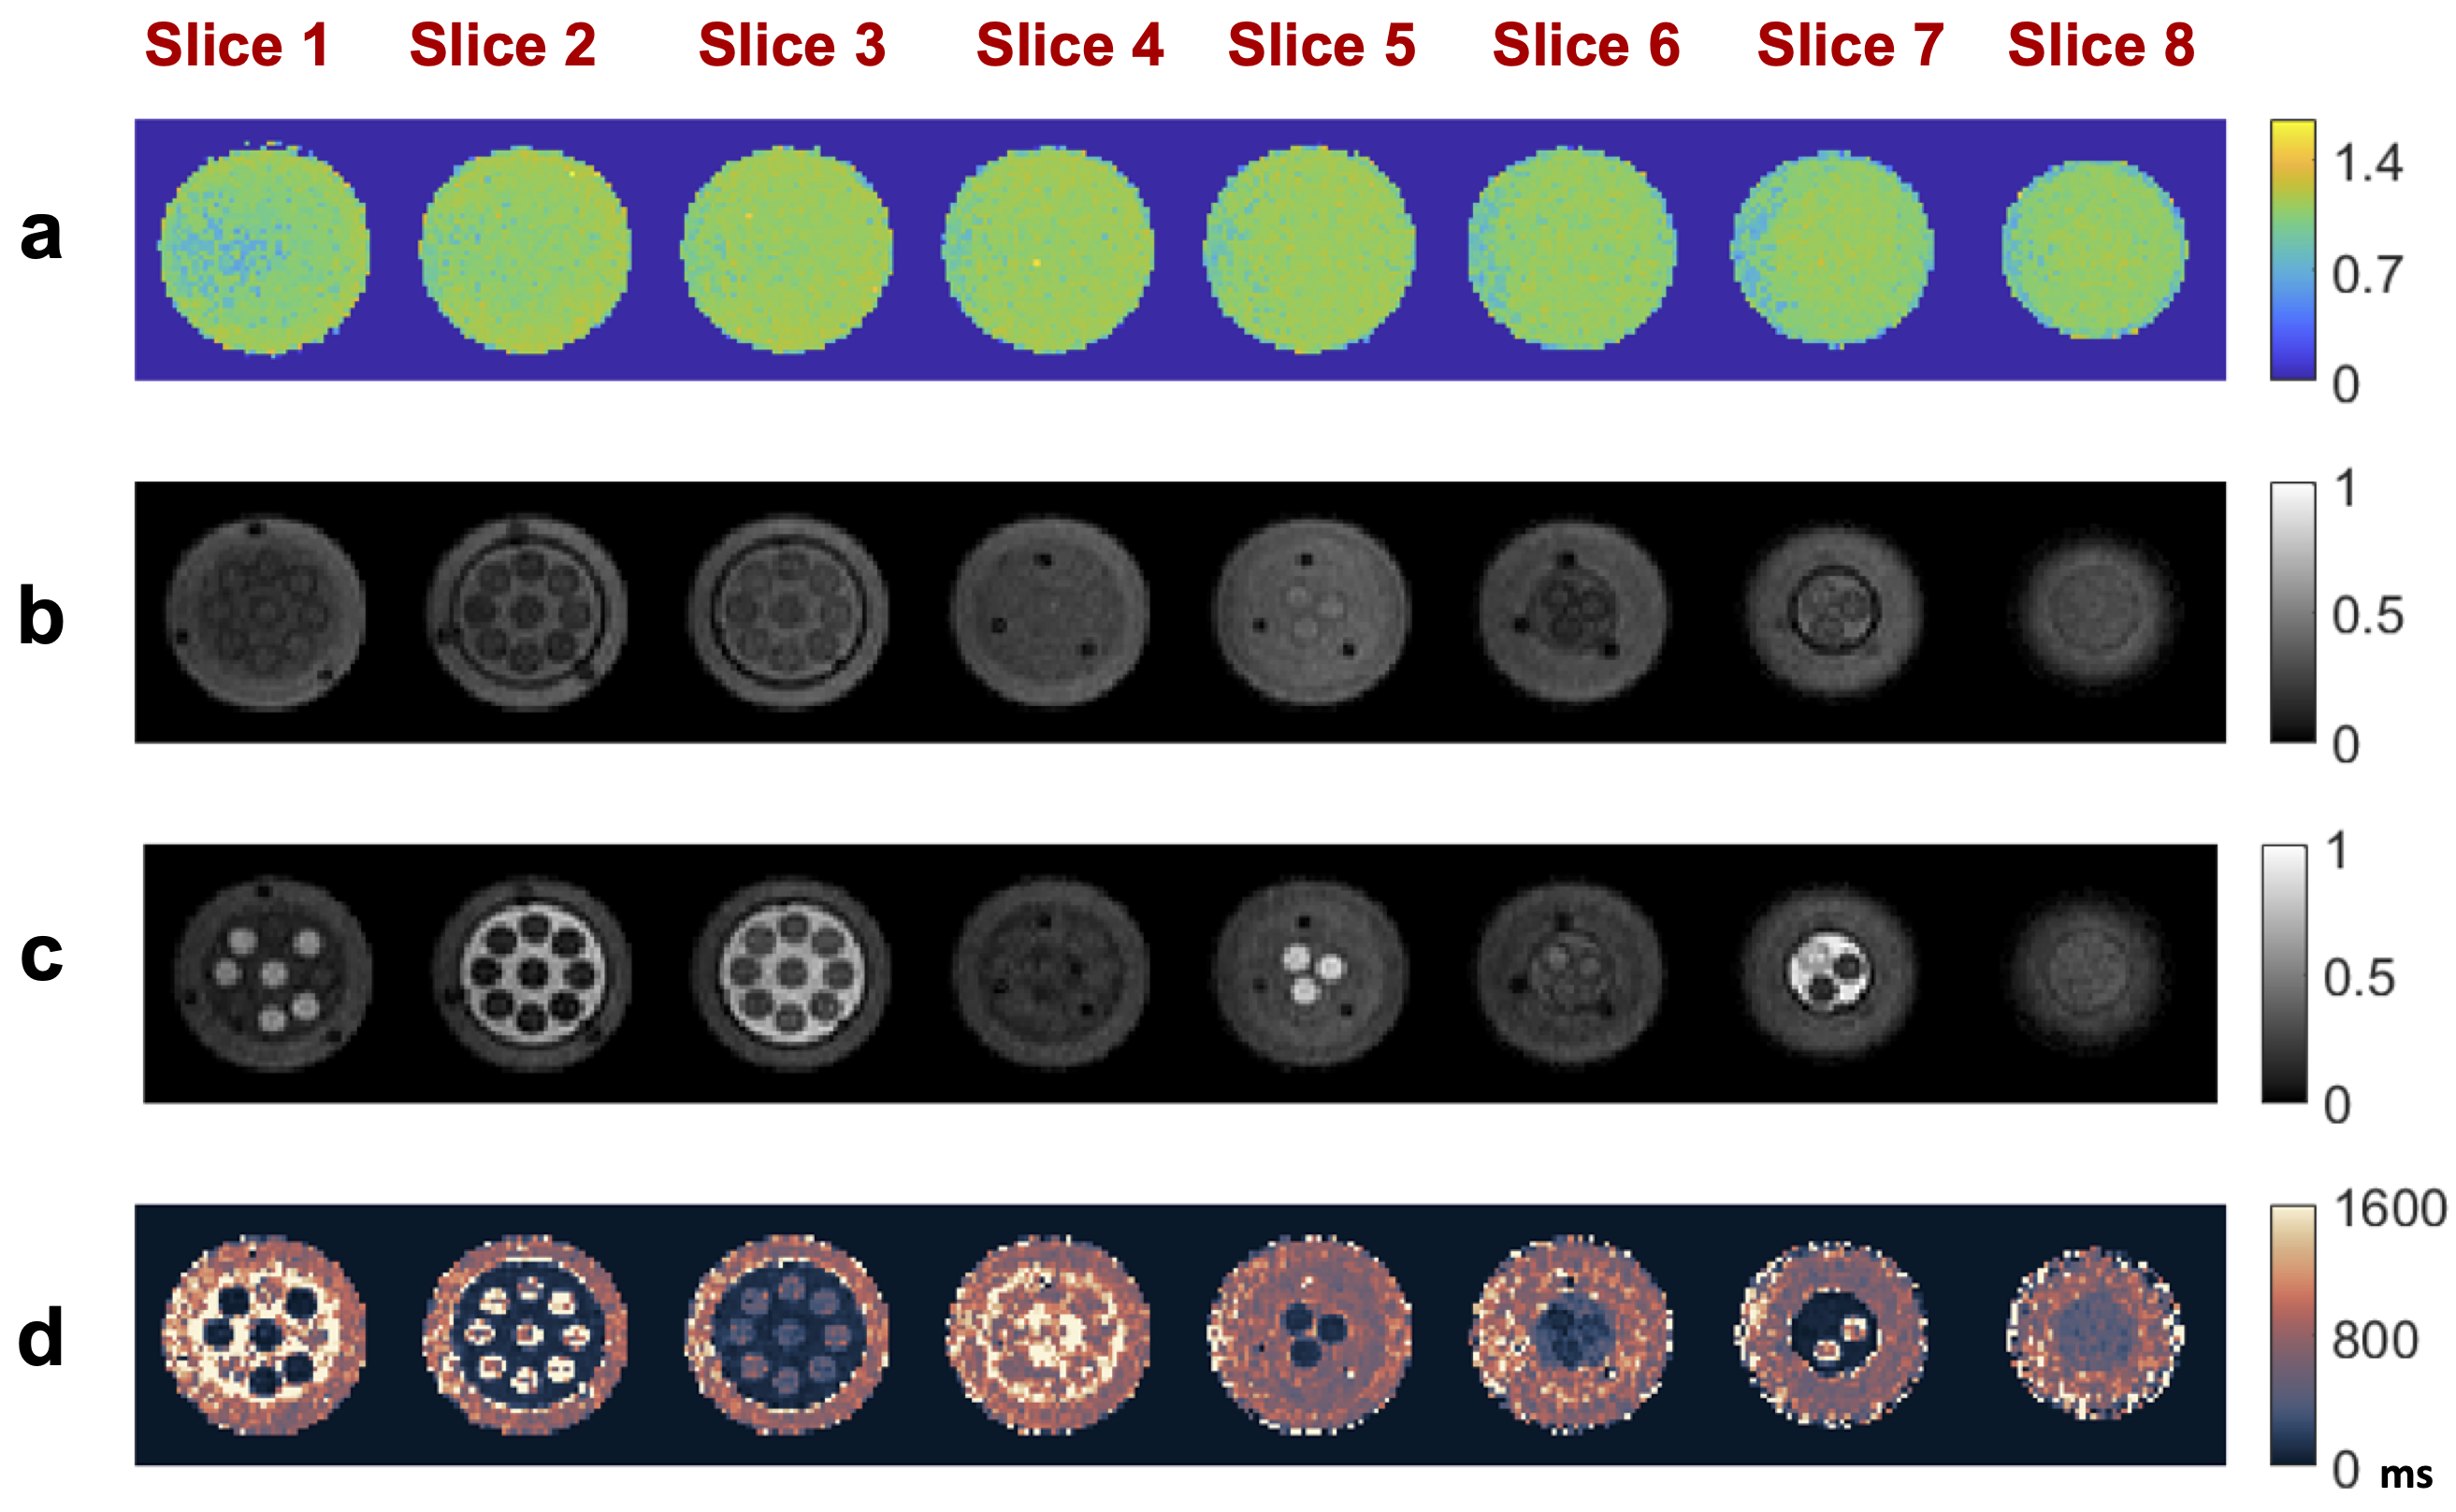
We quantified the T1 values distribution of each T1 map at 3 different CuSO4 concentrations (0.3 mg/ml, 0.6 mg/ml and 1.0 mg/ml) and compared them to the reference T1 for CuSO4 solutions (Fig. 2c-e). The average T1 map values deviate the reference measurement lower than 7%, as shown in Table 1. For T1 mapping where the same solutions were placed side-by-side (Fig. 2f), a proper delineation of all 3 concentrations was observed.The breast phantom experiments are displayed in Fig. 3 with B1 map, the 2 SPGR acquisitions and the computed T1 map. We observe at 6.5 mT the T1 distribution of different tissue-mimic samples including fibroglandular and fat tissue mimics.
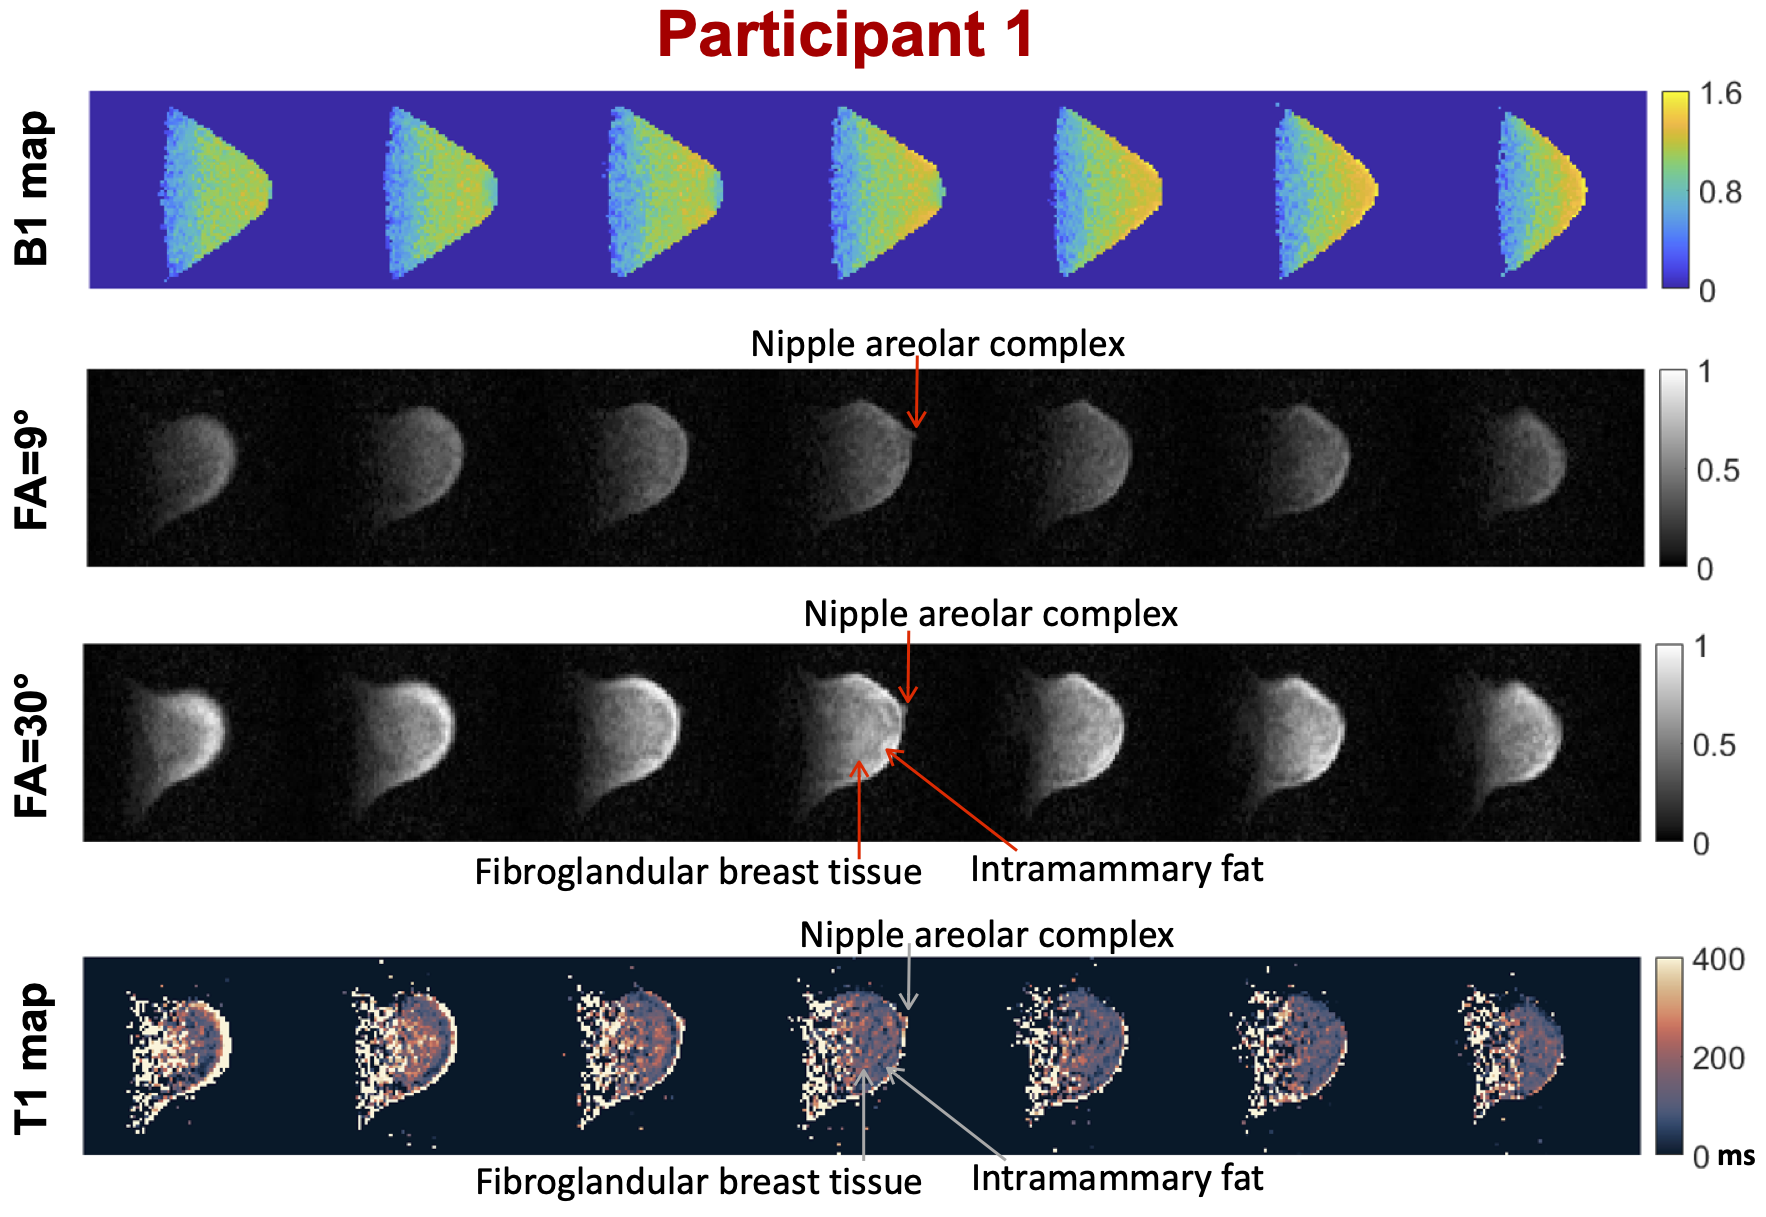
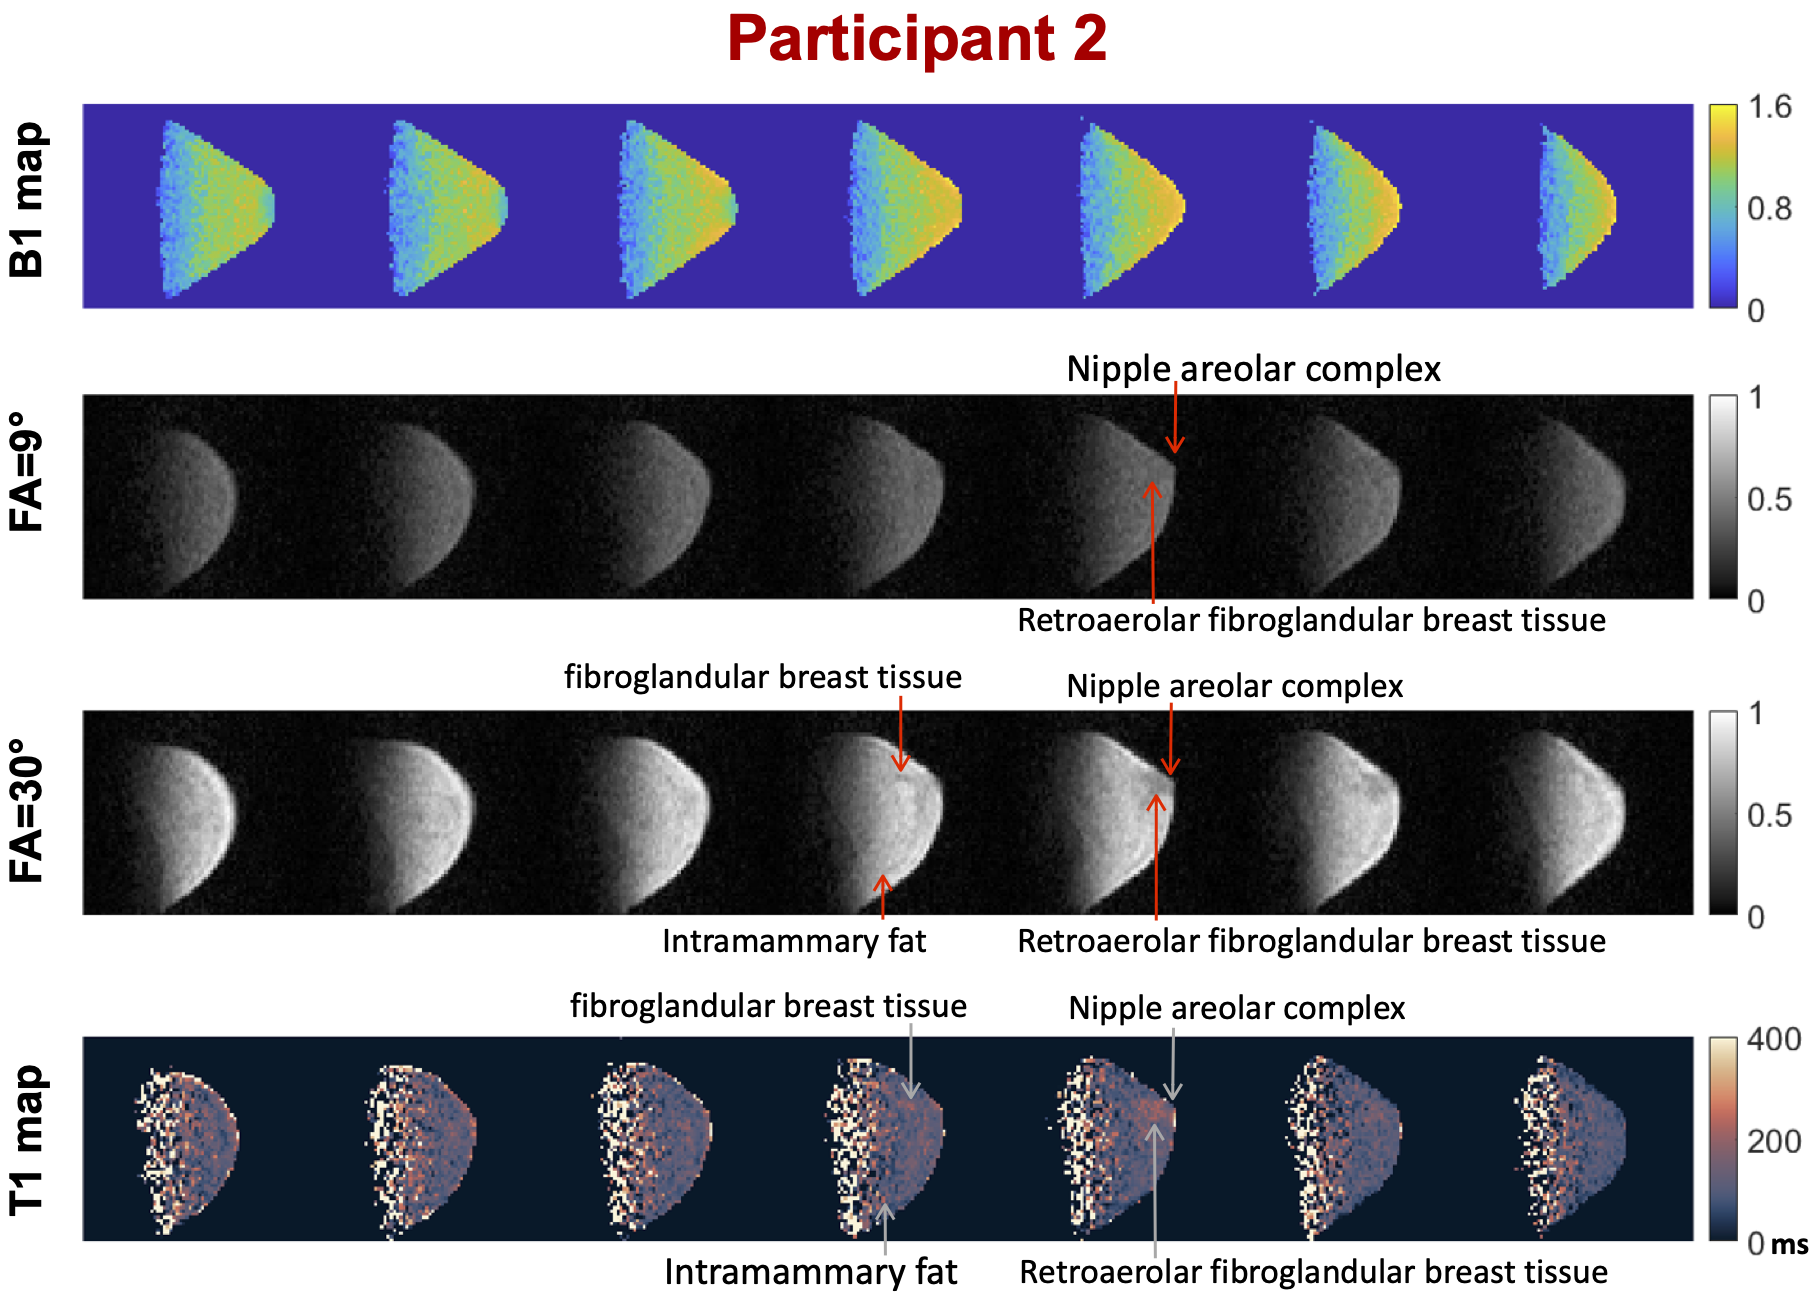
Finally, the breast imaging results of the two healthy participants are presented in Fig. 4 and 5. The computed T1 maps showed the T1 values of most breast tissues are lower than 100 ms, which is consistent with results reported by Bitonto et al1. Fibroglandular breast tissue, intramammary fat, retroareolar fibroglandular breast tissue and the nipple areolar complex are all visible in one participant, and 3 of the 4 tissues are visible in the other participant.
Discussion and Conclusion
This work presents a novel method for T1 mapping at ultra-low field. The impact of RF coil loading and the susceptibility of human body on the B1 map were negligible at ULF, enabling B1 mapping using a phantom prior to T1 mapping acquisitions, thus reducing scan time. Phantom imaging showed a high T1 accuracy in T1 map; however, the T1 variance was also high due to the low SNR. We present the first in vivo whole breast T1 maps at 6.5 mT, revealing the T1 value of human breast tissues.Acknowledgements
This work was supported in part by NIH 1R21CA267315 (PIs Keenan and Rosen). MSR acknowledges the generous support of the Kiyomi and Ed Baird MGH Research Scholar award. KEK and SEO were funded by NIST, and SEO would like to acknowledge support from the NIST-PREP (Professional Research Experience Program), performed under the following financial assistance award 70NANB18H006 from U.S. Department of Commerce, National Institute of Standards and Technology.
References
1. Bitonto V, Ruggiero MR, Pittaro A, Castellano I, Bussone R, Broche LM, Lurie DJ, Aime S, Baroni S, Geninatti Crich S. Low-Field NMR Relaxometry for Intraoperative Tumour Margin Assessment in Breast-Conserving Surgery. Cancers (Basel). 2021 Aug 17;13(16):4141. doi: 10.3390/cancers13164141. PMID: 34439294; PMCID: PMC8392401.
2. Masiewicz E, Ashcroft GP, Boddie D, Dundas SR, Kruk D, Broche LM. Towards applying NMR relaxometry as a diagnostic tool for bone and soft tissue sarcomas: a pilot study. Sci Rep. 2020 Aug 26;10(1):14207. doi: 10.1038/s41598-020-71067-x. PMID: 32848198; PMCID: PMC7449965.
3. Kimberly WT, Sorby-Adams AJ, Webb AG, Wu EX, Beekman R, Bowry R, Schiff SJ, de Havenon A, Shen FX, Sze G, Schaefer P, Iglesias JE, Rosen MS, Sheth KN. Brain imaging with portable low-field MRI. Nat Rev Bioeng. 2023.
4. Marques JP, Simonis FFJ, Webb AG. Low-field MRI: An MR physics perspective. J Magn Reson Imaging. 2019 Jun;49(6):1528-1542. doi: 10.1002/jmri.26637. Epub 2019 Jan 13. PMID: 30637943; PMCID: PMC6590434.
5. Stikov N, Boudreau M, Levesque IR, Tardif CL, Barral JK, Pike GB. On the accuracy of T1 mapping: Searching for common ground. Magnetic Resonance in Medicine. 2015;73(2):514–22.
6. Keenan, K.E., Wilmes, L.J., Aliu, S.O., Newitt, D.C., Jones, E.F., Boss, M.A., Stupic, K.F., Russek, S.E. and Hylton, N.M. (2016), Design of a breast phantom for quantitative MRI. J. Magn. Reson. Imaging, 44: 610-619. https://doi.org/10.1002/jmri.25214
Figures