2684
Evaluation of Concomitant Presence of Iron Overload and Hepatic Steatosis using Monte Carlo Simulations at 0.75 T1University of Memphis, Memphis, TN, United States, 2St. Jude Children’s Research Hospital, Memphis, TN, United States, 3North Shore University Hospital/Northwell Health, Manhasset, NY, United States, 4University of Tennessee Health Science Center, Memphis, TN, United States
Synopsis
Keywords: In Silico, Relaxometry, Low-Field MRI, Hepatic Steatosis and Iron Overload, HIC, Fat Fraction
Motivation: Multi-spectral fat water models fail to produce reliable fat fraction(FF) estimations for severe iron overload conditions at 1.5T and 3T. Low-field MRIs(<1T) may increase the accuracy in HIC and FF estimations at high iron overload by slowing signal decay but might suffer from lower signal-to-noise ratio(SNR).
Goal(s): Assess the accuracy and robustness of quantifying R2* and FF at 0.75T across various SNR conditions.
Approach: Realistic virtual liver models with concomitant presence of iron overload and hepatic steatosis were used to simulate MRI signals at 0.75T and 1.5T using Monte Carlo simulations.
Results: 0.75T showed improved FF and R2* estimation compared to 1.5T.
Impact: Low-field MRI can increase the accuracy and precision in simultaneous quantification of R2* and FF in the presence of mild-to-severe iron overload. With low-field MRI systems being less expensive and potentially increasing MRI accessibility, they can facilitate the reliable diagnosis.
Introduction
Iron overload is common in patients with chronic liver disease or receiving multiple blood transfusions, and is known to coexist with hepatic steatosis in patients with non-alcoholic fatty liver disease (NAFLD). Multi-spectral fat water models allow simultaneous and confounder-free estimation of R2* and fat fraction (FF).1,2 Although FF estimation is reliable in mild-to-moderate iron overload, it becomes impossible in severe iron overload at 1.5T and 3.0T because of rapid signal decay.2,3 However, at lower fields (<1T), signal decays more slowly with increasing hepatic iron content (HIC), thereby can extend the dynamic range of reliable HIC and FF estimations.4 However, the low-field MRI systems have lower signal-to-noise ratio (SNR) which may reduce precision in R2* and FF estimations.4 The purpose of this study is to assess the accuracy and robustness of R2* and FF estimation at 0.75T across different SNRs using Monte Carlo simulations to determine its feasibility for clinical use.Methods
Combined virtual hepatic iron overload and steatosis models were generated for different FFs and HICs based on published studies and morphometric analysis on histology samples.5,6 MRI signal was generated using the Monte-Carlo approach described in previous studies,5,7 by accounting for both iron-induced and fat-induced susceptibilities as well as phase differences in water and fat protons. The MRI signals from water and fat were computed and superimposed to obtain the total combined MRI signal. The signals were synthesized for FFs ranging from 0-30% and for HICs 1-20 mg of iron/g of dry tissue weight with echo times (TE) = (1-14.5)ms and ∆TE=0.5ms at both 0.75T and 1.5T for signals without noise (SNRideal) and with noise (SNR=50, 25).Fat water toolbox (FWT) was used to calculate R2* and FF.8 FFs were grouped as (1-10)%, (10-20)% and (20-30)% and HICs were grouped as mild(3-7mg Fe/g), moderate(7-15mg Fe/g) and severe (>15mg Fe/g) iron overload.10 R2*-HIC relationship was computed and the biases (absolute(True-Estimated)) in HIC and FF estimations at 0.75T and 1.5T were computed and compared. One-way ANOVA was used for testing for statistical significance with p<0.05 being statistically significant.
Results & Discussion
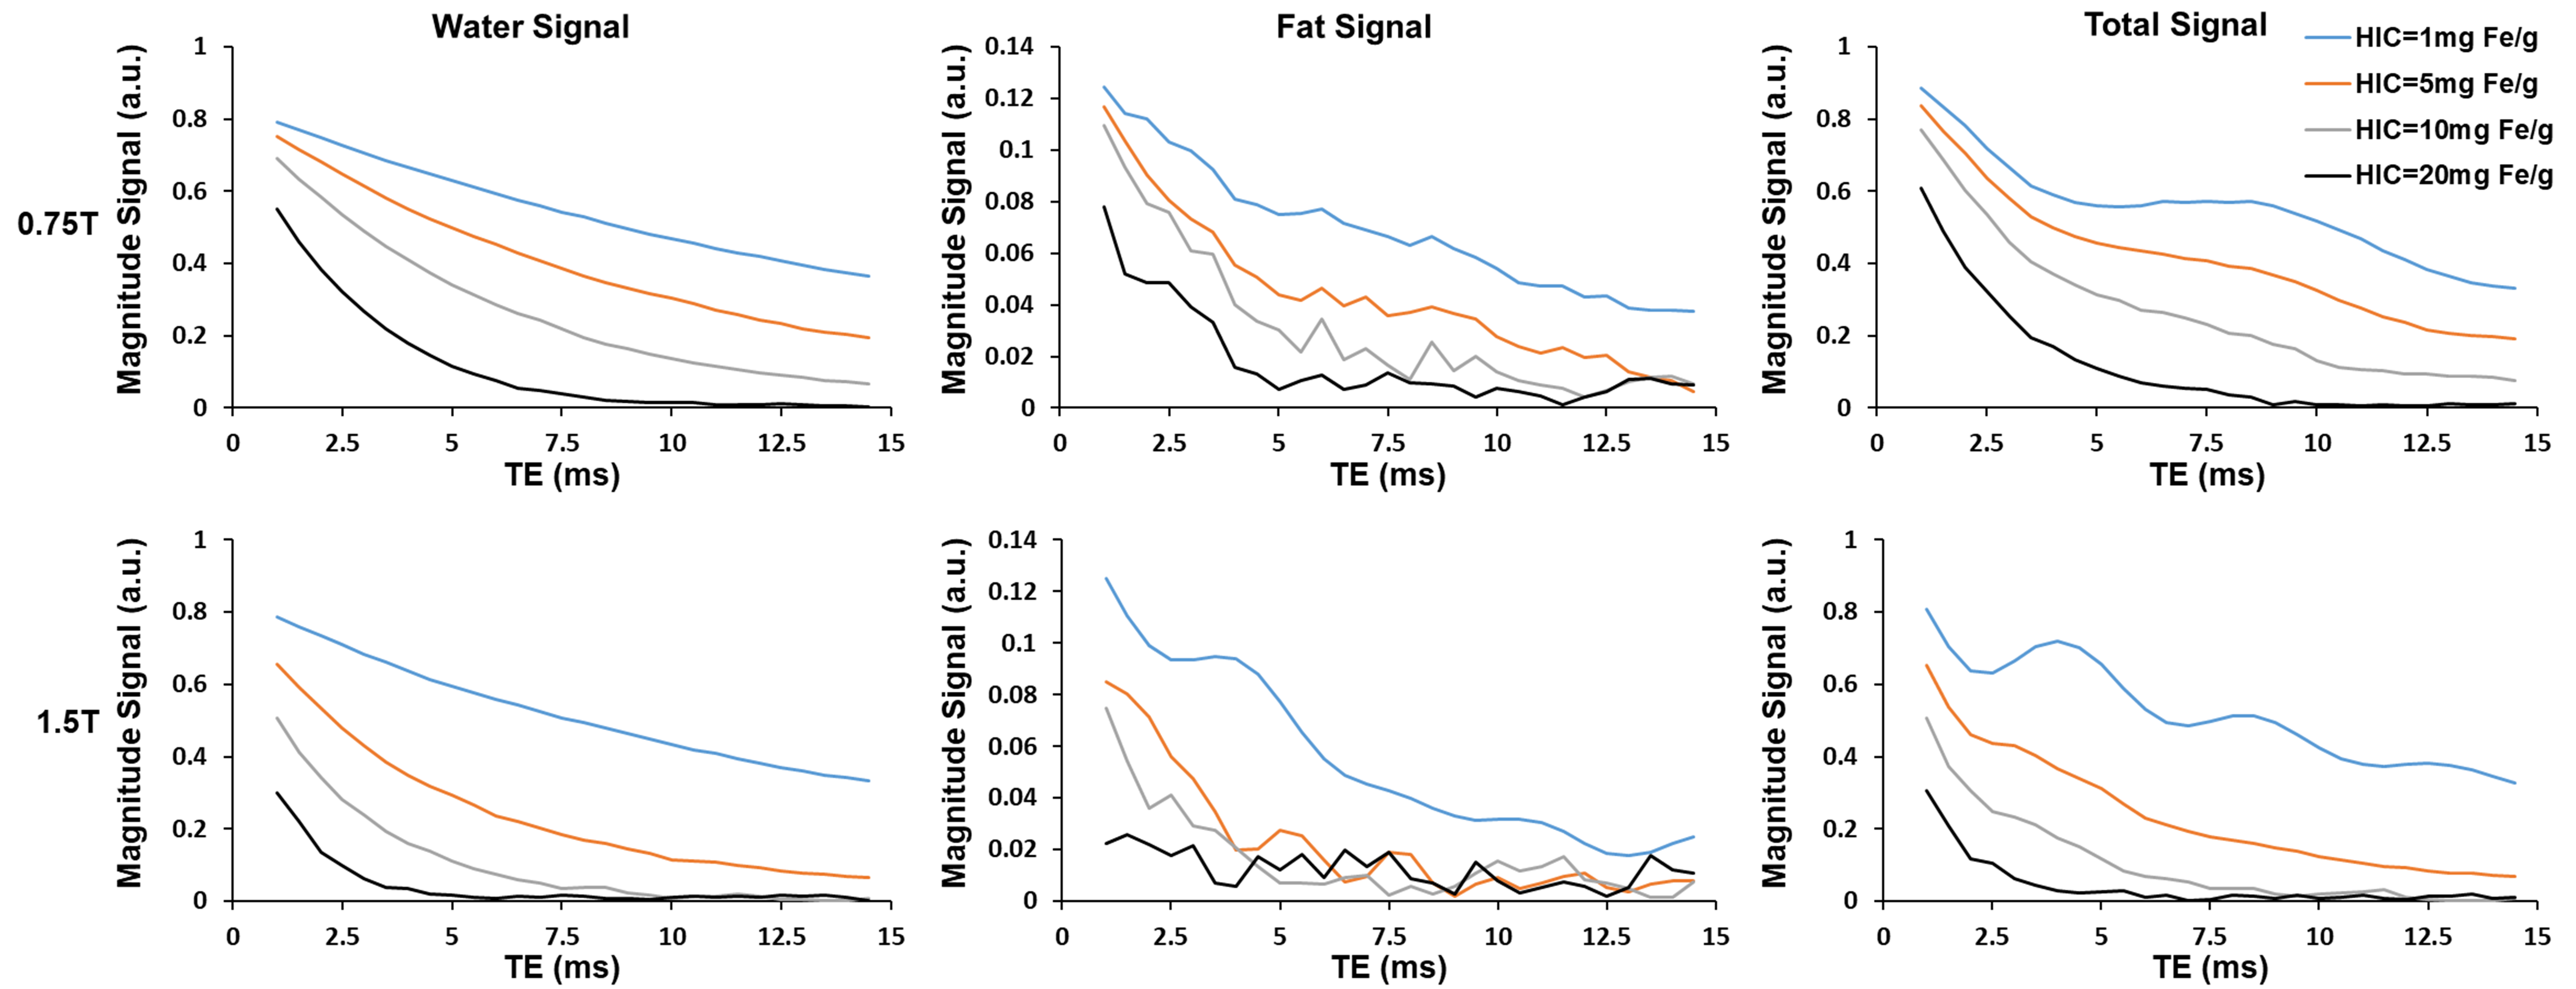
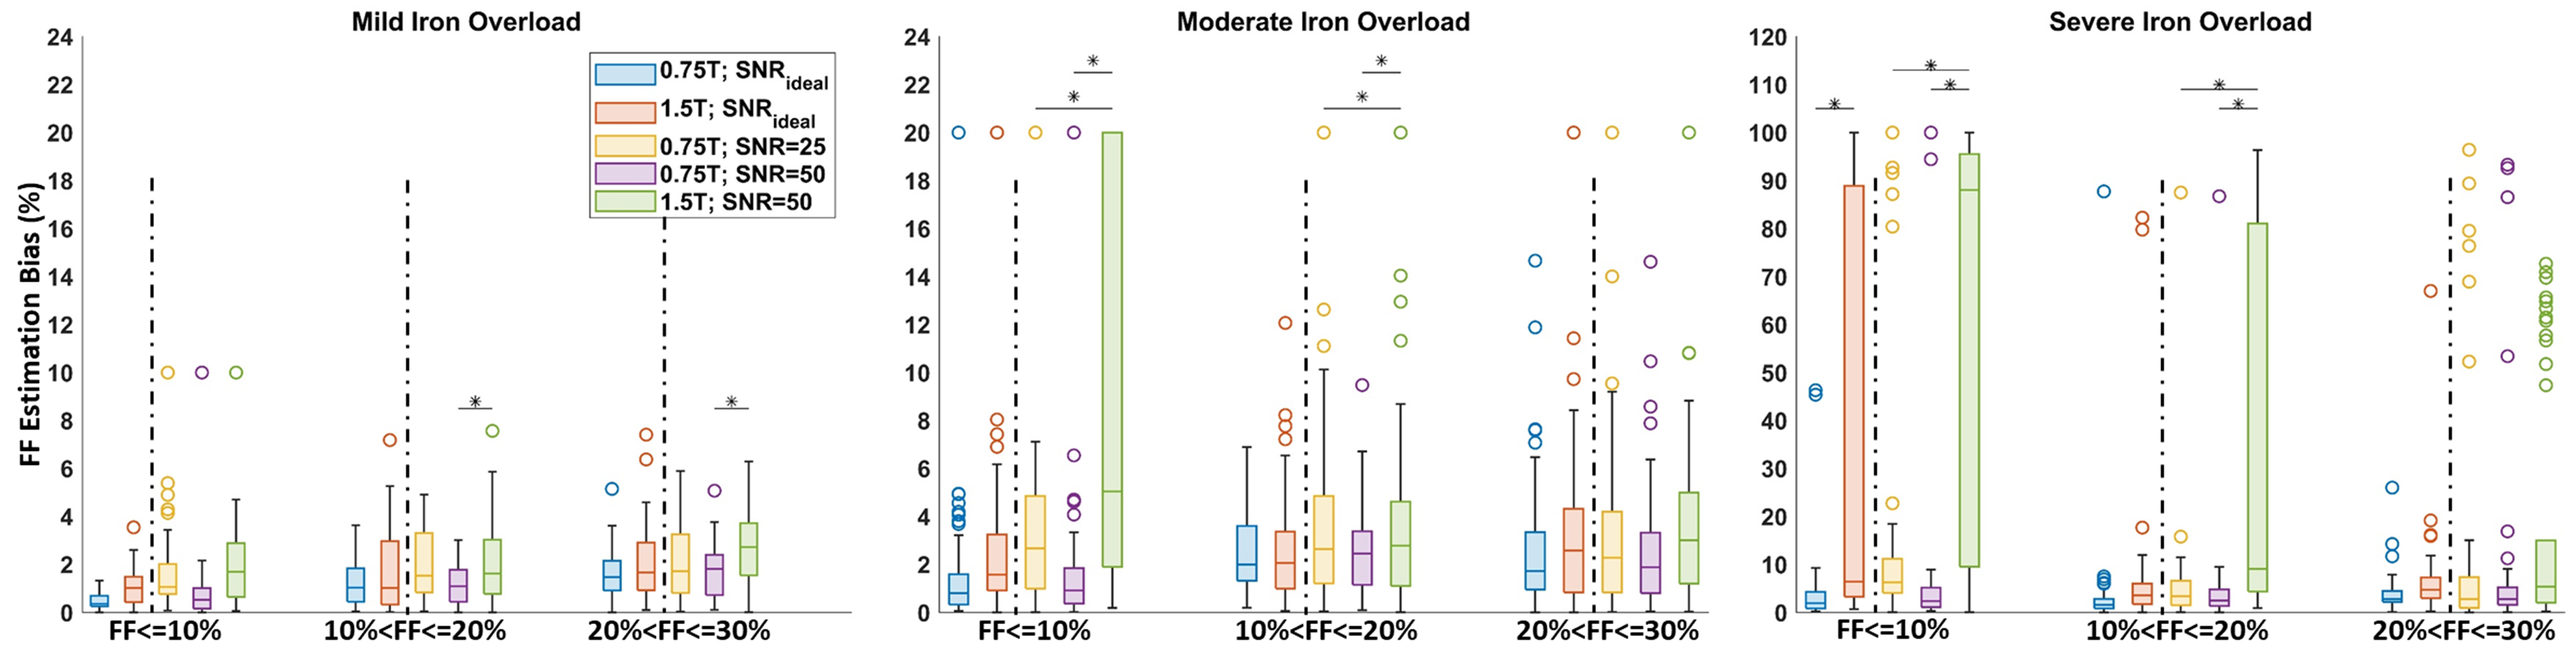
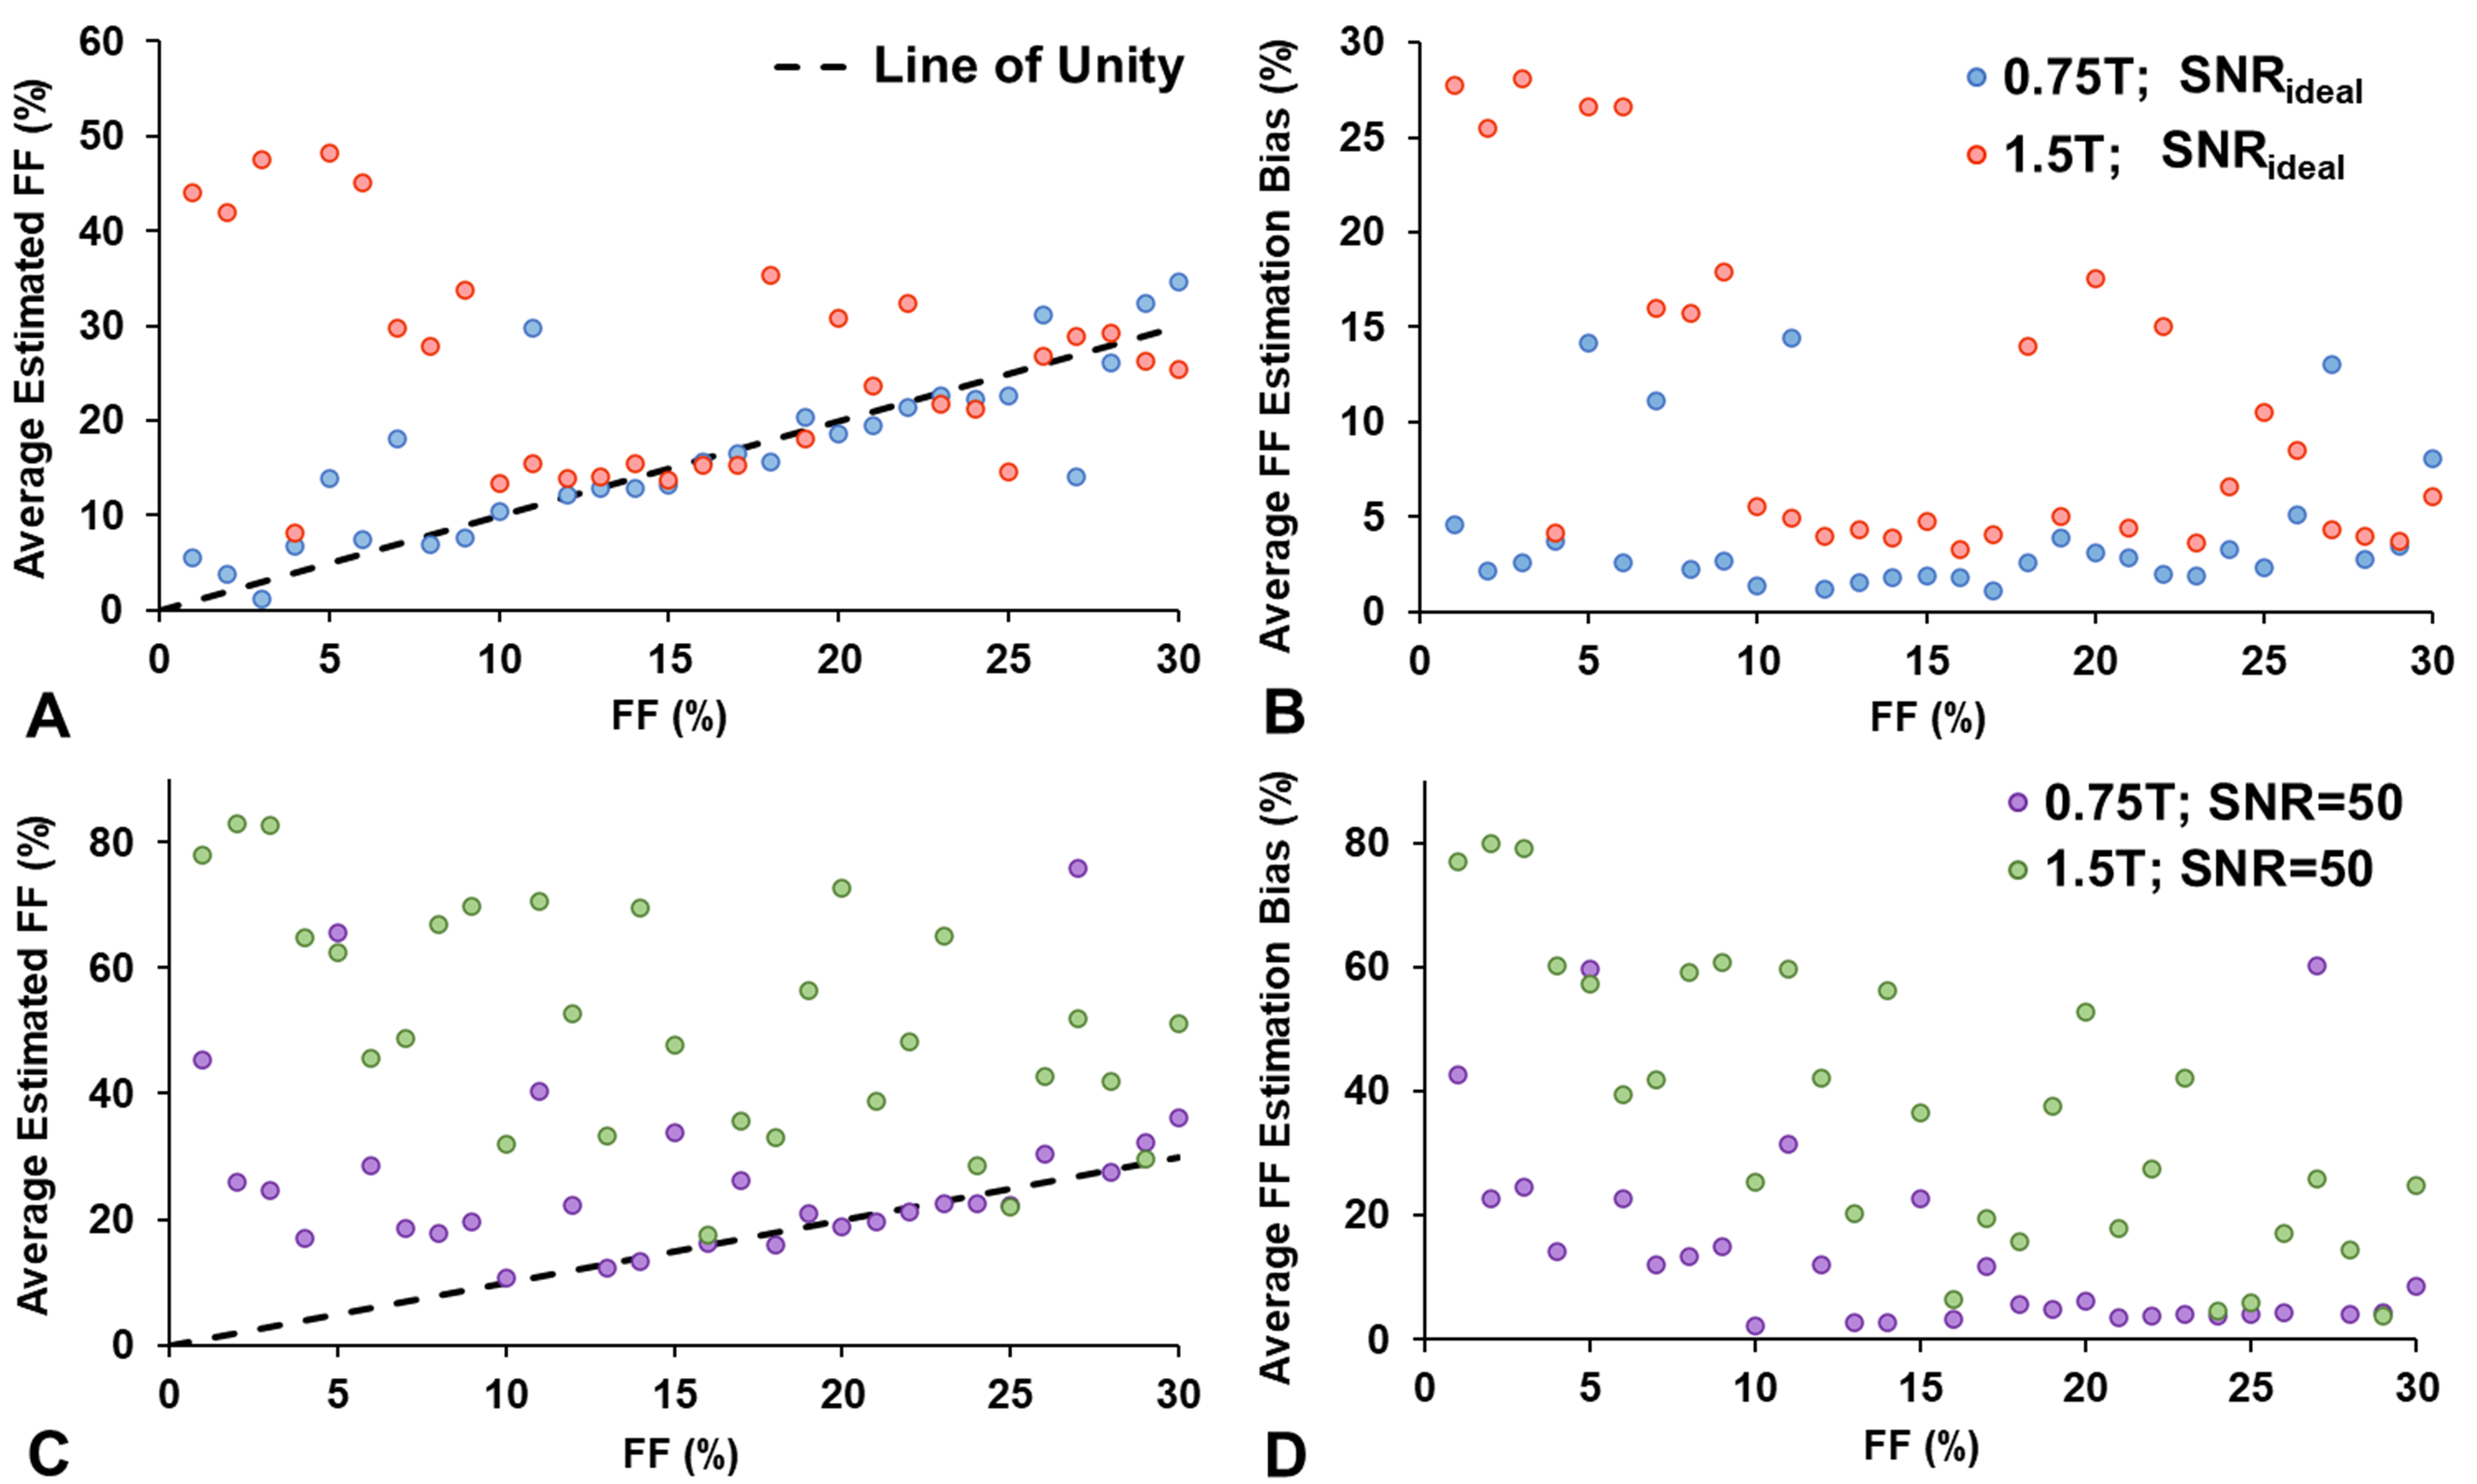
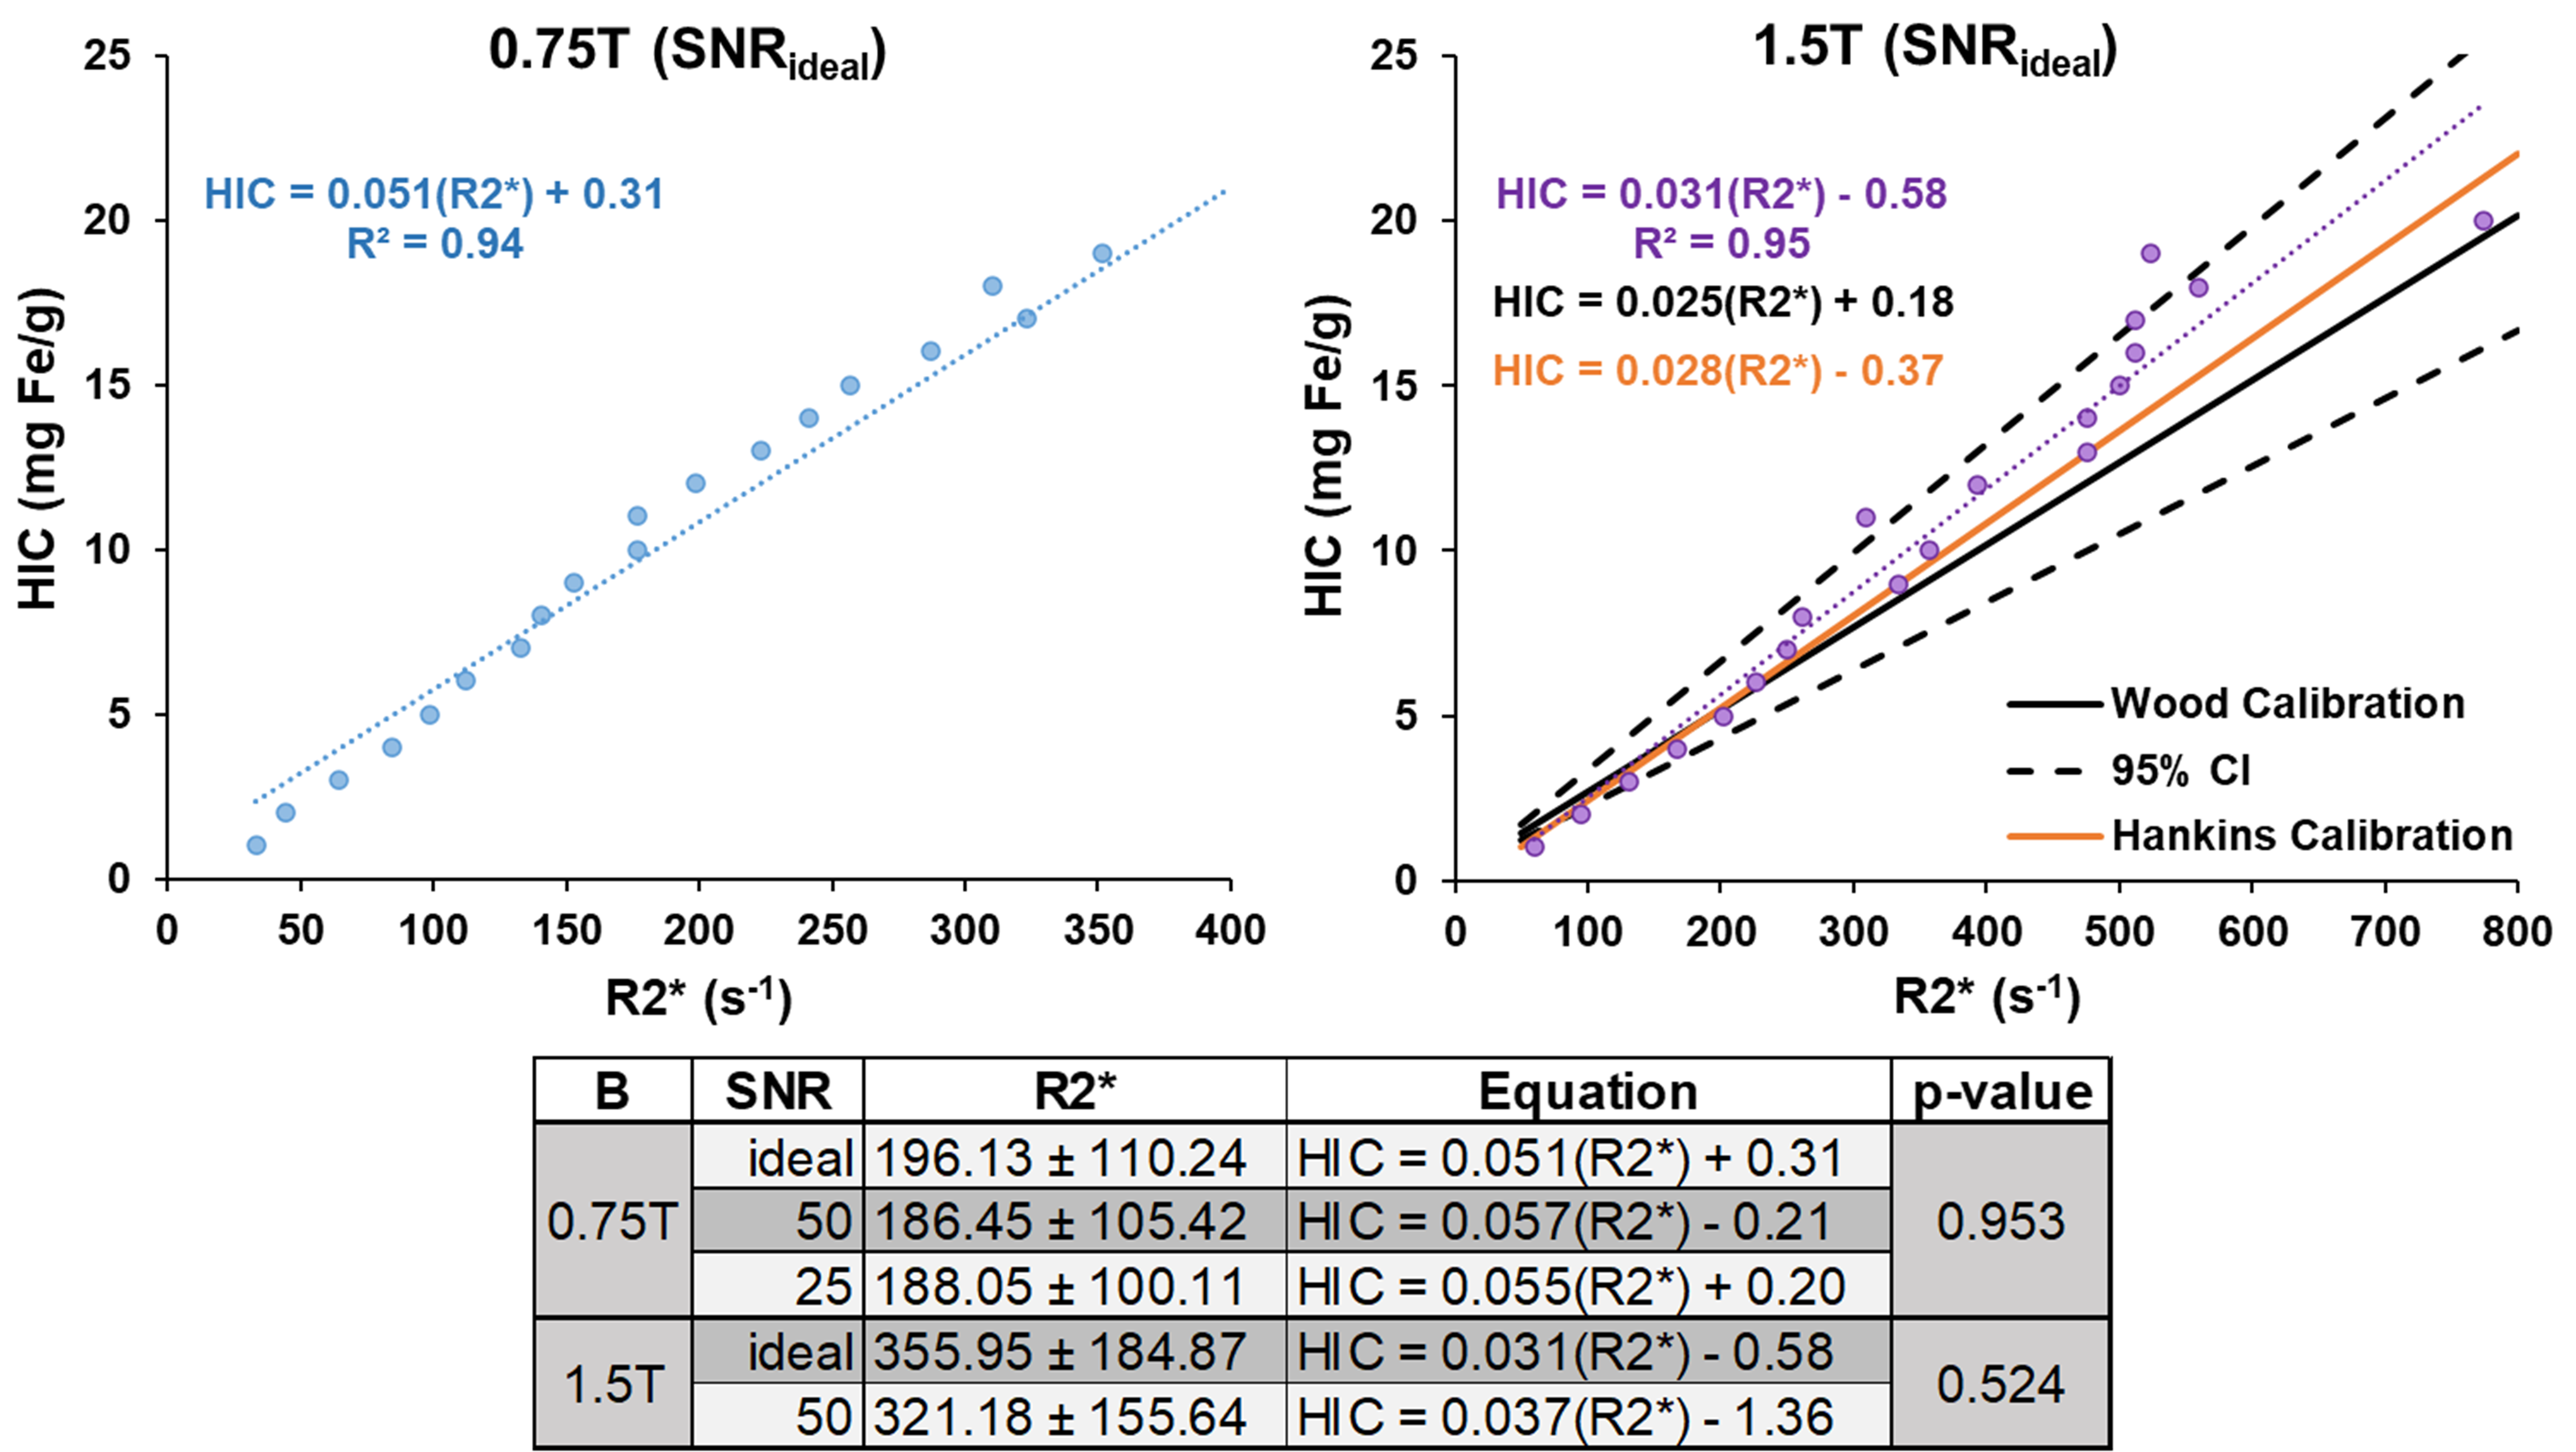
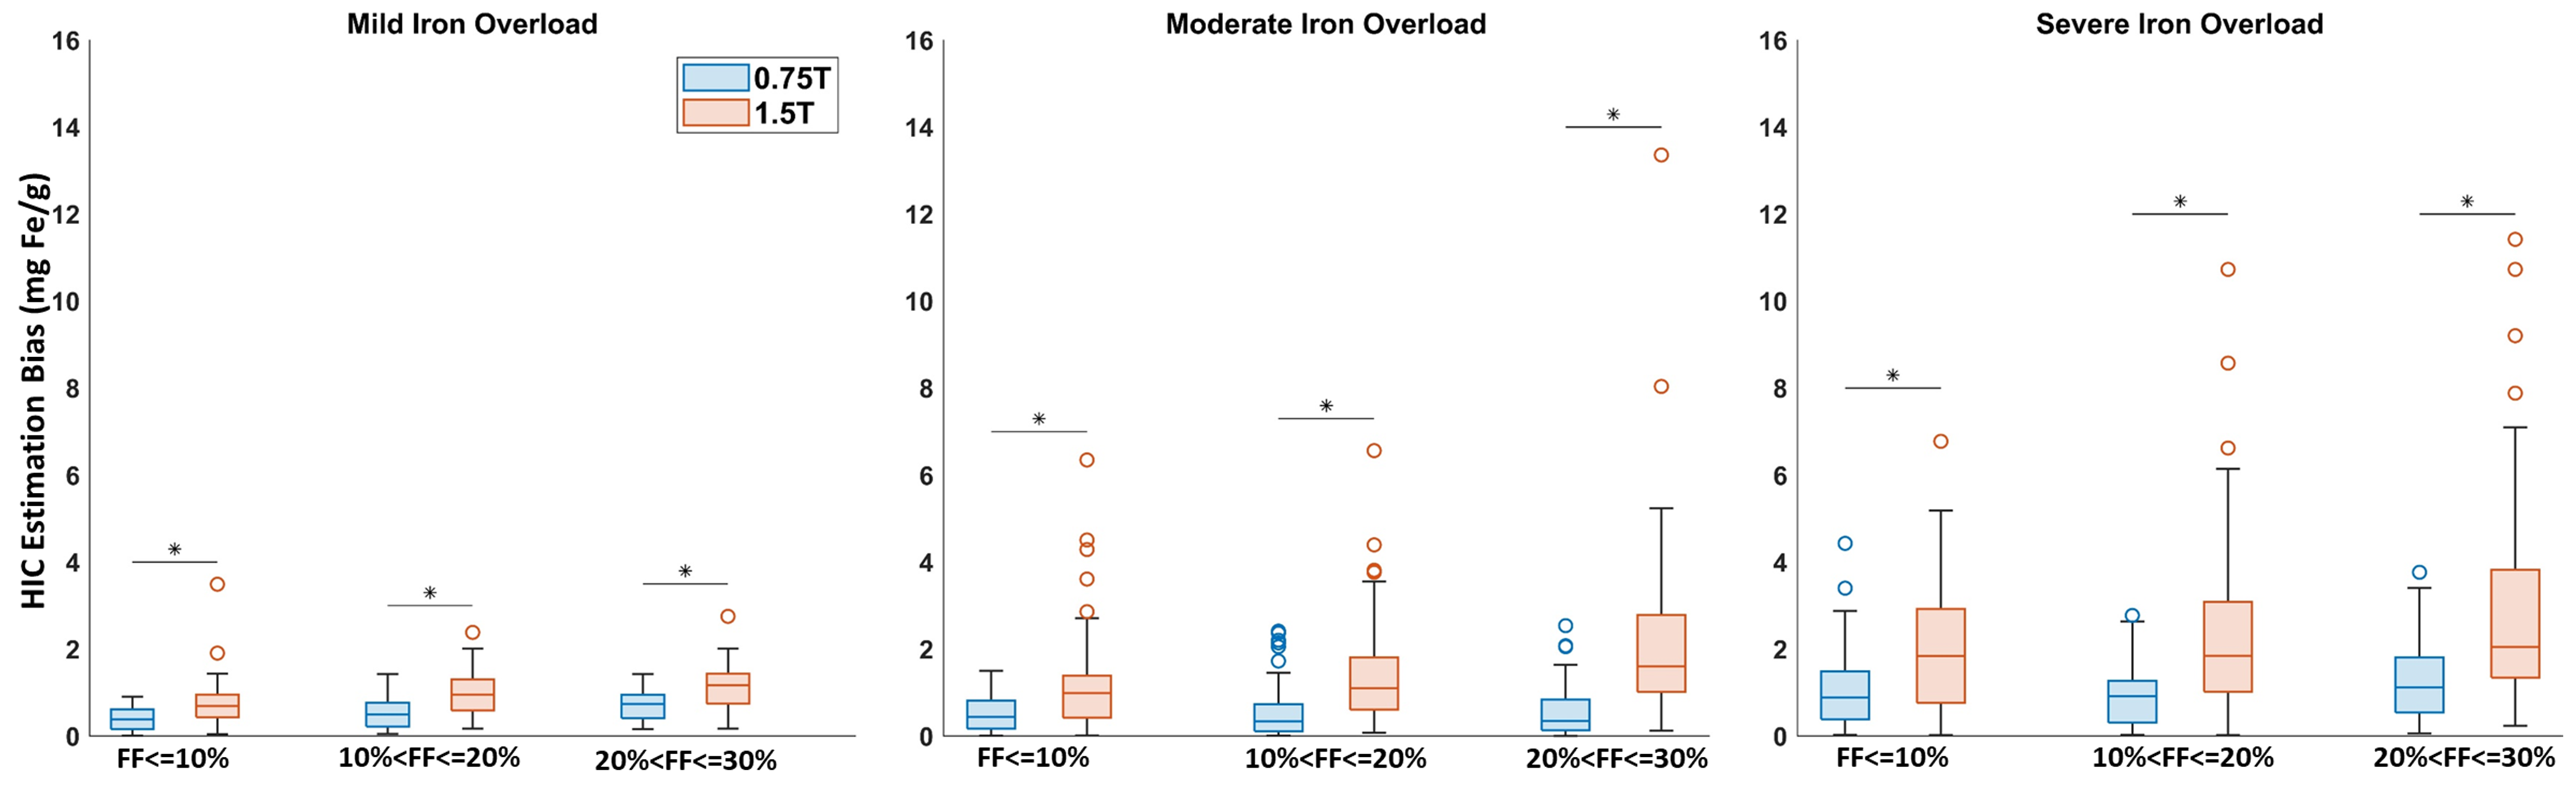
Figure 1 shows the MRI signal at 0.75T and 1.5T for FF=15% and HIC= 1, 5, 10, 20 mg Fe/g. Figure 2 shows that FF estimation bias for 0.75T is lower than 1.5T. For SNR=25, statistically significant improvement was observed at 0.75T for moderate and severe iron overload for FF<=20%. When SNR at 0.75T was increased to match that of 1.5T (SNR=50), 0.75T showed additional statistically significant improvement in FF estimation for FF>10% at mild iron overload. For SNRideal, 0.75T showed improved FF estimation with statistical significance for severe iron overload and FF<=10%. Figure 3 shows that for severe iron overload, FF bias is higher for FF<10%. 1.5T and 0.75T with SNR=50 has FF bias of 37.01±22.98% and 8.02±20.67%, respectively. However, for FF>=10%, the bias reduces to 6.76±16.96% at 0.75T compared to 26.44±16.90 at 1.5T. Also at SNRideal, the bias for FF>=10% is 4.17±3.88% and 10.88±8.64% for 0.75T and 1.5T, respectively. Figure 4 demonstrates that R2*-HIC relationship at 1.5T falls within the 95% confidence interval of the Wood calibration11 and slope of R2*-HIC at 0.75T is almost double the slope of the Wood calibration, as expected. Also, no statistically significant difference in slope was observed based on SNR for both 0.75T and 1.5T. Hence, R2*-HIC relationship for SNR=50 was used for HIC estimation. Figure 5 demonstrates that 0.75T shows statistically significant improvement for the HIC estimation.Hence, our simulation data shows that at 0.75T, FF and HIC estimation is improved with higher SNR decreasing the bias for FF estimation. For severe iron overload, 0.75T demonstrated strong improvement in FF estimation. Hence, future studies should focus on investigating the low field MRI with deep learning or other technique based SNR enhancement for FF estimation in the presence iron overload.12,13 Further, similar analysis with another widely used low field MRI of 0.55T and higher HIC needs to be done. Nevertheless, our study demonstrated the feasibility of analyzing low field MRI signals computationally for coexisting pathologies using Monte Carlo simulations and showed the potential of low-field MRI for improved R2* and FF estimation in presence of moderate to severe iron overload.
Conclusion
This study shows that for concomitant presence of hepatic steatosis and iron overload, accurate FF estimation depends on SNR and with SNR enhancement 0.75T improves the FF estimation, especially for severe iron overload. Further, HIC estimation is not affected by SNR and 0.75T shows improved performance for mild-to-severe iron overload.Acknowledgements
Research reported in this publication was supported by the National Institute of Biomedical Imaging and Bioengineering of the National Institutes of Health under Award Number R21EB031298.References
1. Henninger B, Plaikner M, Zoller H, et al. Performance of different Dixon-based methods for MR liver iron assessment in comparison to a biopsy-validated R2* relaxometry method. European Radiology. 2021;31:2252-2262.
2. Hernando D, Cook RJ, Qazi N, Longhurst CA, Diamond CA, Reeder SB. Complex confounder-corrected R2* mapping for liver iron quantification with MRI. European radiology. 2021;31:264-275.
3. Colgan TJ, Zhao R, Roberts NT, Hernando D, Reeder SB. Limits of fat quantification in the presence of iron overload. Journal of Magnetic Resonance Imaging. 2021;54(4):1166-1174.
4. Campbell‐Washburn AE, Mancini C, Conrey A, et al. Evaluation of Hepatic Iron Overload Using a Contemporary 0. 55 T MRI System. Journal of Magnetic Resonance Imaging. 2022;55(6):1855-1863.
5. Ghugre NR, Wood JC. Relaxivity‐iron calibration in hepatic iron overload: probing underlying biophysical mechanisms using a Monte Carlo model. Magnetic resonance in medicine. 2011;65(3):837-847.
6. Satapathy SK, Tran QT, Kovalic AJ, et al. Clinical and genetic risk factors of recurrent nonalcoholic fatty liver disease after liver transplantation. Clinical and translational gastroenterology. 2021;12(2).
7. Shrestha U, van der Merwe M, Kumar N, et al. Morphological characterization of hepatic steatosis and Monte Carlo modeling of MRI signal for accurate quantification of fat fraction and relaxivity. NMR in Biomedicine. 2021;34(6):e4489.
8. Hu HH, Börnert P, Hernando D, et al. ISMRM workshop on fat–water separation: insights, applications and progress in MRI. Magnetic resonance in medicine. 2012;68(2):378-388.
9. Brunt EM, Kleiner DE, Wilson LA, Belt P, Neuschwander‐Tetri BA, Network NCR. Nonalcoholic fatty liver disease (NAFLD) activity score and the histopathologic diagnosis in NAFLD: distinct clinicopathologic meanings. Hepatology. 2011;53(3):810-820.
10. St. Pierre TG, Clark PR, Chua-anusorn W, et al. Noninvasive measurement and imaging of liver iron concentrations using proton magnetic resonance. Blood. 2005;105(2):855-861.
11. Wood JC, Enriquez C, Ghugre N, et al. MRI R2 and R2* mapping accurately estimates hepatic iron concentration in transfusion-dependent thalassemia and sickle cell disease patients. Blood. 2005;106(4):1460-1465.
12. Chen Z, Pawar K, Ekanayake M, Pain C, Zhong S, Egan GF. Deep learning for image enhancement and correction in magnetic resonance imaging—state-of-the-art and challenges. Journal of Digital Imaging. 2023;36(1):204-230.
13. Rudie JD, Gleason T, Barkovich MJ, et al. Clinical assessment of deep learning–based super-resolution for 3D volumetric brain MRI. Radiology: Artificial Intelligence. 2022;4(2):e210059.
Figures