2683
T2* Relaxation Time Measurements of Various Brain Regions at 0.5 T1Medical Biophysics, Western University, London, ON, Canada, 2Synaptive Medical, Toronto, ON, Canada, 3Western University, London, ON, Canada
Synopsis
Keywords: Low-Field MRI, Low-Field MRI, T2*,subcortical brain,SNR
Motivation: Accurate knowledge of T2* relaxation times is important for optimizing contrast and SNR in multi-echo gradient echo sequences.
Goal(s): To measure the nominal T2* relaxation parameter at 0.5 T over subregions in the brain.
Approach: A 2 mm isotropic 3D multi-echo GRE sequence was acquired in 5 healthy volunteers. T2* estimates were computed over regions of interest using a mono-exponential fit.
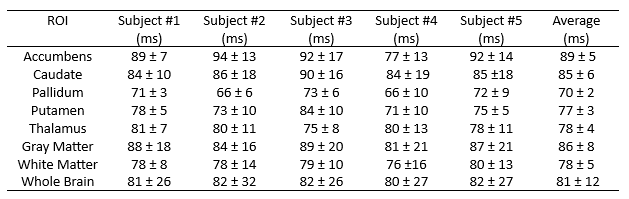
Results: T2* estimates of gray (86±8 ms) and white (78±5 ms) matter are in good agreement with previously published measurements in the mid-field. In the deep brain, average T2* values ranged between 70±2 ms to 89±5 ms.
Impact: For optimal T2* contrast in the brain at 0.5 T, echoes from multi-echo acquisitions should extend beyond 60 ms. For optimal SNR, echoes should be combined with a target T2* of ~80 ms.
INTRODUCTION
The recent renaissance in mid-field imaging with high-performance system components merits re-optimization of many pulse sequences. Accurate knowledge of T2* relaxation times in brain tissue is important for optimizing contrast in gradient echo sequences. In particular, for creating phase SNR optimal echo combination weighting coefficients for susceptibility weighted imaging (SWI) [1]. However, reported values of T2* in tissue at 0.5 T are sparse. In this work, we characterize the T2* relaxation parameter of common subgroups of the normal human brain at 0.5 T.METHOD
All imaging protocols were performed on a head-only 0.5 T MR scanner equipped with a high-performance gradient system and 16-channel head coil (Synaptive Medical, Toronto, ON, Canada). Imaging was performed on five healthy volunteers (male, age = 38 ± 8) with informed consent in compliance with health and safety protocols.Segmentation of 3D T1-Weighted Imaging
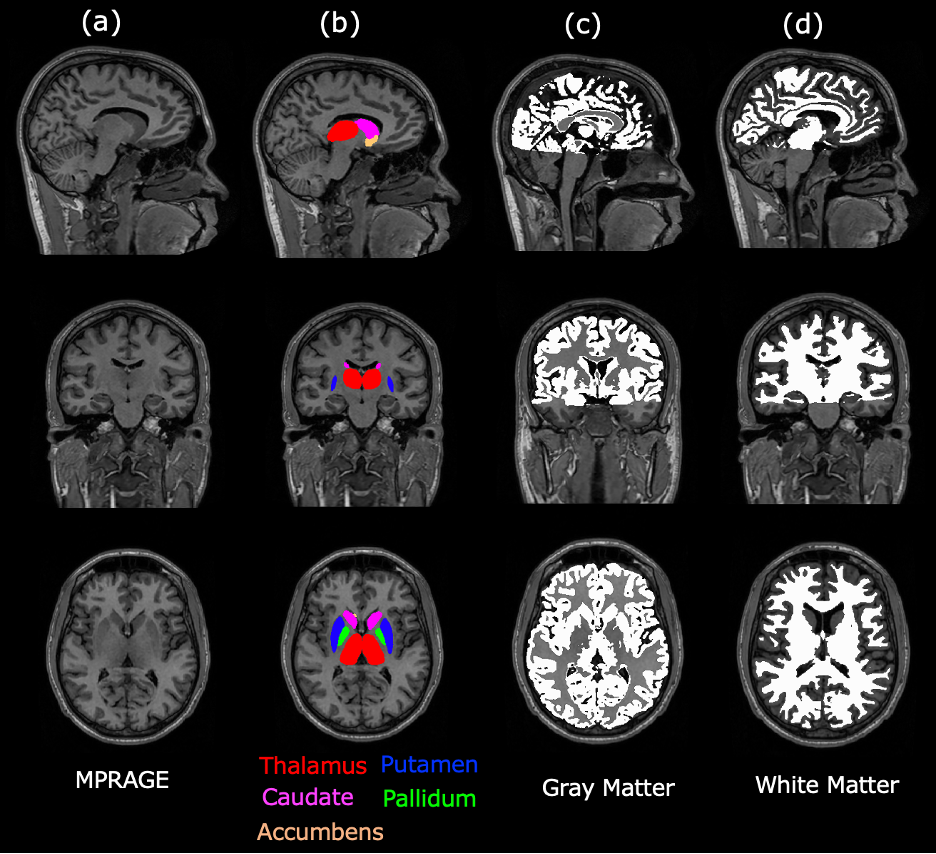
Structural images were acquired at 1.1 mm isotropic resolution using a T1-weighted MPRAGE sequence with field of view (FOV) = 236 mm × 236 mm × 180 mm, zipped to a matrix size = 512 × 512 × 320, flip angle (FA) = 9◦, TE = 5 ms, and TR = 11.2 ms. Region of interest (ROI) masks were created for various brain regions using FMRIB’s Automated Segmentation Tool (FAST) and Integrated Registration and Segmentation Tool (FIRST) [2,3].
T2* Mapping of Segmented Regions
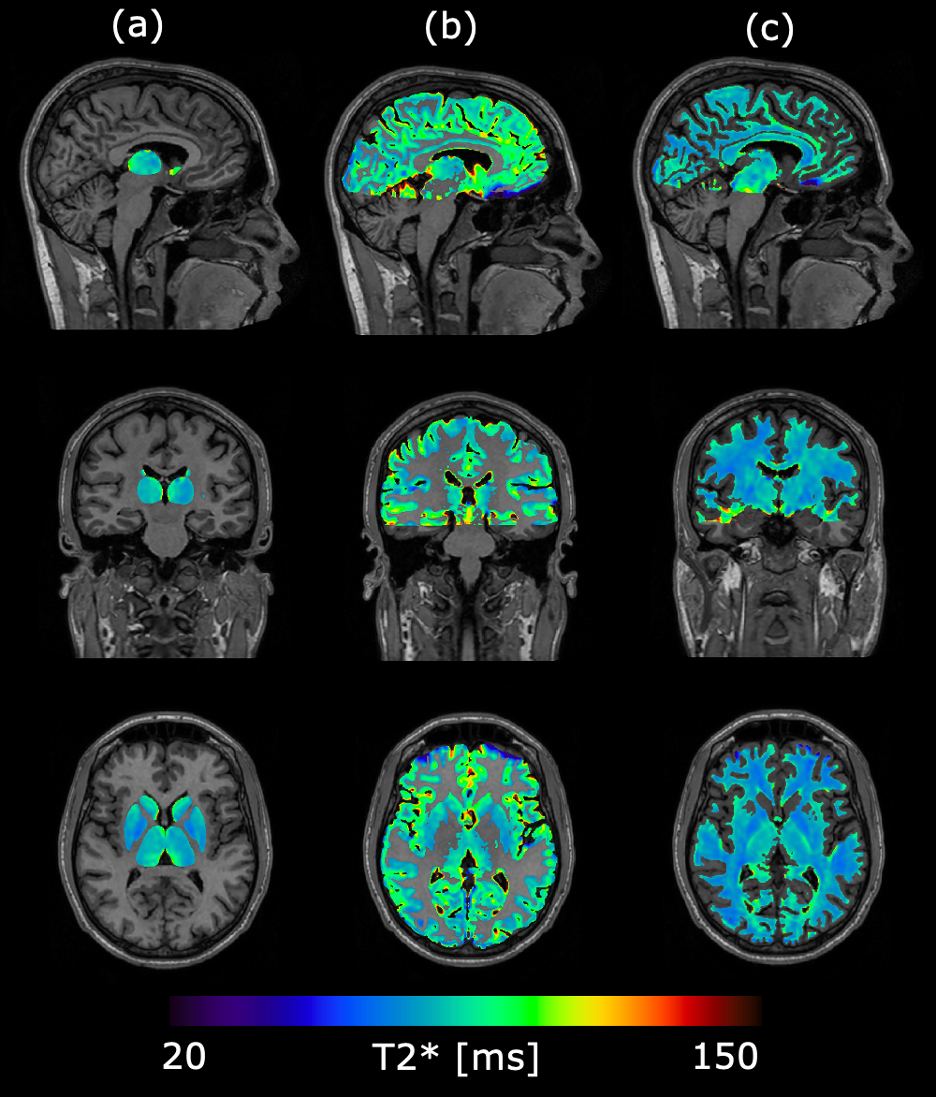
A 2 mm isotropic resolution 3D multi-echo GRE (meGRE) sequence was used with FOV = 240 mm × 240 mm × 120 mm, matrix size = 120 × 120 × 60, FA = 32◦ , TE (1) = 5 ms, echo spacing = 3.4 ms, echo train length (ETL) = 26, and TR = 97.25 ms. The 3D meGRE images were registered to the structural image using FMRIB’s Linear Image Registration Tool (FLIRT) [4,5]. Voxel-wise estimates of T2* were computed over the ROIs by fitting the data to a mono-exponential decay model [6].
RESULTS
An exemplary structural image showing locations of the ROI masks is shown in figure 1. Figure 2 displays the respective T2* map for this volunteer over the masked ROIs. Individual and aggregate T2* values over notable brain regions are reported in Table 1.DISCUSSION AND CONCLUSION
The T2* relaxation parameter was measured at 2 mm isotropic resolution in the brain of five healthy volunteers at 0.5T. The measurements of gray (86 ± 8 ms) and white (78 ± 5 ms) matter are in good agreement with recent measurements for gray (86 ± 9 ms) and white (72 ± 12 ms) matter performed at 0.55 T [7]. To our knowledge, estimates of T2* in the subcortical brain at 0.5T have not been reported elsewhere in the literature.In the deep brain, average T2* values across subjects ranged between 70 ± 2 ms and 89 ± 5 ms. Therefore, for optimal T2* contrast, echoes from multi-echo acquisitions should extend beyond 60 ms; and for optimal SNR, they should be combined with a target T2* value of ~80 ms.
Acknowledgements
No acknowledgement found.References
1. Wu B, Li W, Avram AV, Gho SM, Liu C. Fast and tissue-optimized mapping of magnetic susceptibility and T2* with multi-echo and multi-shot spirals. Neuroimage. 2012 Jan 2;59(1):297-305. doi: 10.1016/j.neuroimage.2011.07.019. Epub 2011 Jul 19. PMID: 21784162; PMCID: PMC3235505.
2. Zhang, Y. and Brady, M. and Smith, S. Segmentation of brain MR images through a hidden Markov random field model and the expectation-maximization algorithm. IEEE Trans Med Imag, 20(1):45-57, 2001.
3. Patenaude, B., Smith, S.M., Kennedy, D., and Jenkinson M. A Bayesian Model of Shape and Appearance for Subcortical Brain Segmentation. NeuroImage, 56(3):907-922, 2011.
4. Jenkinson, M.; Smith, S. A global optimisation method for robust affine registration of brain images. Med. Image Anal. 2001, 5, 143–156.
5. Jenkinson, M.; Bannister, P.; Brady, M.; Smith, S. Improved Optimization for the Robust and Accurate Linear Registration and Motion Correction of Brain Images. Neuroimage 2002, 17, 825–841.
6. Shin, S.; Yun, S.D.; Shah, N.J. T2* quantification using multi-echo gradient echo sequences: A comparative study of different readout gradients. Sci. Rep. 2023, 13, 1138.
7. Campbell-Washburn, A.E.; Ramasawmy, R.; Restivo, M.C. Opportunities in Interventional and Diagnostic Imaging by using high-performance low-field-strength MRI. Radiology 2019, 293, 2–11.
Figures