2680
Investigating the feasibility of resting state functional MRI with GRE EPI on a high performance 0.5 T Scanner1Medical Biophysics, Western University, London, ON, Canada, 2Synaptive Medical, Toronto, ON, Canada, 3Western University, London, ON, Canada
Synopsis
Keywords: Low-Field MRI, Low-Field MRI, resting-state, functional connectivity, resting-state network, test-retest reliability
Motivation: Resting state fMRI (rs-fMRI) provides vital neurological information in acute care.
Goal(s): To demonstrate the feasibility of rs-fMRI at 0.5T.
Approach: Repeated rs-fMRI acquisitions of two healthy volunteers (n = 6, n = 4) were acquired at 0.5T using a 31 min EPI based protocol.
Results: All eleven well-established resting state networks were identified. Sensorimotor and language networks were very reliable across scans for both volunteers with intersession intra-class correlation coefficient values > 0.5.
Impact: Resting state fMRI is feasible at 0.5T with an EPI acquisition technique. The functional connectivity detected resembles a 3T database for well-established resting-state networks.
INTRODUCTION
The smaller size, lighter weight, and compact fringe field of mid-field MRI systems enable easier siting and installation in locations close to the vulnerable patient population, which offers unique application scenarios for point-of-care and intraoperative monitoring. Blood-oxygen-level-dependent (BOLD) functional MRI (fMRI) is a tantalizing tool in acute settings, providing vital neurological information in cases of traumatic brain injury and ischemic stroke [1-3]. fMRI in the mid-field is limited due to reductions in magnetic susceptibility contrast and SNR; however recent studies have successfully established feasibility of task-based fMRI on modern mid-field scanners [4, 5]. The purpose of this work was to demonstrate the feasibility of resting state fMRI (rs-fMRI) at 0.5T.METHOD
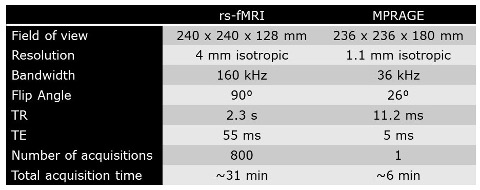
Imaging AcquisitionRepeated imaging of two healthy volunteers (n = 6, n = 4) was performed with informed consent in compliance with health and safety protocols on a head-only 0.5T MR system (Synaptive Medical, Toronto) with a 16-channel receiver array. On each volunteer EPI based rs-fMRI optimized for 0.5T [6] and MPRAGE were performed (Table 1).
rs-fMRI Processing
rs-fMRI processing was performed using GraphICA- FSL based platform (Brainet, London) [7]. Independent component maps were calculated for each network [8,9], which were then used as templates to identify the corresponding individual subjects’ voxel-wise z statistics. Further parcellations were implemented to the segmented anatomical images using a gradient-weighted Markov Random Field model [10]. For each parcel, a “node” was computed corresponding to the average z statistics from all voxels within the parcel. Functional connectivity (fc) maps were compared against representative networks produced from a 3T repository (Brainet Repository) [8].
Reliability and Repeatability Evaluation
Pearson correlation coefficients (r) were calculated for each parcel between each scan and the 3T data. These values were then converted to p-values based on the null hypothesis that r = 1 (i.e. the networks are similar). For each network an average p-value was computed. Low p-values correspond to a network being significantly different than the representative network.
Similarity scores were computed based on a student’s t-test of the nodes within a network, with null hypothesis that each node would be 0 across scans. Based on this, a ratio was calculated with the number of times the null hypothesis was rejected and the total number of nodes for a given network. If the similarity score is 1, the networks are perfectly repeatable, if 0, they are not repeatable at all.
Intersession intra-class correlation coefficients, a well-established measure of reliability of fMRI [12,13], were computed.
RESULTS/DISCUSSION
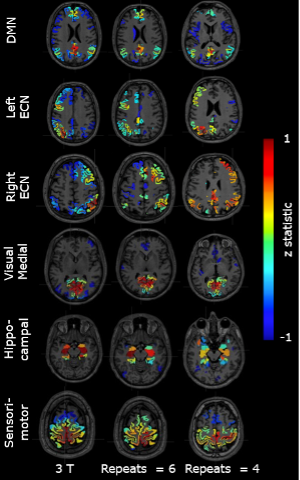
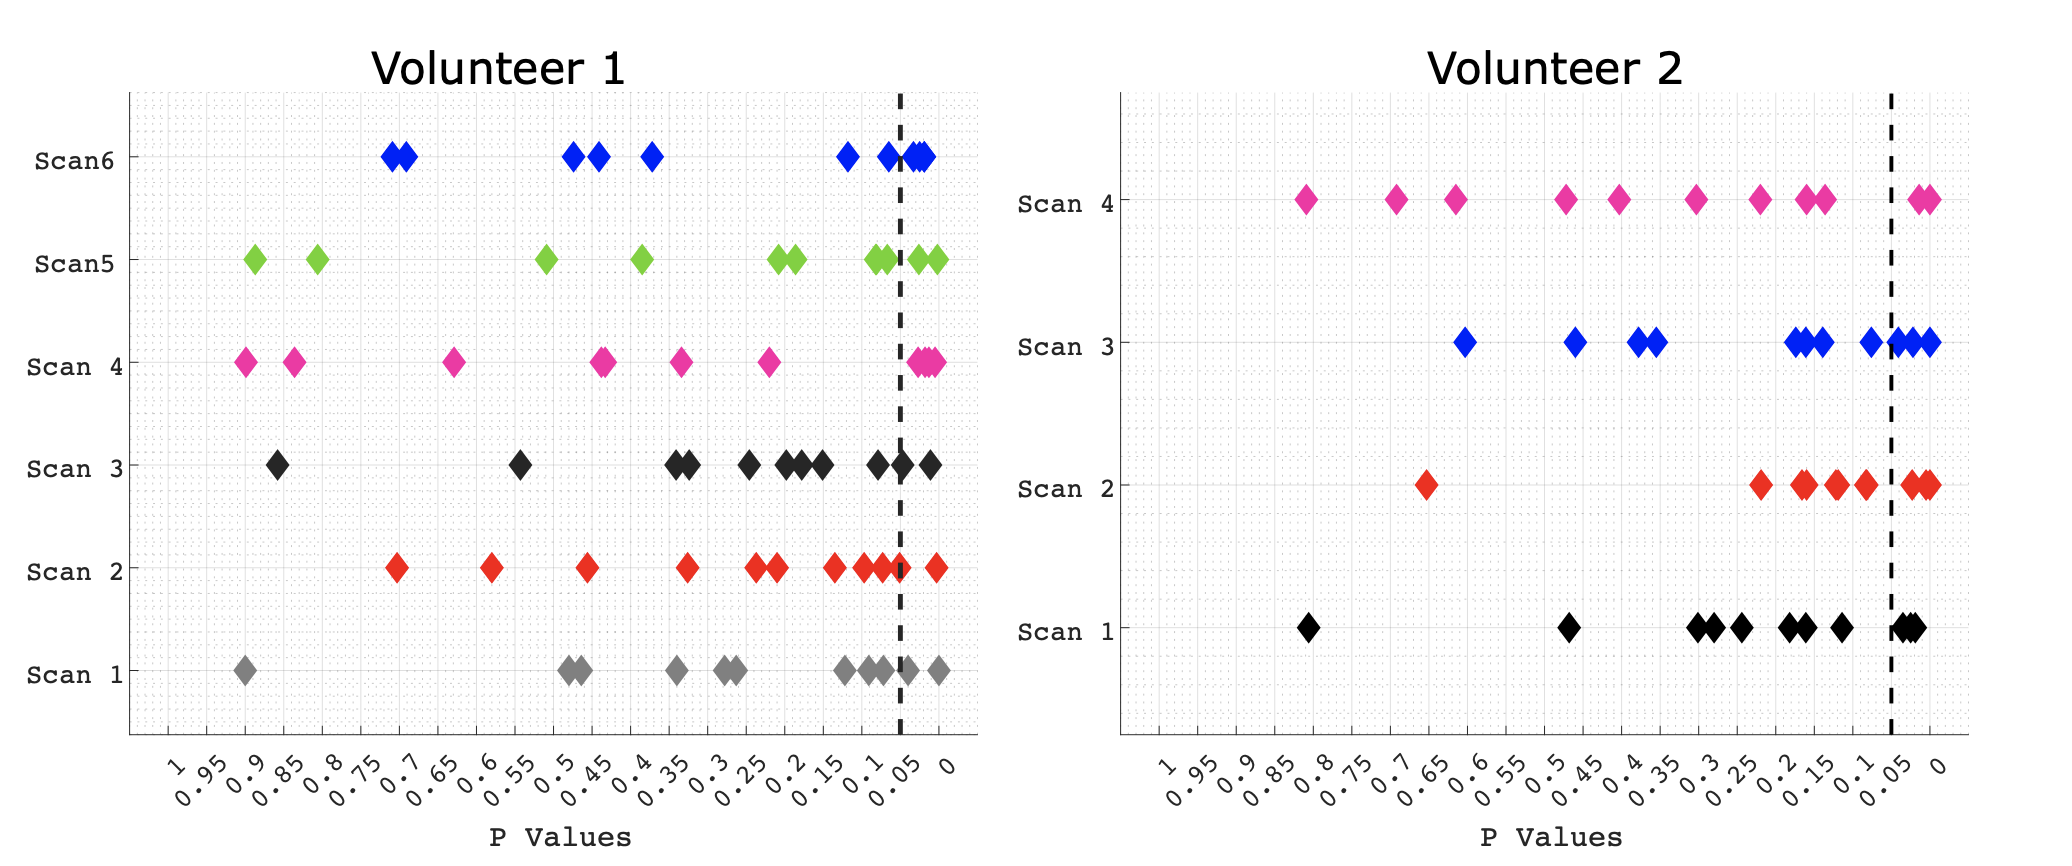
All eleven well-established resting state networks were identified. Figure 1 shows normalized z statistic maps of six representative networks. The first, second and third columns were calculated with the data collected at 3T, the averaged data collected with the 6 scans from Volunteer 1, and the averaged data collected with the 4 scans from Volunteer 2 respectively. Blue regions within the network are anticorrelated with the red regions. The spatial pattern of the networks match the expected functional connectivity patterns seen with the 3T data for both volunteers.Figure 2 shows the average p-values of each resting state network when compared to the 3T database. Only a small number of networks are significantly different than the 3T database (p-value < 0.05).
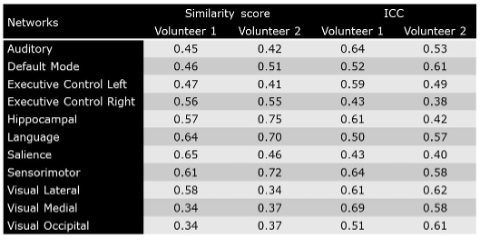
Table 2 shows similarity scores and ICC for all 11 resting state networks. Sensorimotor and language were very reliable across scans for both volunteers with similarity scores and ICC > 0.5. These scores are particularly important as they don’t include any averaging effect that might have affected the spatial pattern seen in Figure 1.
This study evaluated the reliability of rs-fMRI using a 31min fMRI acquisition establishing baseline performance of rs-fMRI at 0.5T. Future work will evaluate the reliability of rs-fMRI using shorter fMRI acquisitions.
CONCLUSIONS
rs-fMRI is feasible at 0.5T with an EPI acquisition technique. The functional connectivity detected resembles a 3T database for well-established resting-state networks.Acknowledgements
No acknowledgement found.References
1. Iraji A, et al. “Resting State Functional Connectivity in Mild Traumatic Brain Injury at the Acute Stage: Independent Component and Seed-Based Analyses”. J Neurotrauma. 2015; 32(14):1031-45.
2. Kroll H, et al. “Resting-State BOLD MRI for Perfusion and Ischemia”. Top Magn Reson Imaging. 2017 26(2):91-96.
3. Puig J, et al. “Resting-State Functional Connectivity Magnetic Resonance Imaging and Outcome After Acute Stroke”. Stroke 2018; 49(10):2353-2360.
4. Wang Y, et al. “FMRI based on transition-band balanced SSFP in comparison with EPI on a high-performance 0.55 T scanner”. Magn Reson Med. 2021;85(6):3196-3210.
5. Halder A, et al. “Investigating the feasibility of functional MRI using GRE EPI on a high performance 0.5 T Scanner”. ISMRM; Toronto, ON, Canada. 3–8 June 2023; pp. 9–11.
6. Halder A, et al. “Optimization of Gradient-Echo Echo-Planar Imaging for T2* Contrast in the Brain at 0.5 T”. Sensors (Basel). 2023;23(20):8428.
7. M. Jenkinson, C. F. Beckmann, T. E. J. Behrens, M. W. Woolrich, and S. M. Smith, “FSL,” Neuroimage, vol. 62, pp. 782–790, 2012, doi: 10.1016/j.neuroimage.2011.09.015.
8. D. Ribeiro de Paula et al., “A method for independent component graph analysis of resting-state fMRI,” Brain Behav, vol. 7, no. 3, pp. 1–12, 2017.
9. L. D. Nickerson, S. M. Smith, D. Öngür, and C. F. Beckmann, “Using dual regression to investigate network shape and amplitude in functional connectivity analyses,” Front Neurosci, vol. 11, no. MAR, pp. 1–18, 2017.
10. A. Schaefer et al., “Local-Global Parcellation of the Human Cerebral Cortex from Intrinsic Functional Connectivity MRI,” Cerebral Cortex, vol. 28, no. 9, pp. 3095–3114, 2018, doi: 10.1093/cercor/bhx179.
11. N. Z. Bielczyk et al., “Thresholding functional connectomes by means of mixture modeling,” Neuroimage, vol. 171, no. December 2017, pp. 402–414, 2018.
12. P. E. Shrout and J. L. Fleiss, “Intraclass correlations: Uses in assessing rater reliability,” Psychol Bull, vol. 86, no. 2, pp. 420–428, 1979, doi: 10.1037/0033-2909.86.2.420.
13. R. M. Birn, E. K. Molloy, Remi. Patriat, and Taurean. Parker, “The effect of scan length on the reliability of resting-state fMRI connectivity estimates,” Neuroimage, vol. 83, pp. 550–558, 2013.
Figures