2678
Two-point Dixon with balanced steady-state free precession (bSSFP): phantom experiments at 0.55T1Siemens Medical Solutions USA Inc, Malvern, PA, United States, 2Department of Radiology & Biomedical Imaging, University of California San Francisco, San Francisco, CA, United States
Synopsis
Keywords: Low-Field MRI, Low-Field MRI, Fat suppression, Dixon, bSSFP
Motivation: Fat suppression is challenging at low field strengths due to small fat frequency shifts. Dixon imaging with bSSFP offers an attractive solution by combining the robust fat-water separation performance of Dixon with the high SNR and scan speed of bSSFP sequence. However, the distinctive spectral response of bSSFP signals was overlooked in existing Dixon implementations.
Goal(s): This study aims to improve fat suppression with bSSFP sequence at low field by incorporating bSSFP signal model in a two-point Dixon algorithm.
Approach: Numerical simulations and phantom experiments were performed at 0.55T.
Results: Results suggest that integration of bSSFP signal model can improve fat suppression.
Impact: Our proposed bSSFP-based two-point Dixon method could improve imaging with fat suppression at low field, which has been a challenging task due to small fat frequency shift and low SNR.
Introduction
Fat suppression is particularly challenging at low field strength due to the relatively small frequency shift of fat (~80Hz at 0.55T compared to ~220 Hz at 1.5T). At low field strength, Dixon imaging with balanced steady-state free precession (bSSFP) sequence may be an appealing choice because it can combine the advantage of high SNR and scan speed of bSSFP with the reliable fat-water separation performance of Dixon1. bSSFP signal presents a distinctive spectral response characterized by periodic “pass bands” of signal magnitude and phase offset between bands2, whereas current implementations of Dixon methods1 only assume uniform spectral response. This study proposed to adapt a two-point Dixon algorithm1 to bSSFP signal model at 0.55T.Methods
Modified two-point Dixon framework for bSSFP: In the original framework proposed by Berglund et al1, the following signal functions were used:$$S_1=(W+\ a_1\ F)b_0 \ \ \ \ $$ $$S_2=(W+\ a_2\ F)b_0\ b \ \ [1]$$
, where b0 and b represent the water signal phase accumulated at TE1 and during ∆TE due to static field inhomogeneity (noted as ΔB0 in the following), and a1 and a2 represent the phase accumulation of fat relative to water.
Assuming a uniform spectral response such as in the GRE or TSE signal model, a1 and a2 can be readily calculated using the chemical shift and relative amplitude of multiple fat peaks:
$$a_{1,2}=\sum_{p=1}^P \rho_p e^{i2\pi f_p\ TE_{1,2}} \ \ \ \ [2] $$
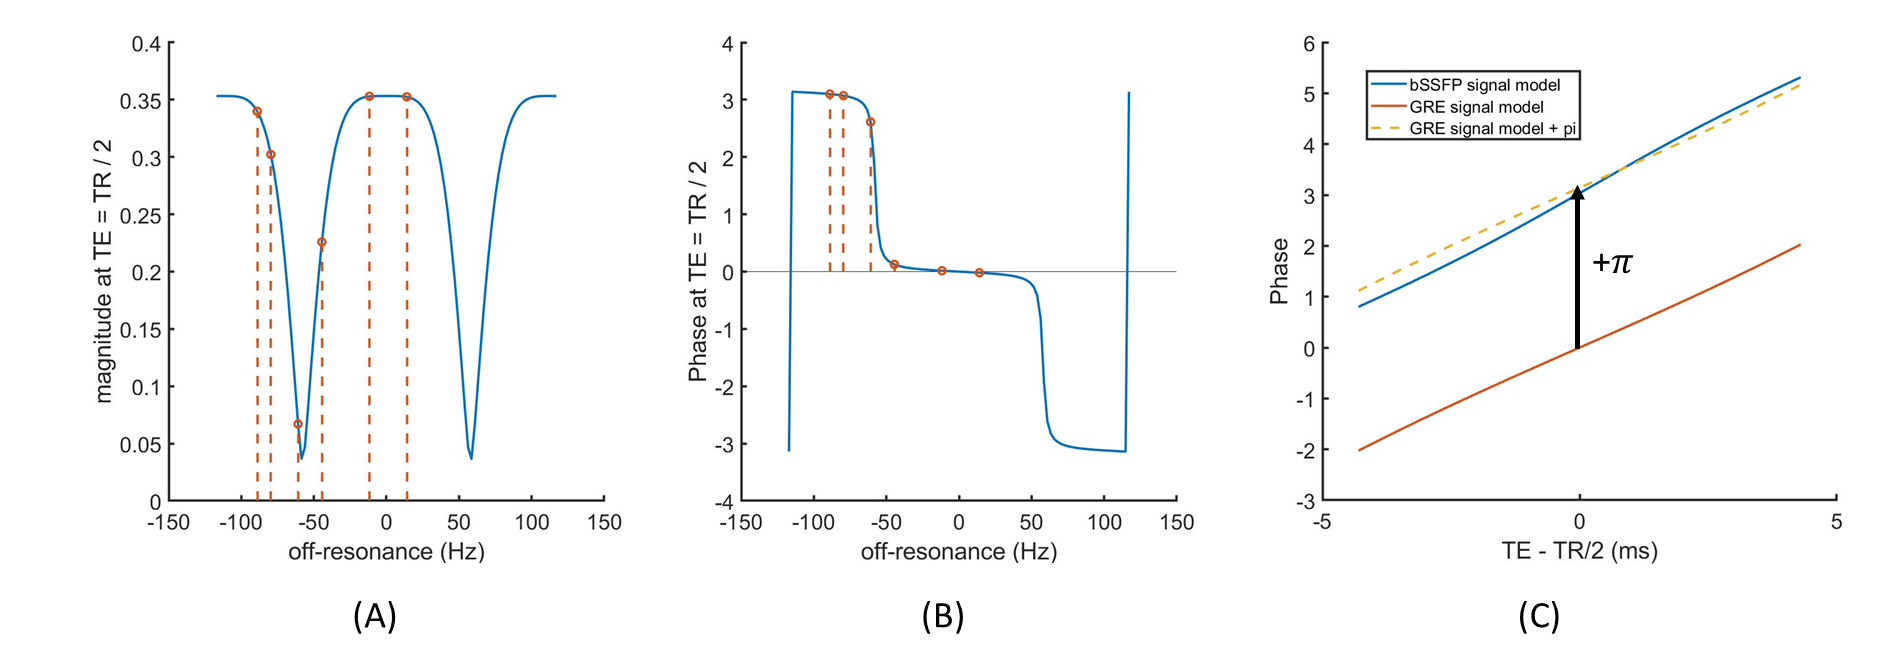
In the case of bSSFP, the multiple fat peaks lie in different “bands”, having different magnitude and (more importantly) phase response (Figure 1). The combined fat signal will accumulate phase differently from what was described in Equation [2]. To account for the bSSFP signal model, the following calculation of a1 and a2 are proposed:
$$a_{1,2}=e^{-i\varphi_{bSSFP}(f_m,\ TE_{1,2})}*\sum_{p=1}^P \rho_p e^{i\varphi_{bSSFP}(f_m+f_p,\ TE_{1,2})} \ \ \ \ [3] $$
, where $$$\varphi_{bSSFP}$$$ is the bSSFP signal phase response, which is a function of precession frequency. $$$f_m$$$ is the off resonance frequency of water caused by ΔB0, and $$$f_p$$$ is the frequency shift of fat.
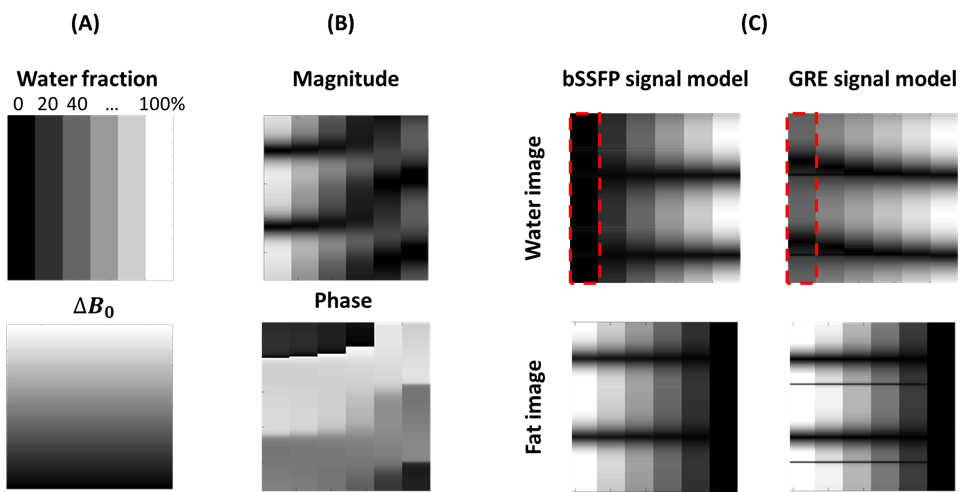
Numerical simulation: A numerical phantom was created, in which different water-fat mixtures were placed in a static background field that varies from -150 Hz to 100 Hz (Figure 2A). bSSFP steady state multi-echo signals were simulated using Bloch equations3 with the following sequence parameters: B0 = 0.55T, flip angle = 70°, TR/TE1/TE2 = 8.6/2.5/6.1 ms. The fat signal was modeled as six peaks4. Assuming the true ΔB0 field was known, the derived water and fat images were compared when Equation [2] or [3] was applied.
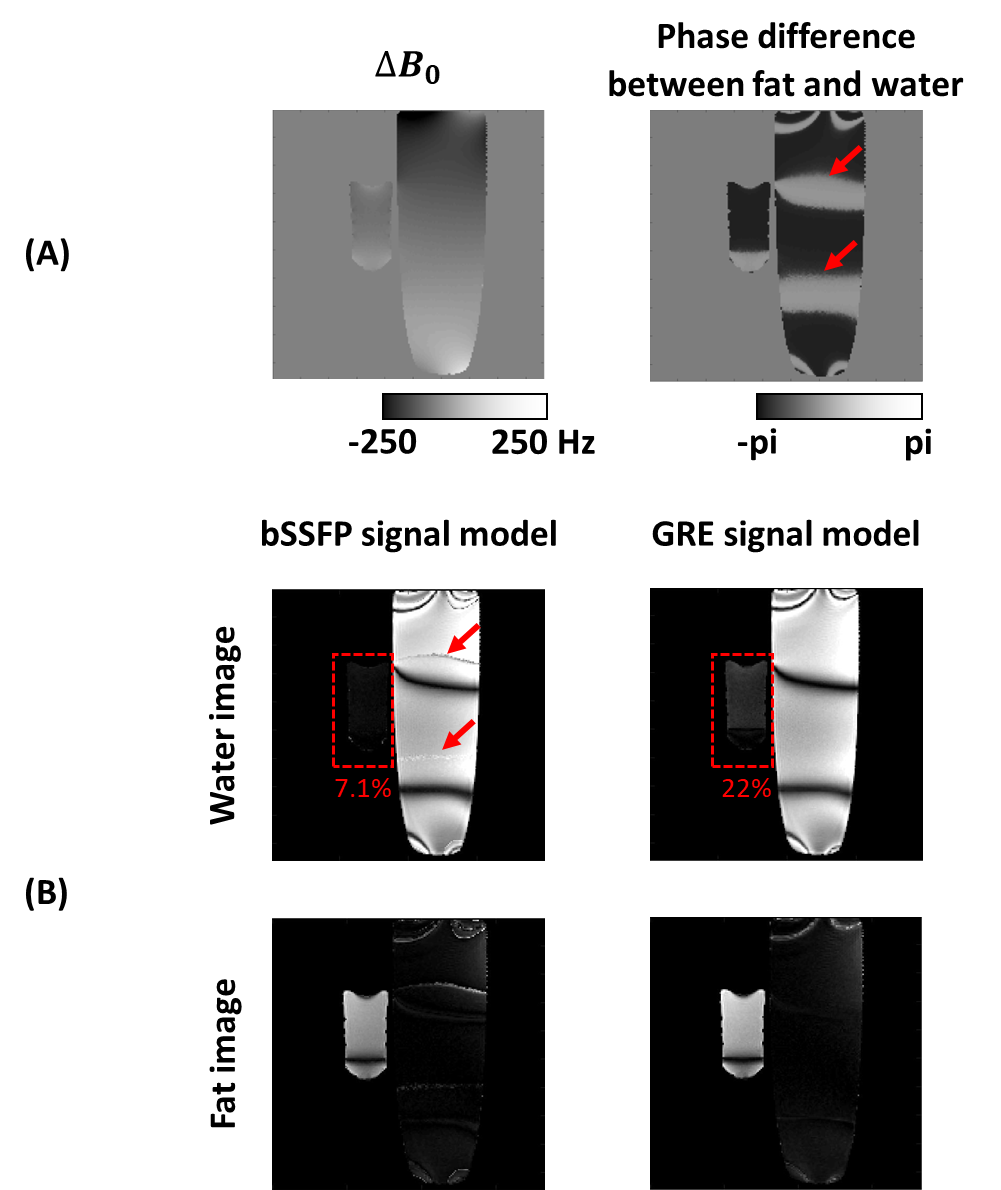
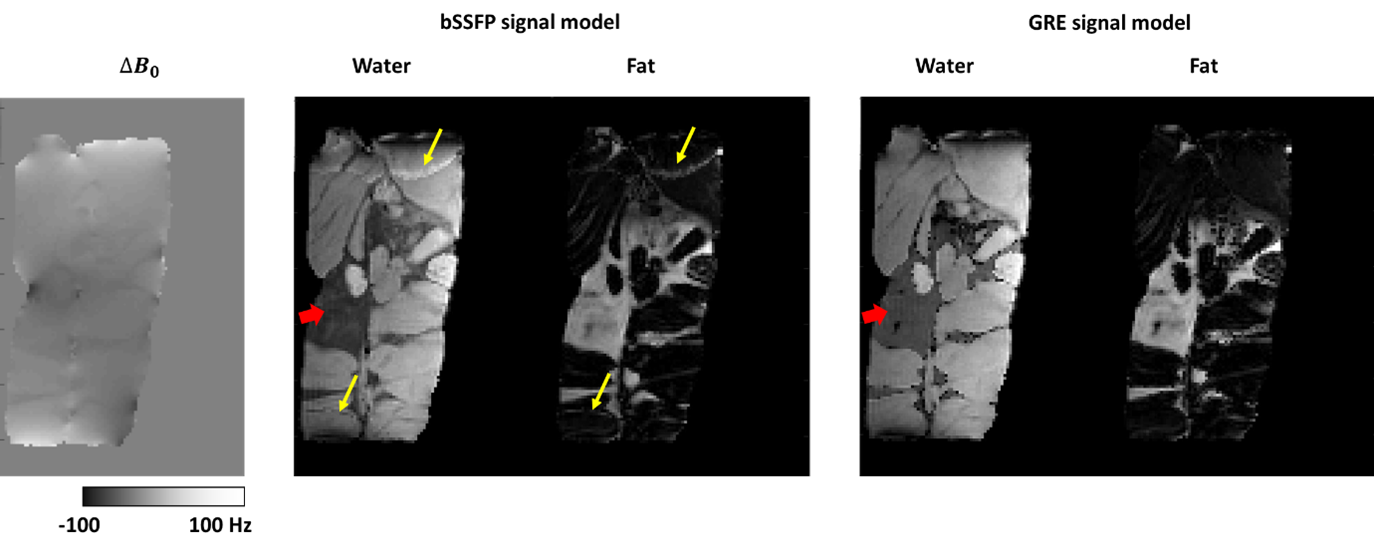
Phantom experiment: Phantom experiments were performed on a 0.55T MRI scanner (MAGNATOM Free.Max, Siemens Healthcare, Erlangen, Germany). In one experiment, two bottles one filled with water and the other with oil were scanned using a standard bSSFP sequence with two-echo monopolar readouts (TR/TE1/TE2 = 8.6/2.5/6.1 ms, flip angle = 70). A shim gradient was applied during imaging to generate a significant field of ±250 Hz. Keeping the same shimming condition, the phantom was scanned again using a multi-echo GRE sequence to measure the ΔB0 field. In another experiment, a meat phantom was scanned in a similar way with the same sequence parameters. Resulting water and fat images were compared when Equation [2] or [3] was applied. Fat suppression was evaluated using a “leakage index“ defined as the ratio of signals in the fat-suppressed and water-dominant regions in the water image.
Results
Numerical simulation (Figure 2) showed better fat suppression could be achieved when bSSFP signal model compared to GRE signal model was used in the two-point Dixon algorithm. The difference was most significant in the region of pure fat. Results of phantom experiments also showed cleaner fat suppression when bSSFP signal model was applied (Figure 3 and 4), although string-like artifact was observed at the locations where the fat-water relative phase map have discontinuities.Discussion
This study has demonstrated that better fat suppression can be achieved in bSSFP-based two-point Dixon at 0.55T when bSSFP signal model was considered. This aligns with previous findings at 1.5T5. The study only investigated the effect of bSSFP signal response in one specific two-point Dixon algorithm1. However, such effect may be different in other kinds of Dixon methods, such as classification-based algorithms. Another limitation of this study is that ΔB0 map was obtained through a separate scan, which may be impractical for in-vivo scan. Future studies will aim to obtain accurate ΔB0 distribution from the two-echo bSSFP data itself, potentially through iterative algorithms6.Acknowledgements
No acknowledgement found.References
1. Berglund J, Ahlström H, Johansson L, Kullberg J. Two‐point Dixon method with flexible echo times. Magnetic resonance in medicine. 2011 Apr;65(4):994-1004.
2. Bieri O, Scheffler K. Fundamentals of balanced steady state free precession MRI. Journal of Magnetic Resonance Imaging. 2013 Jul;38(1):2-11.
3. Zur Y, Stokar S, Bendel P. An analysis of fast imaging sequences with steady-state transverse magnetization refocusing. Magn Reson Med 1988; 6: 175–193.
4. Yu H, Shimakawa A, McKenzie CA, Brodsky E, Brittain JH, Reeder SB. Multiecho water‐fat separation and simultaneous R estimation with multifrequency fat spectrum modeling. Magnetic Resonance in Medicine: An Official Journal of the International Society for Magnetic Resonance in Medicine. 2008 Nov;60(5):1122-34.
5. Henze Bancroft LC, Strigel RM, Hernando D, Johnson KM, Kelcz F, Kijowski R, Block WF. Utilization of a balanced steady state free precession signal model for improved fat/water decomposition. Magnetic resonance in medicine. 2016 Mar;75(3):1269-77.
6. Reeder, S.B., Pineda, A.R., Wen, Z., Shimakawa, A., Yu, H., Brittain, J.H., Gold, G.E., Beaulieu, C.H. and Pelc, N.J., 2005. Iterative decomposition of water and fat with echo asymmetry and least‐squares estimation (IDEAL): application with fast spin‐echo imaging. Magnetic Resonance in Medicine: An Official Journal of the International Society for Magnetic Resonance in Medicine, 54(3), pp.636-644.
Figures