2676
Cardiac MRF for Simultaneous T1, T2 and Fat-Fraction Quantification at 0.55T1Millenium Institute for Intelligent Healthcare Engineering, Santiago, Chile, 2Institute for Biological and Medical Engineering, Pontificia Universidad Católica de Chile, Santiago, Chile, 3School of Biomedical Engineering, King's College London, London, United Kingdom, 4School of Engineering, Pontificia Universidad Católica de Chile, Santiago, Chile
Synopsis
Keywords: Low-Field MRI, Low-Field MRI, MR Fingerprinting, T1 Mapping, T2 Mapping, Fat-fraction Quantification
Motivation: Cardiac MRF is a powerful imaging-technique that allows for comprehensive myocardial tissue characterization in a single-scan and has been proposed at 1.5T and 3T. However, cMRF has not been demonstrated at lower-field yet.
Goal(s): Investigate the feasibility of a Dixon-cMRF sequence for simultaneous T1, T2 and fat-fraction quantification at 0.55T.
Approach: Dual-echo spoiled-GRE-acquisition with varying IR-T2-preparation pulses. Experiments were performed on standardized phantoms and with 5 healthy volunteers and compared with spin-echo references.
Results: T1, T2 and fat-fraction Dixon-cMRF at 0.55T was tested with phantoms and with healthy subjects, showing good agreement with reference values in phantom and promising results in healthy subjects.
Impact: The simultaneous quantification of T1, T2 and fat-fraction at 0.55T in a single cardiac-MRF of 15s could provide an alternative to higher field scanners, allowing for a more accessible way to assess cardiovascular disease.
Introduction
Quantitative T1 and T2 parametric maps have been increasingly incorporated into clinical cardiac MR examinations to provide objective myocardial tissue characterization including fibrosis, inflammation1 and edema2. In addition to T1 and T2 mapping, fat characterization plays an important role in evaluating cardiovascular disease3,4 (CVD). Moreover, water and fat partial volume is a known source of error in parametric mapping5. Conventional methods perform T1 and T2 maps in several separate scans, at different slice positions, under breath-holding, potentially leading to mis-registration between the different acquisitions and ultimately, leading to considerable patient fatigue. Cardiac Magnetic Resonance Fingerprinting (cMRF) has been proposed to enable simultaneous T1 and T2 mapping6,7,8 and has been extended to enable additional fat-fraction (FF) estimation9. At the same time, lower-field strengths (<1T) may offer more efficient imaging due to shorter T1 times, longer T2 times and improved B0 and B1 homogeneity, at a lower cost when compared with 1.5T and 3T10. However, there is limited experience with myocardial parametric mapping at lower-field strengths. In this study, we implement and evaluate the feasibility of dual-echo Dixon-cMRF for simultaneous T1, T2 and FF quantification at 0.55T.Methods
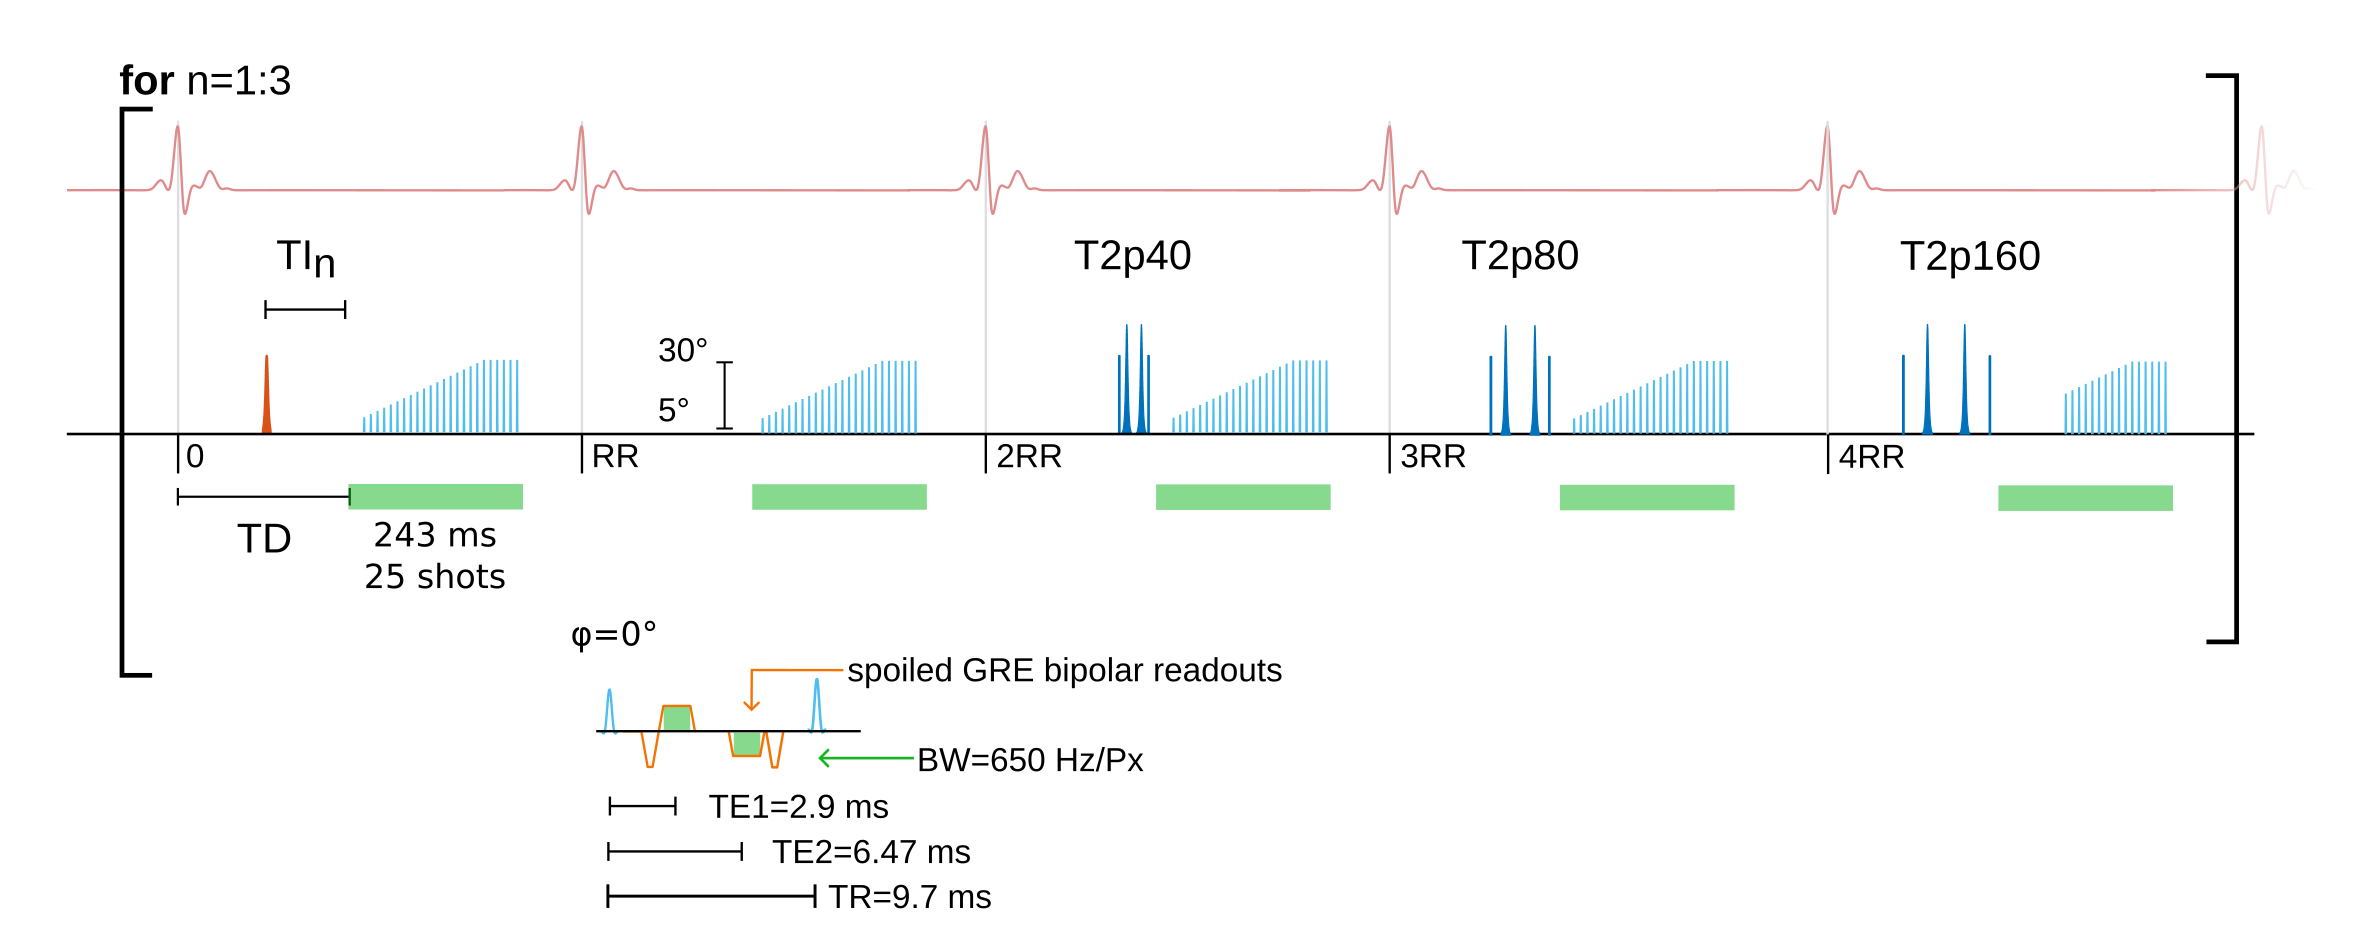
The proposed dual-echo Dixon-cMRF sequence consists of a 15-heartbeat ECG-triggered tiny-golden angle radial spoiled-GRE bipolar-readout acquisition with varying inversion and T2 preparation pulses (Figure 1). Inversion pulses are applied every 5 heartbeats (HB) with delays of [17, 300, 17]ms, and T2 preparations pulses with durations of [0, 0, 40, 80, 160]ms are repeated 3 times over 15HB. Additional contrast encoding is achieved using a flip angle pattern composed of a linear ramp-up of 20 RF pulses of [5°-30°] followed by 5 constant-RF pulses of 30°. The sequence was implemented using the Pulseq11 format for sequence design. The proposed approach was evaluated using a standardized T1MES12 phantom for T1-T2 comparison, and a Calimetrix13 phantom for FF comparison. Spin-echo (SE) sequences were employed to obtain T1-T2 reference maps at 0.55T. In-vivo acquisitions were performed on 5 healthy subjects (4 males, 1 female, 27±0 years) using a 0.55T MR-scanner (MAGNETOM Free.Max, Siemens Healthcare, Erlangen, Germany), with a 15-channel receiver coil. Imaging parameters for Dixon-cMRF were: spatial resolution=2x2mm², slice thickness=10mm, receiver-bandwidth=650Hz/px, FOV=256x256mm², TR/TE1/TE2=9.7/2.9/6.47ms, 25 radial-spokes per heartbeat, resulting in a mid-diastolic acquisition window of ~243ms for a total scan time of ~15s.For each acquisition, a dictionary was simulated using the extended phase graphs (EPG) formalism14, considering a range (denoted as [lower-value: step-size: upper-value]) of T1s of [50:50:500,500:5:1000,1000:50:1500,1500:100:2000]ms and a range of T2s of [4:1:80,80:5:200,200:20:400]ms.
Echo images were reconstructed using low-rank inversion15 and a high-dimensional patch-based regularization16. Water-fat separation was computed using the B0-NICE non-iterative algorithm17. T1 and T2 maps were extracted through dot-product matching between the dictionary and the water-fat separated time-series, to obtain water-specific parametric maps T1-water, T2-water and FF.
Results
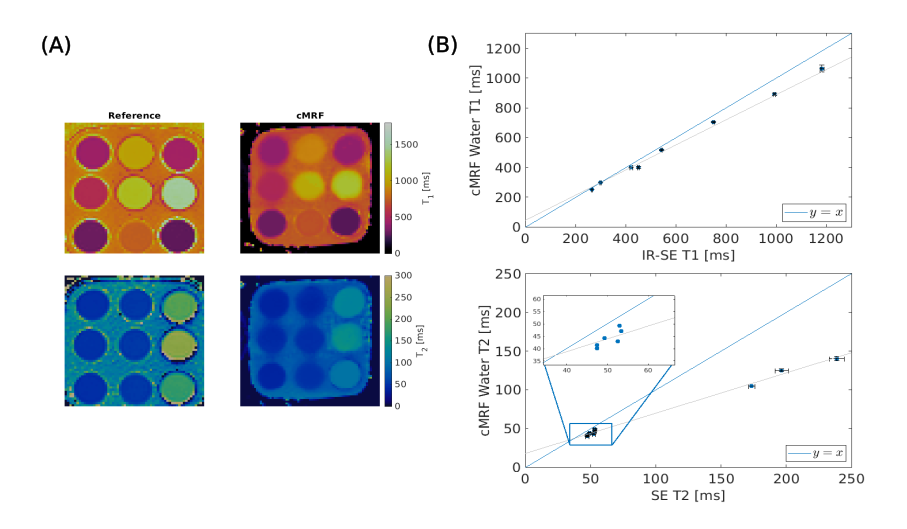
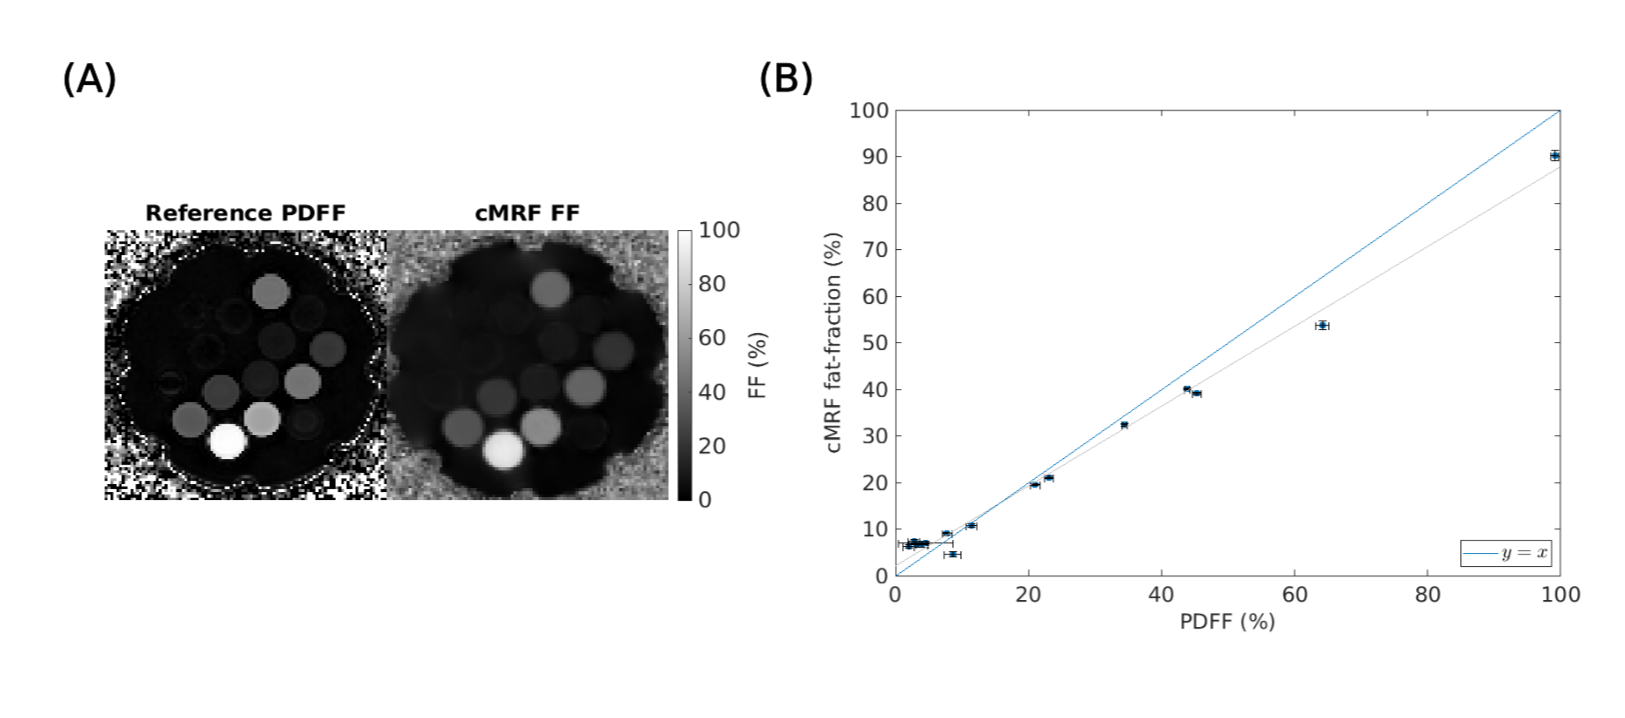
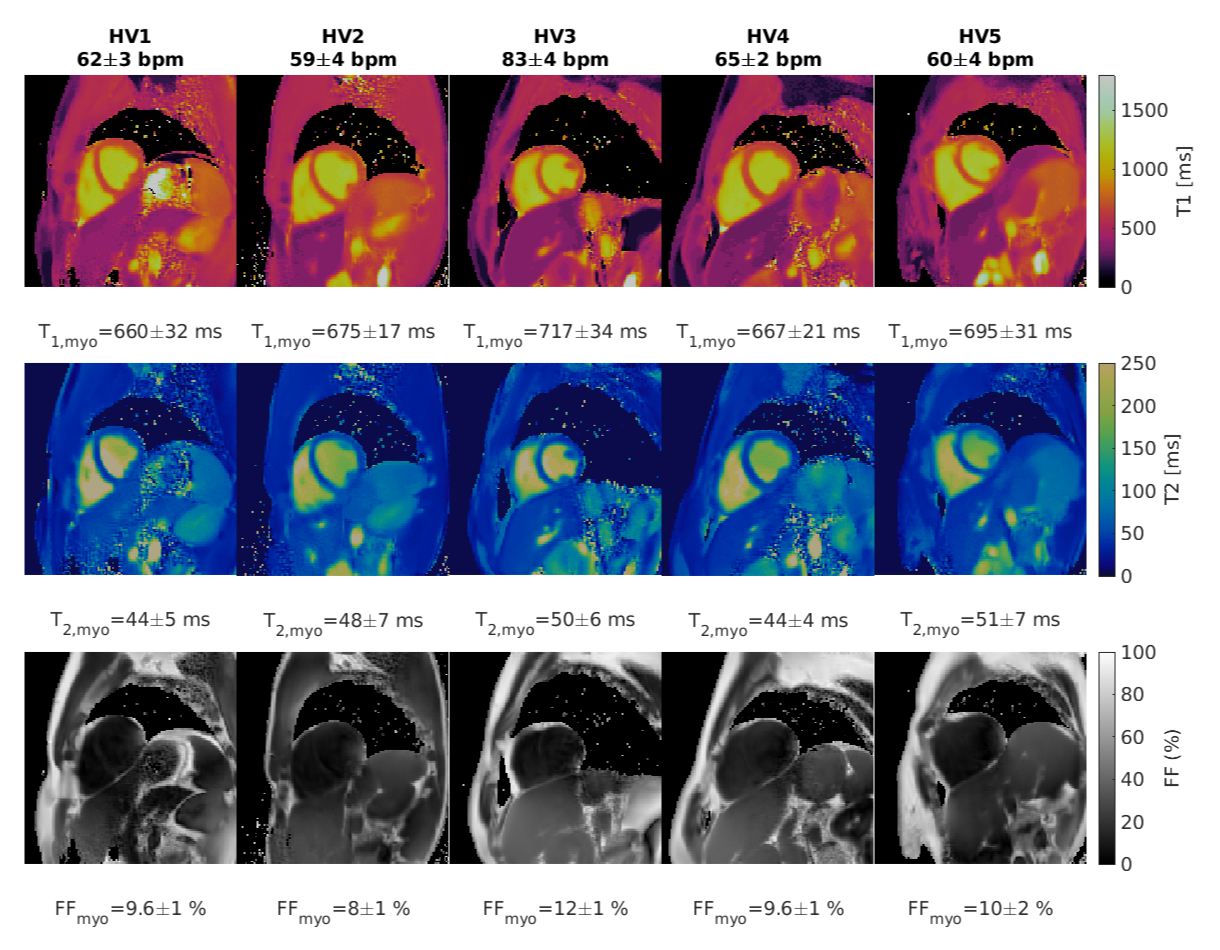
Phantoms: T1 and T2 maps with the proposed Dixon-cMRF at 0.55T are shown in Figure 2 for the T1MES phantom in comparison to SE references, along with the correlation plots. T1 values are in good agreement with the reference, particularly for values within the range of interest (<1200ms). T2 values also show good agreement with the reference within the range of interest (<150ms). The obtained FF map is shown in Figure 3, alongside with the Calimetrix phantom and proton-density-FF (PDFF) reference, as well as the correlation plot for the estimated values. Estimated FF values show good agreement with the reference values, but there is an underestimation for the higher PDFF values, particularly for those greater than 40%.Healthy subjects: T1, T2 and FF maps for 5 healthy subjects are shown in Figure 4 with the proposed Dixon-cMRF at 0.55T. Good map quality is achieved across all healthy subjects. T1, T2 and FF values were measured in the septum area of the myocardium (mean and spatial variability) and quantify in average as 682±23ms (T1), 47±3ms (T2) and 9.8±1.4% (FF), resulting in underestimation (T1, T2) and overestimation (FF) when compared to literature values reports18,19 as 701ms, 55ms, and 1%, respectively.
Discussion and Conclusions
A dual-echo Dixon-cMRF sequence for T1, T2 and FF mapping was implemented and evaluated at 0.55T. Phantom results are in good agreement with the reference values (within the range of interest) for T1, T2 and fat-fraction. In-vivo results show good map quality and are promising. Further steps will investigate the underestimation (T1, T2) and overestimation (FF) observed in-vivo with respect to reference values, including comparison with conventional T1-MOLLI and T2-bSSFP mapping techniques. Evaluation in a larger cohort of healthy subjects and patients with suspected CVD will be also investigated as future work.Acknowledgements
The authors acknowledge financial support from: (1) BHF RG/20/1/34802, (2) EPSRC EP/V044087/, (3) ANID Millennium Institute iHEALTH, ICN2021_004; Fondecyt 1210637 and 1210638; Fondequip Mayor EQY210003; Basal Funding, IMPACT, FB210024 and (6) the Technical University of Munich – Institute for Advanced Study.
References
1. Haaf P, Garg P, Messroghli DR, Broadbent DA, Greenwood JP, Plein S. Cardiac T1 mapping and extracellular volume (ECV) in clinical practice: a comprehensive review. J Cardiovasc Magn Reson. 2017;18:89.
2. Giri S, Chung Y-C, Merchant A, et al. T2 quantification for improved detection of myocardial edema. J Cardiovasc Magn Reson. 2009;11:56.
3. Mordi I, Radjenovic A, Stanton T, et al. Prevalence and prognostic significance of lipomatous metaplasia in patients with prior myocardial infarction. JACC Cardiovasc Imaging. 2015;8:1111-1112.
4. Kellman P, Hernando D, Shah S, et al. Multiecho Dixon fat and water
separation method for detecting fibrofatty infiltration in the myocardium. Magn Reson Med. 2009;61:215-221.
5. Kellman P, Bandettini WP, Mancini C, Hammer-Hansen S, Hansen MS, Arai AE. Characterization of myocardial T1-mapping bias caused by intramyocardial fat in inversion recovery and saturation recovery techniques. J Cardiovasc Magn Reson. 2015;17:33.
6. Ma D, Gulani V, Seiberlich N, et al. Magnetic resonance fingerprinting. Nature. 2013;495:187–192.
7. Hamilton JI, Jiang Y, Chen Y, et al. MR fingerprinting for rapid quantification of myocardial T1, T2, and proton spin density. Magn Reson Med. 2017;77:1446–1458.
8. Liu Y, Hamilton J, Rajagopalan S, Seiberlich N. Cardiac magnetic resonance fingerprinting: technical overview and initial results. JACC Cardiovasc Imaging. 2018;11:1837–1853.
9. Jaubert O, Cruz G, Bustin A, et al. Water–fat Dixon cardiac magnetic resonance fingerprinting. Magn Reson Med. 2020;83:2107–2123.
10. Adrienne E. Campbell-Washburn, Yun Jiang, Gregor Körzdörfer, Mathias Nittka, Mark A. Griswold. Feasibility of MR fingerprinting using a high-performance 0.55 T MRI system. J Magn Reson Imaging. 2021;81:88-93.
11. K. J. Layton et al., Pulseq: A rapid and hardware-independent pulse sequence prototyping framework. Magn Reson Med. 2017;77:1544–1552.
12. Captur G, Gatehouse P, Keenan KE, Heslinga FG, Bruehl R, Prothmann M, Graves MJ, Eames RJ, Torlasco C, Benedetti G, Donovan J, Ittermann B, Boubertakh R, Bathgate A, Royet C, Pang W, Nezafat R, Salerno M, Kellman P, Moon JC. A medical device-grade T1 and ECV phantom for global T1 mapping quality assurance-the T1 Mapping and ECV Standardization in cardiovascular magnetic resonance (T1MES) program. J Cardiovasc Magn Reson. 2016;1:18-58.
13. Zhao, R, Hernando, D, Harris, DT, et al. Multisite multivendor validation of a quantitative MRI and CT compatible fat phantom. Med Phys. 2021; 48: 4375–4386.
14. Weigel M. Extended phase graphs: dephasing, RF pulses, and echoes - pure and simple. J Magn Reson Imaging. 2015;41:266–295.
15. Assländer J, Cloos MA, Knoll F, Sodickson DK, Hennig J, Lattanzi R. Low rank alternating direction method of multipliers reconstruction for MR fingerprinting. Magn Reson Med. 2018;79:83–96.
16. Bustin A, Cruz G, Jaubert O, Karina L, Botnar RM, Prieto C. High-dimensionality undersampled patch-based reconstruction (HD-PROST) for accelerated multi-contrast MRI. Magn Reson Med. 2019;81:3705–3719.
17. Liu, J. and Drangova, M. (2015), Method for B0 off-resonance mapping by non-iterative correction of phase-errors (B0-NICE). Magn Reson Med. 2015;74:1177-1188.
18. Campbell-Washburn AE, Ramasawmy R, Restivo MC, Bhattacharya I, Basar B, Herzka DA, Hansen MS, Rogers T, Bandettini WP, McGuirt DR, Mancini C, Grodzki D, Schneider R, Majeed W, Bhat H, Xue H, Moss J, Malayeri AA, Jones EC, Koretsky AP, Kellman P, Chen MY, Lederman RJ, Balaban RS. Opportunities in Interventional and Diagnostic Imaging by Using High-Performance Low-Field-Strength MRI. Radiology. 2019;293(2):384-393.
19. Liu CY, Redheuil A, Ouwerkerk R, Lima JA, Bluemke DA. Myocardial fat quantification in humans: Evaluation by two-point water-fat imaging and localized proton spectroscopy. Magn Reson Med. 2010;63(4):892-901.
Figures