2675
Feasibility of Lung MR Fingerprinting at 0.55T using a Deep Image Prior Reconstruction1Department of Biomedical Engineering, University of Michigan, Ann Arbor, MI, United States, 2Department of Medicine, University of Michigan, Ann Arbor, MI, United States, 3Department of Radiology, University of Michigan, Ann Arbor, MI, United States
Synopsis
Keywords: Low-Field MRI, Lung
Motivation: Parametric mapping may enable early detection and monitoring of pulmonary diseases but is hampered by low signal levels, short T2/T2* values, and susceptibility artifacts.
Goal(s): This project aims to develop an MRF approach for simultaneous 2D T1, T2, and M0 mapping in the lungs on a commercial 0.55T scanner.
Approach: MRF data were acquired in five healthy subjects during a 16s breathhold, repeated at end-inspiration and end-expiration, and reconstructed using a deep image prior.
Results: Feasibility of lung MRF at 0.55T was demonstrated in healthy subjects, with lung T1 of 868±57ms (expiration) and 806±59ms (inspiration), and T2 of 54.1±3.2ms (expiration) and 58.7±4.0ms (inspiration).
Impact: This study demonstrates the feasibility of MR Fingerprinting for 2D T1, T2, and M0 mapping of the lung parenchyma at 0.55T in healthy subjects, which may have future clinical implications for various pulmonary diseases including asthma, emphysema, and cystic fibrosis.
Introduction
Quantitative MRI T1 and T2 mapping have shown promise for early detection and monitoring of various pulmonary conditions, including cystic fibrosis, asthma, edema, and emphysema.1 However, parametric mapping in the lungs is challenging due to low signal levels, short T2 and T2* values, and susceptibility artifacts.2 Low-field imaging presents several potential advantages for lung parametric mapping due to improved field homogeneity, reduced susceptibility effects, and longer T2 and T2* compared to higher field strengths.3 This study introduces a lung Magnetic Resonance Fingerprinting (MRF) technique for simultaneous T1, T2 and proton density (M0) mapping in 2D on a commercial 0.55T scanner, with feasibility demonstrated in healthy subjects.Methods
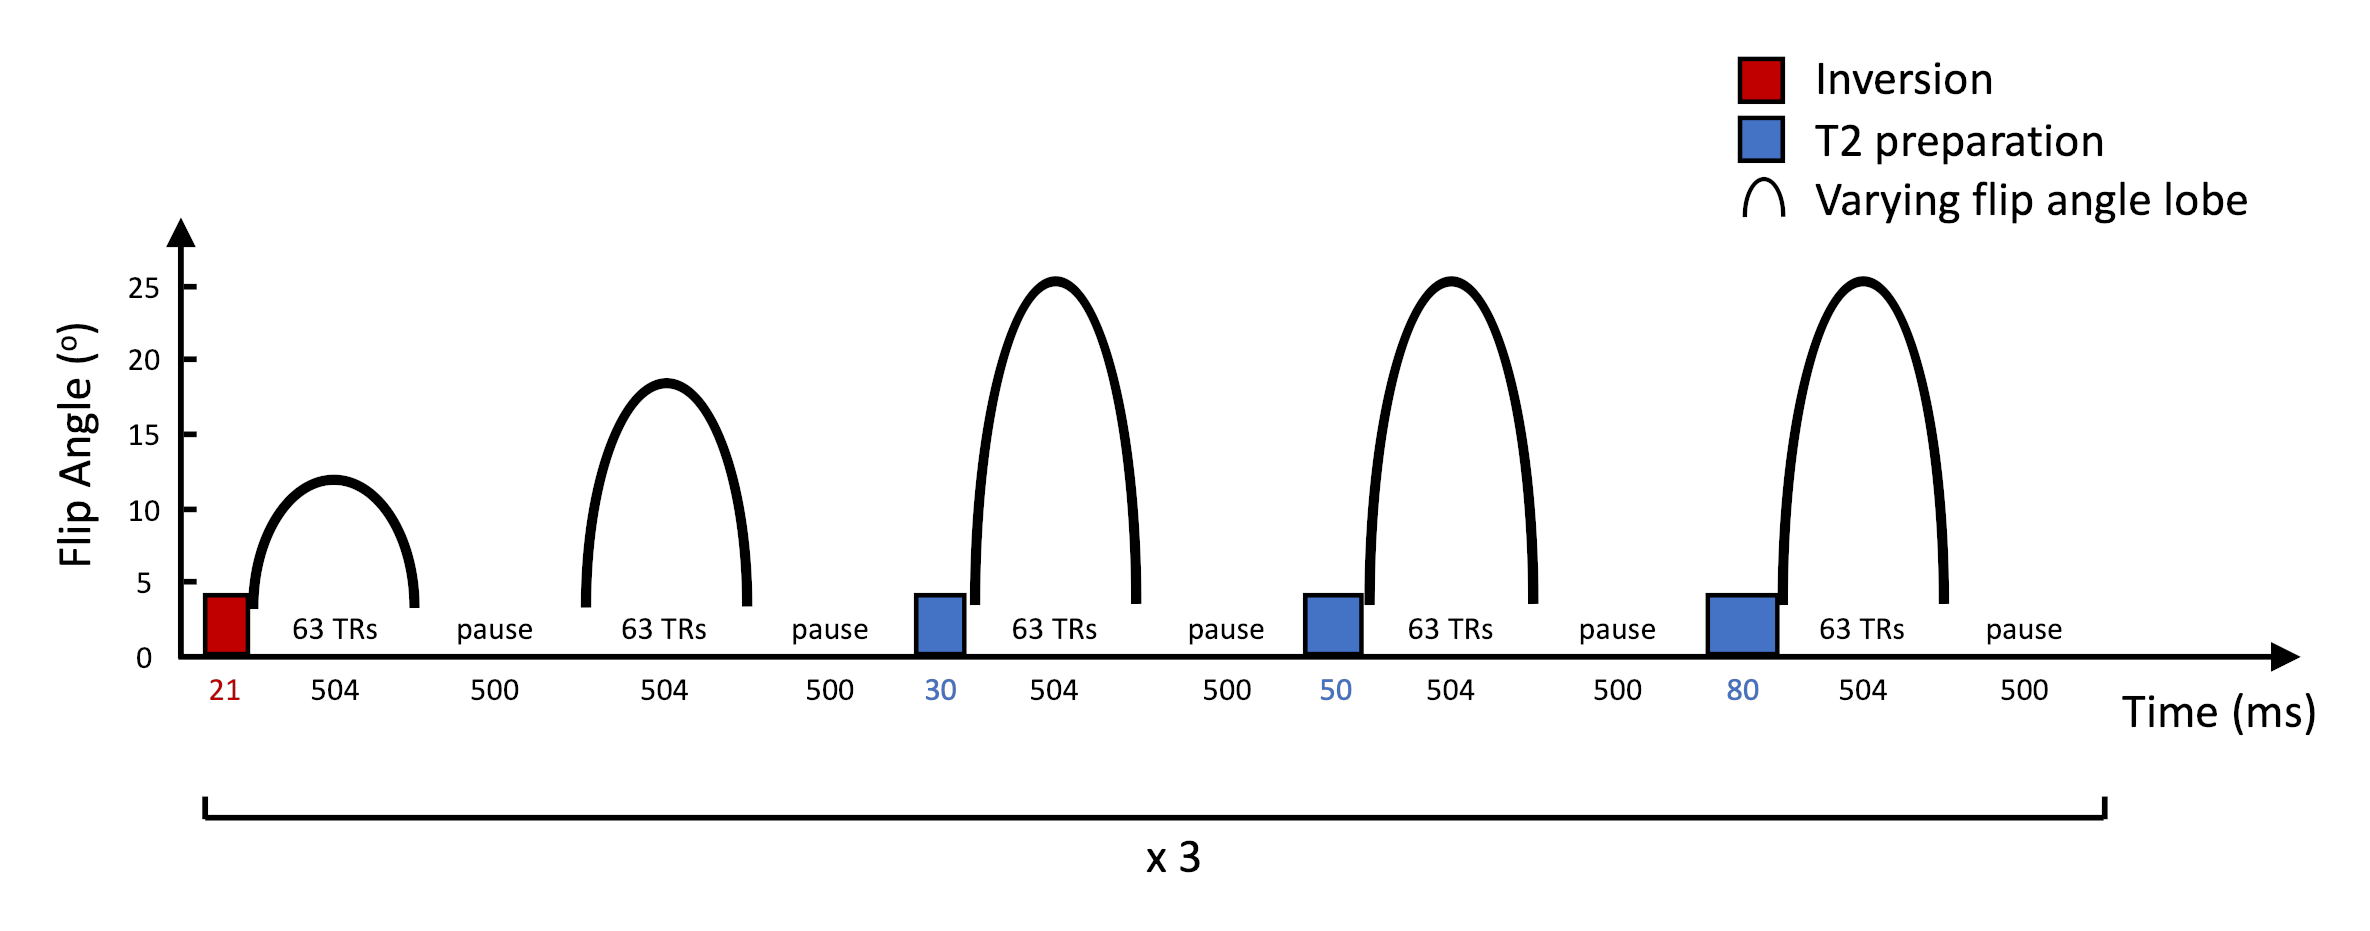
MRF Sequence: A 2D cardiac MRF sequence originally employed at 1.5T was adapted for lung tissue characterization at 0.55T.4 The sequence used a FISP readout5 with constant TR/TE (8.0/1.4ms) and time-varying flip angles between 4-25o. Figure 1 shows the first 5 out of 15 flip angle segments in the sequence. An inversion (TI 21ms) was applied before the first segment, and T2 preparations with durations of 30, 50, and 80ms were applied before the third, fourth, and fifth segments. The scan acquired 945 total TRs, and a 500ms pause after each segment allowed for T1 recovery to increase signal levels. Data were sampled in k-space using an 89-fold undersampled spiral trajectory (maximum gradient amplitude 15.2mT/m, slew rate 35T/m/s, readout duration 5ms), which was rotated by the golden angle each TR.Reconstruction: A Bloch equation simulation was performed to compute a dictionary of 8475 magnetization timecourses for T1 60-3000ms and T2 6-1000ms. MRF data were reconstructed using two different methods for comparison. First, images were reconstructed using a low-rank (LR) reconstruction with locally low-rank regularization6, which were matched to the dictionary to obtain T1, T2, and M0 maps. Second, a deep image prior (DIP) reconstruction was performed that uses an untrained U-net to generate parametric maps without dictionary matching.7 The U-net weights are optimized to enforce consistency with undersampled k-space data, with training performed de novo after each scan.
Experiments: The T2 layer of the ISMRM/NIST MRI system phantom8 was scanned at 0.55T (MAGNETOM Free.Max, Siemens Healthineers, Erlangen, Germany) to assess accuracy and precision. The mean and standard deviation in MRF T1 and T2 measurements were compared to reference values from inversion recovery and single-echo spin echo sequences. Next, five healthy subjects were scanned at a coronal slice through the lungs using 2D MRF with a breathhold duration of 16s, 1.6x1.6x8.0mm3 spatial resolution, and 450x450mm2 FOV. MRF scans were repeated while subjects performed an end-expiratory breathhold, and again during an end-inspiratory breathhold to investigate potential changes in T1 and T2 due to respiratory phase. Maps were reconstructed using LR and DIP methods, as described above. Regions of interest were manually drawn in the lung parenchyma (avoiding blood vessels), and the mean and standard deviation in T1, T2, and M0 were measured.
Results
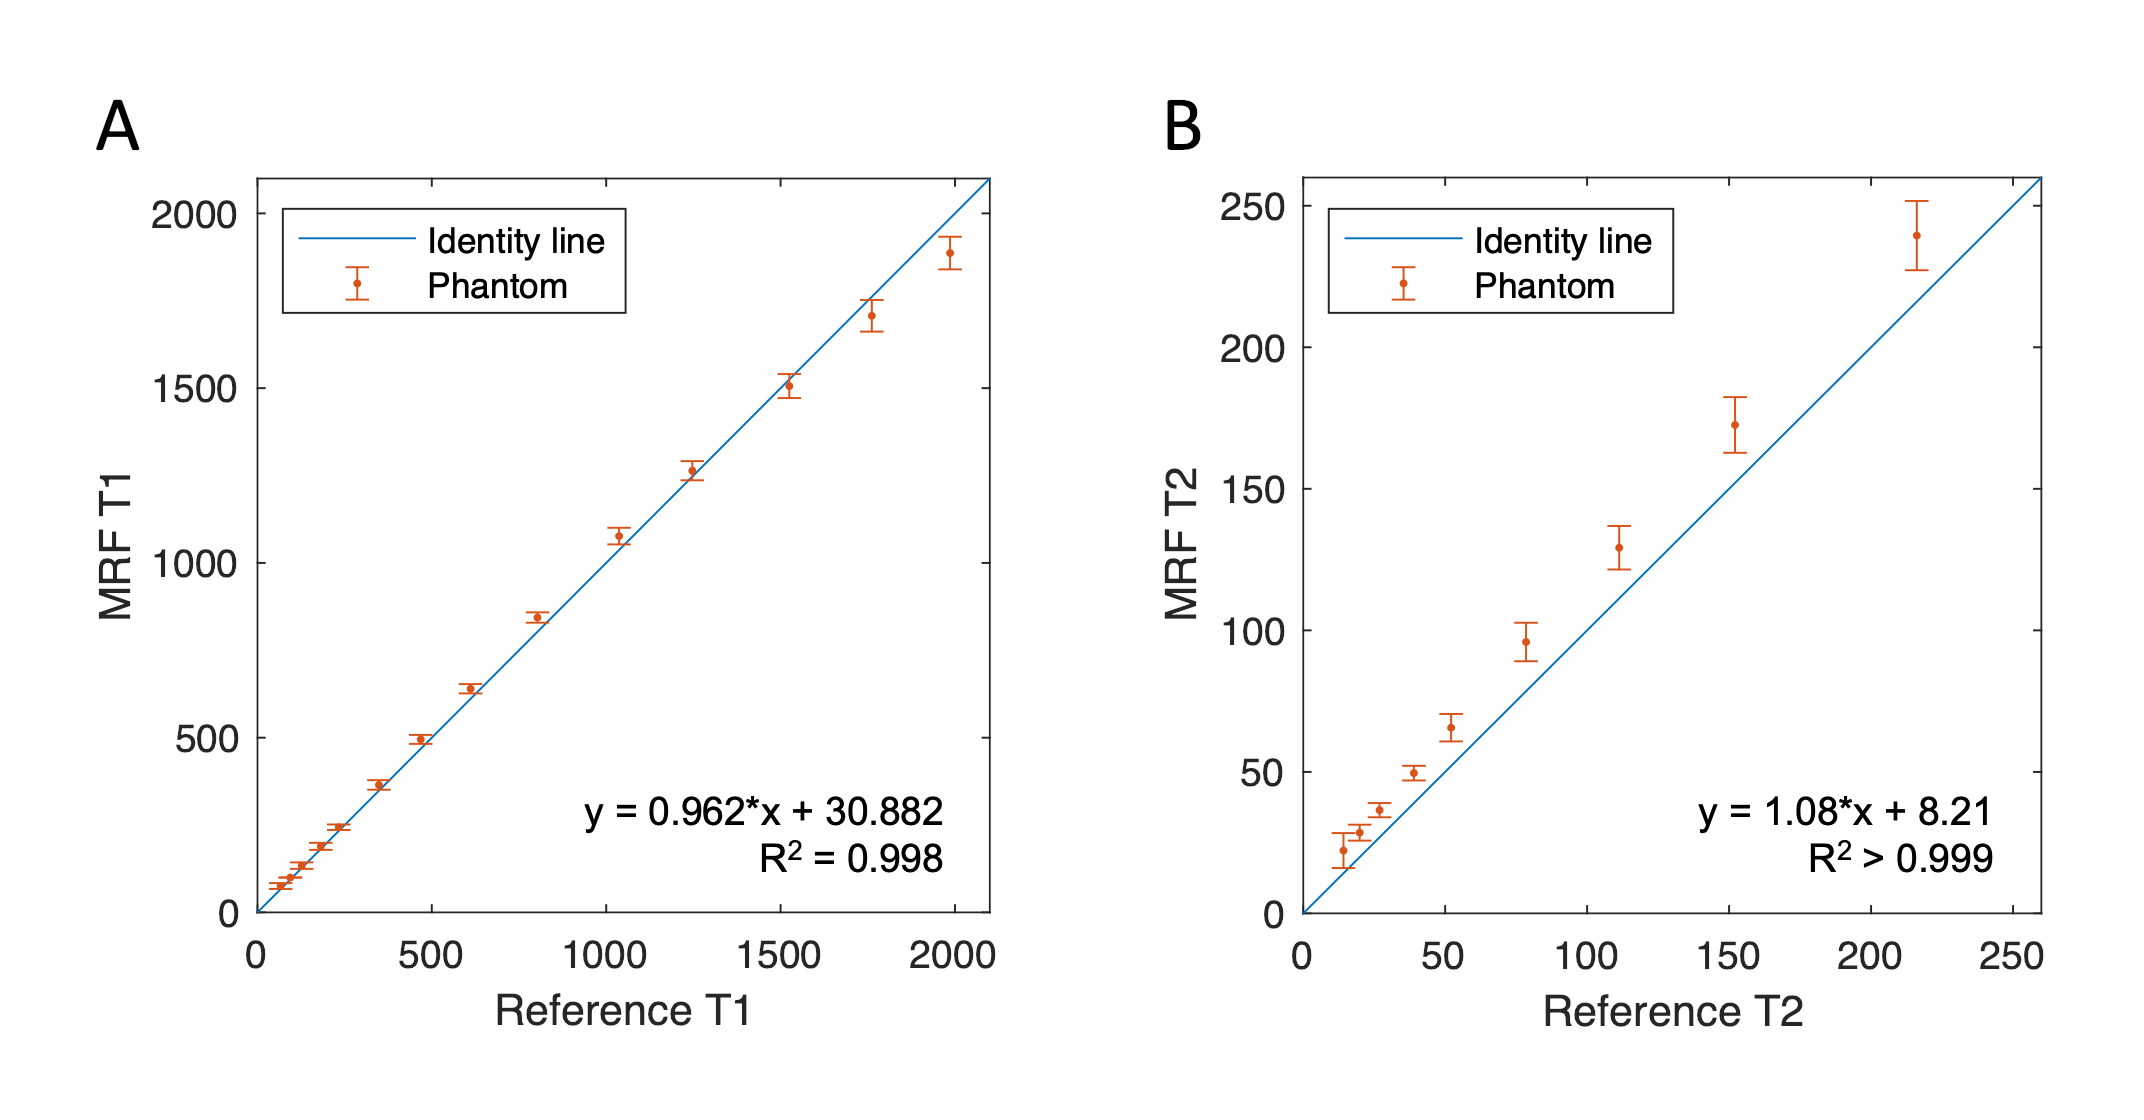
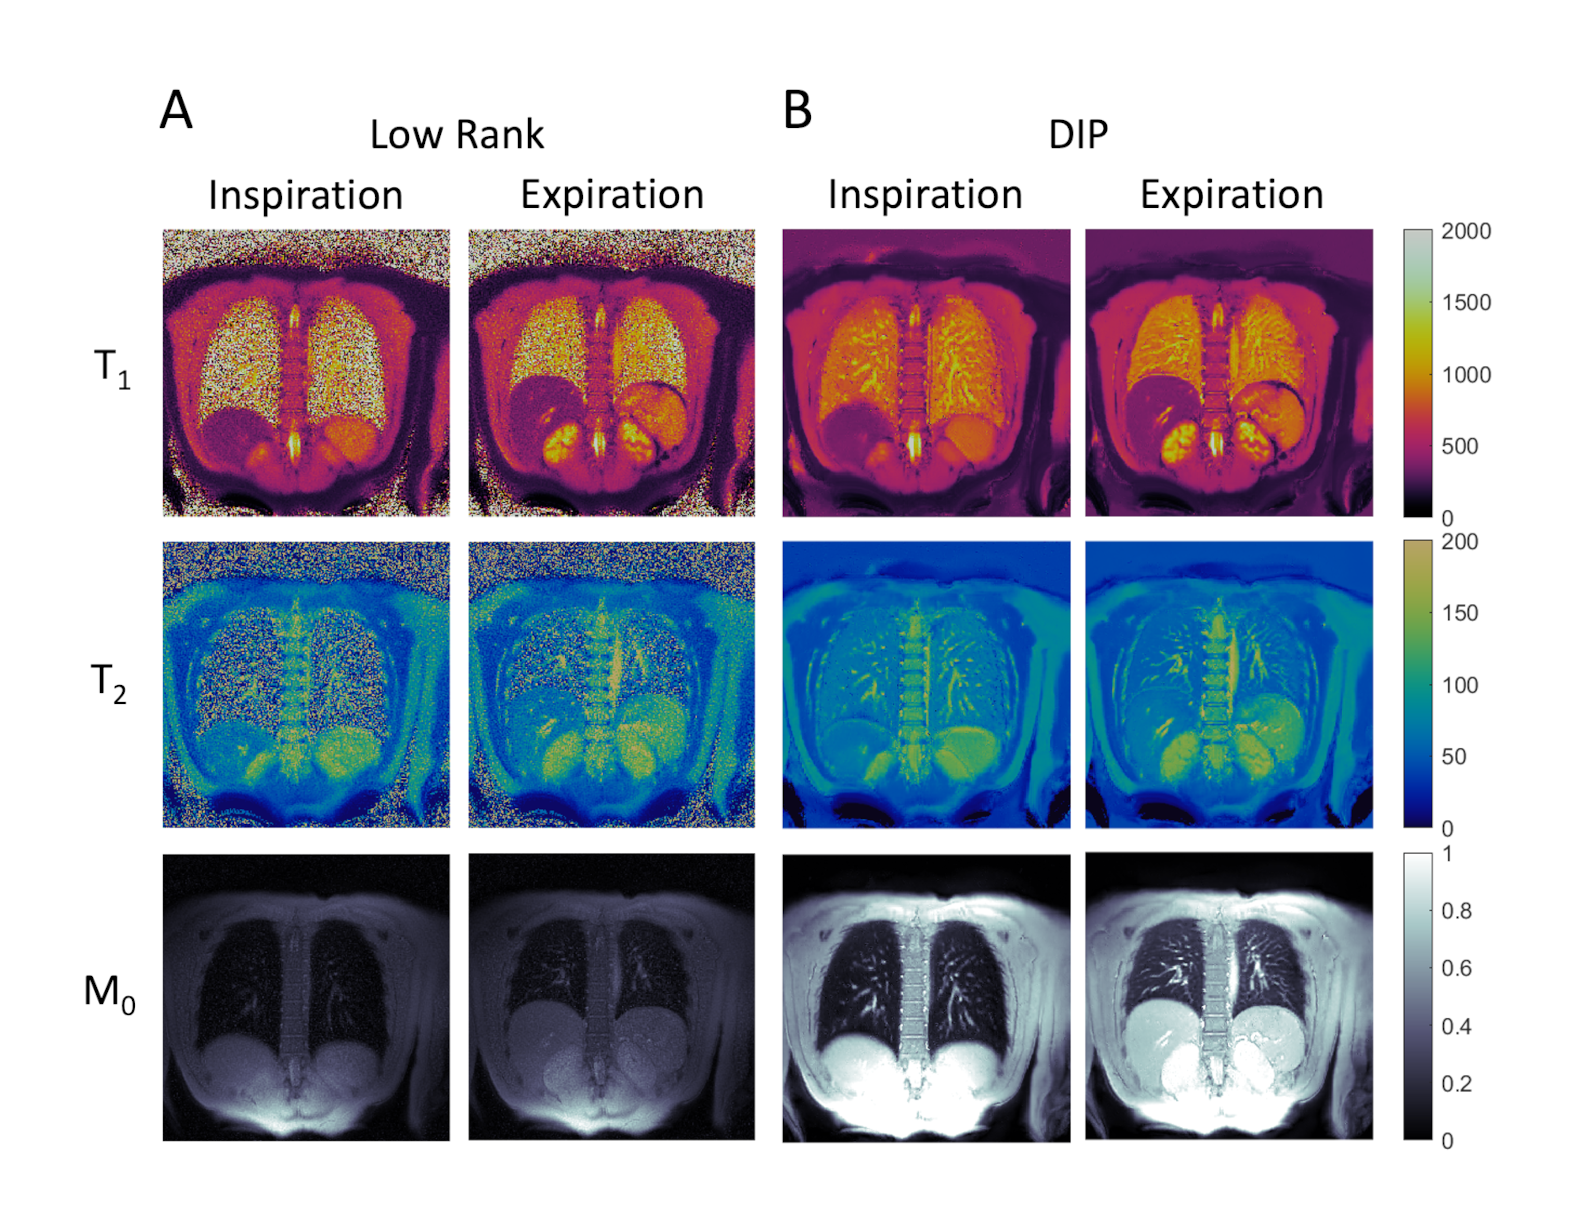
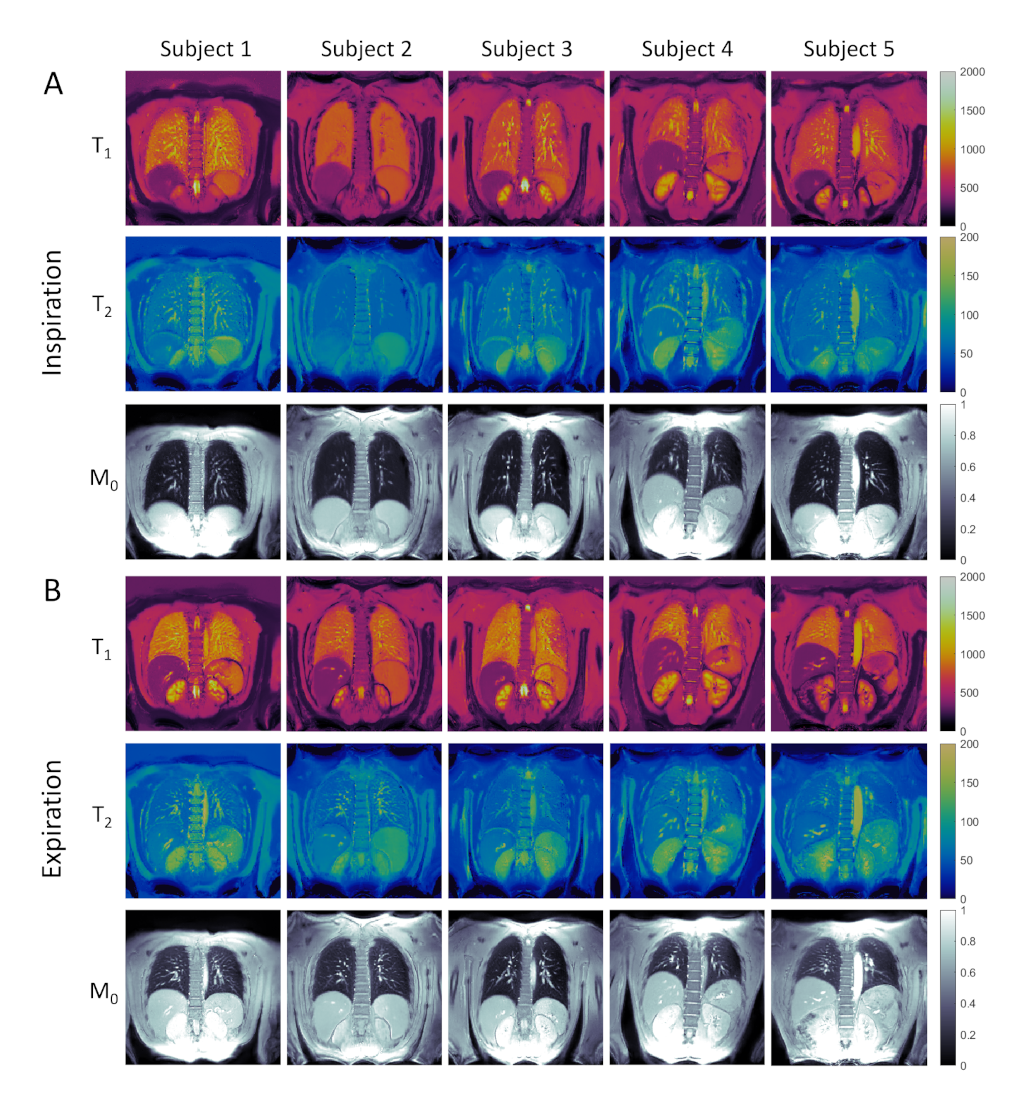
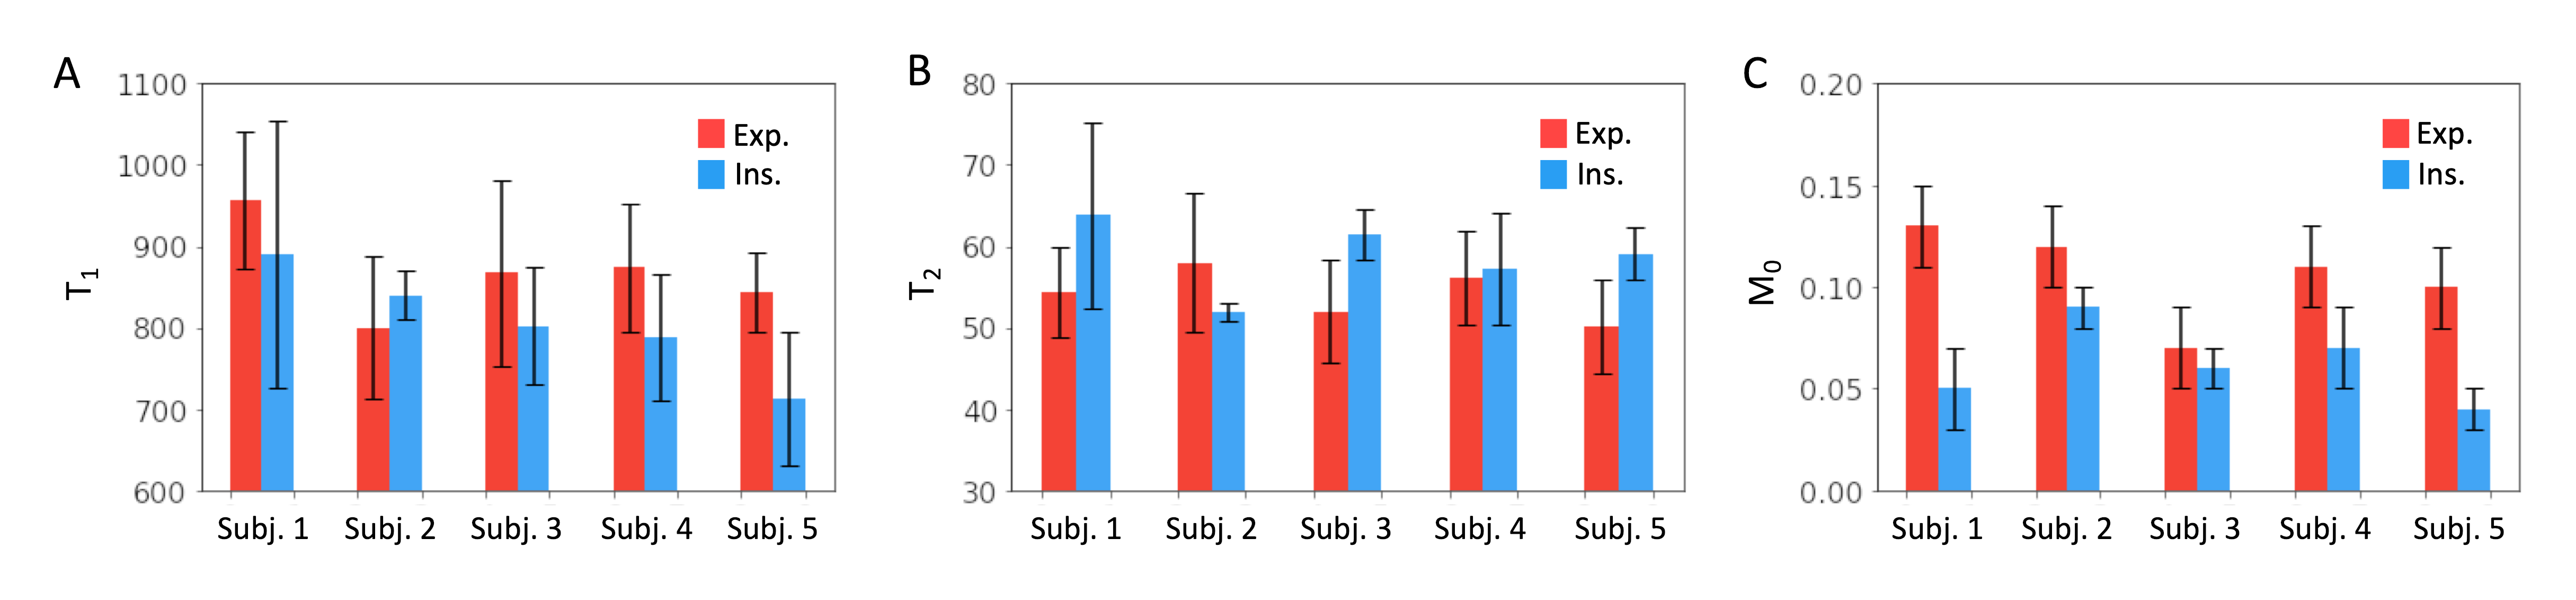
Good agreement was observed in the phantom between MRF and reference values (R2=0.998 for T1 and R2>0.999 for T2), with a slight overestimation in T2 (Figure 2). Figure 3 shows MRF T1, T2, and M0 maps from one representative subject. The LR reconstruction suffered from severe noise enhancement, whereas DIP yielded improved suppression of noise and delineation of fine anatomical structures, including parenchyma and blood vessels. Figure 4 presents DIP MRF maps from all five subjects in end-expiration and end-inspiration, with quantitative results summarized in Figure 5. Average T1 values over all subjects were 868±57ms (expiration) and 806±59ms (inspiration). Average values for T2 were 54.1±3.2ms (expiration) and 58.7±4.0ms (inspiration).Discussion
This study demonstrated the feasibility of performing simultaneous T1, T2, and M0 mapping of the lungs using MRF during a single breathhold on a commercial 0.55T scanner. A deep image prior reconstruction was found to be crucial for countering the inherently low SNR at 0.55T. MRF T1 times were slightly lower than 0.55T values in the lungs reported by Campbell-Washburn et al.,3 who found T1 971±62ms and T2 61±11ms, while MRF T2 values were in agreement. Lower T1 and slightly higher T2 values were observed in inspiration compared to expiration using MRF, consistent with prior T1 mapping studies.9 An advantage of imaging at 0.55T is the increased T2* values, which enables improved sampling with less signal decay in the lungs compared to 1.5T, in addition to the improved field homogeneity, lower specific absorption rate, and reduced susceptibility effects. Future work will involve optimization of the MRF sequence and spiral readout to improve SNR efficiency and validation in additional subjects, including patients with pulmonary disease.Acknowledgements
Siemens Healthineers; NIH/NHLBI R01HL163030, R01HL153034, and R01HL163991References
1. Gai ND, Malayeri AA, Bluemke DA. Three‐dimensional T1 and T2* mapping of human lung parenchyma using interleaved saturation recovery with dual echo ultrashort echo time imaging (ITSR‐DUTE). J Magn Reson Imaging. 2017;45(4):1097-1104. doi:10.1002/jmri.25487
2. Dietrich O, Gaass T, Reiser MF. T1 relaxation time constants, influence of oxygen, and the oxygen transfer function of the human lung at 1.5 T—A meta-analysis. Eur J Radiol. 2017;86:252-260. doi:10.1016/j.ejrad.2016.11.027
3. Campbell-Washburn AE, Ramasawmy R, Restivo MC, et al. Opportunities in interventional and diagnostic imaging by using high-performance low-field-strength MRI. Radiology. 2019;293(2):384-393. doi:10.1148/radiol.2019190452
4. Hamilton JI, Jiang Y, Chen Y, et al. MR fingerprinting for rapid quantification of myocardial T1, T2, and proton spin density. Magn Reson Med. 2017;77(4):1446-1458. doi:10.1002/mrm.26216
5. Jiang Y, Ma D, Seiberlich N, Gulani V, Griswold MA. MR fingerprinting using fast imaging with steady state precession (FISP) with spiral readout. Magn Reson Med. 2015;74(6):1621-1631. doi:10.1002/mrm.25559
6. Lima da Cruz G, Bustin A, Jaubert O, Schneider T, Botnar RM, Prieto C. Sparsity and locally low rank regularization for MR fingerprinting. Magn Reson Med. 2019;81(6):3530-3543. doi:10.1002/mrm.27665
7. Hamilton JI. A self-supervised deep learning reconstruction for shortening the breathhold and acquisition window in cardiac magnetic resonance fingerprinting. Front Cardiovasc Med. 2022;9:928546. doi:10.3389/fcvm.2022.928546
8. Keenan KE, Stupic KF, Boss MA, et al. Comparison of T1 measurement using ISMRM/NIST system phantom. Proc ISMRM 24th Annual Meeting, #3290. 2016.
9. Stadler A, Jakob PM, Griswold M, Barth M, Bankier AA. T1 mapping of the entire lung parenchyma: influence of the respiratory phase in healthy individuals. J Magn Reson Imaging. 2005;21(6):759-764. doi:10.1002/jmri.20319
Figures