2674
Rapid Free-Breathing 3D MRI of the Liver for Simultaneous Quantification of PDFF, R2*, and Water-Specific T1 at 0.55 Tesla1Bernard and Irene Schwartz Center for Biomedical Imaging, Department of Radiology, New York University Grossman School of Medicine, New York, NY, United States, 2Center for Advanced Imaging Innovation and Research (CAI2R), Department of Radiology, New York University Grossman School of Medicine, New York, NY, United States, 3Department of Radiology, Northwestern University School of Medicine, Chicago, IL, United States, 4Department of Radiology, Stanford University School of Medicine, Palo Alto, CA, United States, 5Biomedical Engineering and Imaging Institute, Icahn School of Medicine at Mount Sinai, New York, NY, United States, 6Department of Radiology and Biomedical Imaging, University of California, San Francisco, San Francisco, CA, United States
Synopsis
Keywords: Low-Field MRI, Low-Field MRI
Motivation: 0.55T MRI may be a promising platform for quantitative multiparametric liver imaging with improved cost-effectiveness and robustness.
Goal(s): This study demonstrates the feasibility of rapid free-breathing 3D MRI of the liver with simultaneous quantification of PDFF, R2*, and water-specific T1 at 0.55 Tesla.
Approach: We tested free-breathing GraspT1-Dixon sequence with in vivo experiment and the quantitative maps are validated using R2* and PDFF phantoms.
Results: We show that (1)the estimated parameters are accurate; (2)the influence of fat on liver T1 mapping can be effectively mitigated to ensure accurate and robust T1 quantification; and (3)R2* mapping may be insensitive to respiratory motion at 0.55T.
Impact: 0.55T MRI offers a cost-effective platform for quantitative multiparametric MRI of the liver to improve the management of various chronic disease conditions. In particular, the improved magnetic field homogeneity at 0.55T may enable more robust estimation of R2* maps.
Introduction
Quantitative MRI holds great promise in improving the identification and characterization of chronic liver diseases. MRI-derived biomarkers such as proton density fat fraction (PDFF) and T2* (or R2*) have been well established for quantitative assessment of liver fat and iron depositionp[1,2]. T1 relaxation is another MRI parameter that may offer value as biomarker for inflammation and fibrosis[3]. Recent studies have shown that water-specific T1 mapping may enable more accurate T1 estimation in the liver[4–8]. The purpose of this work was to develop and test a rapid free-breathing 3D MRI technique for simultaneous quantification of PDFF, R2*, and water-specific T1 of the liver in ~5 minutes at 0.55 Tesla.Methods
Rapid Free-Breathing 3D Quantitative MRIThe proposed technique, called GraspT1-Dixon, employs an inversion-recovery (IR)-prepared 3D golden-angle stack-of-stars sequence with advanced iterative reconstruction that enforces combined low-rank subspace and spatiotemporal sparsity constraints8–10. During data collection, the IR preparation is periodically applied, followed by multi-echo acquisition to achieve fat/water separation at different inversion times (TIs). This enables simultaneous estimation of the PDFF, R2*, and water-specific T1 relaxation in a single scan.
Phantom Experiments
Phantom studies were performed on a clinical 0.55T MRI scanner (MAGNETOM Free.Max, Siemens Healthineers) for validating the R2* and PDFF estimation using a commercial fat-free R2* phantom (FerriScan Phantom Pack) and a commercial fat/water-mixed phantom (Calimetrix, Madison, WI). Imaging parameters for GraspT1-Dixon were as follows: FOV=380x380, matrix size=192x192, slice thickness=6mm, number of slices=16, number of echoes=6, TR/TE1/ΔTE/TE6=14.7/1.96/2.15/12.7ms, flip angle=5°, number of IR preparations=40, and total acquisition time (TA)=5:12 min.
For comparison, two regular multi-echo stack-of-stars acquisitions without IR preparation were performed. The first scan used identical imaging parameters to GraspT1-Dixon, resulting in a shorter scan time of 3:34 min. The second scan used larger echo spacing with TR/TE1/ΔTE/TE6=32/2/5.6/30ms and TA=7:46 min.
In-Vivo Experiments
In-vivo data were collected from three human subjects: one dataset using a 0.55T Free.Max system, and another dataset using a prototypic 0.55T system (ramped-down MAGNETOM Aera, Siemens Healthineers). Imaging parameters for GraspT1-Dixon scans were kept consistent with the phantom experiments, except for a shorter TR (14ms) and TA (5:00 min). In addition, non-IR multi-echo stack-of-stars scans were performed using the same imaging parameters as GraspT1-Dixon, with periodically inserted 2D navigators to enable motion compensation. All data were acquired during free breathing.
Image Reconstruction and Parameter Estimation
All GraspT1-Dixon datasets were reconstructed as previously described[8]. Both R2* and PDFF maps were generated from data acquired at later TIs to minimize IR-induced signal variation. Water-specific T1 values were estimated from water-only images reconstructed at different TIs. Non-IR multi-echo datasets from human subjects were reconstructed in two ways: once without motion compensation and once with motion-resolved reconstruction[11].For the fat-free R2* phantom data, R2* maps were estimated from magnitude images using nonlinear least-squares fitting. For the PDFF phantom and in-vivo studies, both R2* and PDFF maps were first generated using the graph-cut algorithm[12]. Subsequently, the resulting magnetic field map was used to separate water and fat images at each TI using a custom-developed fat/water-separation algorithm[13].
Results
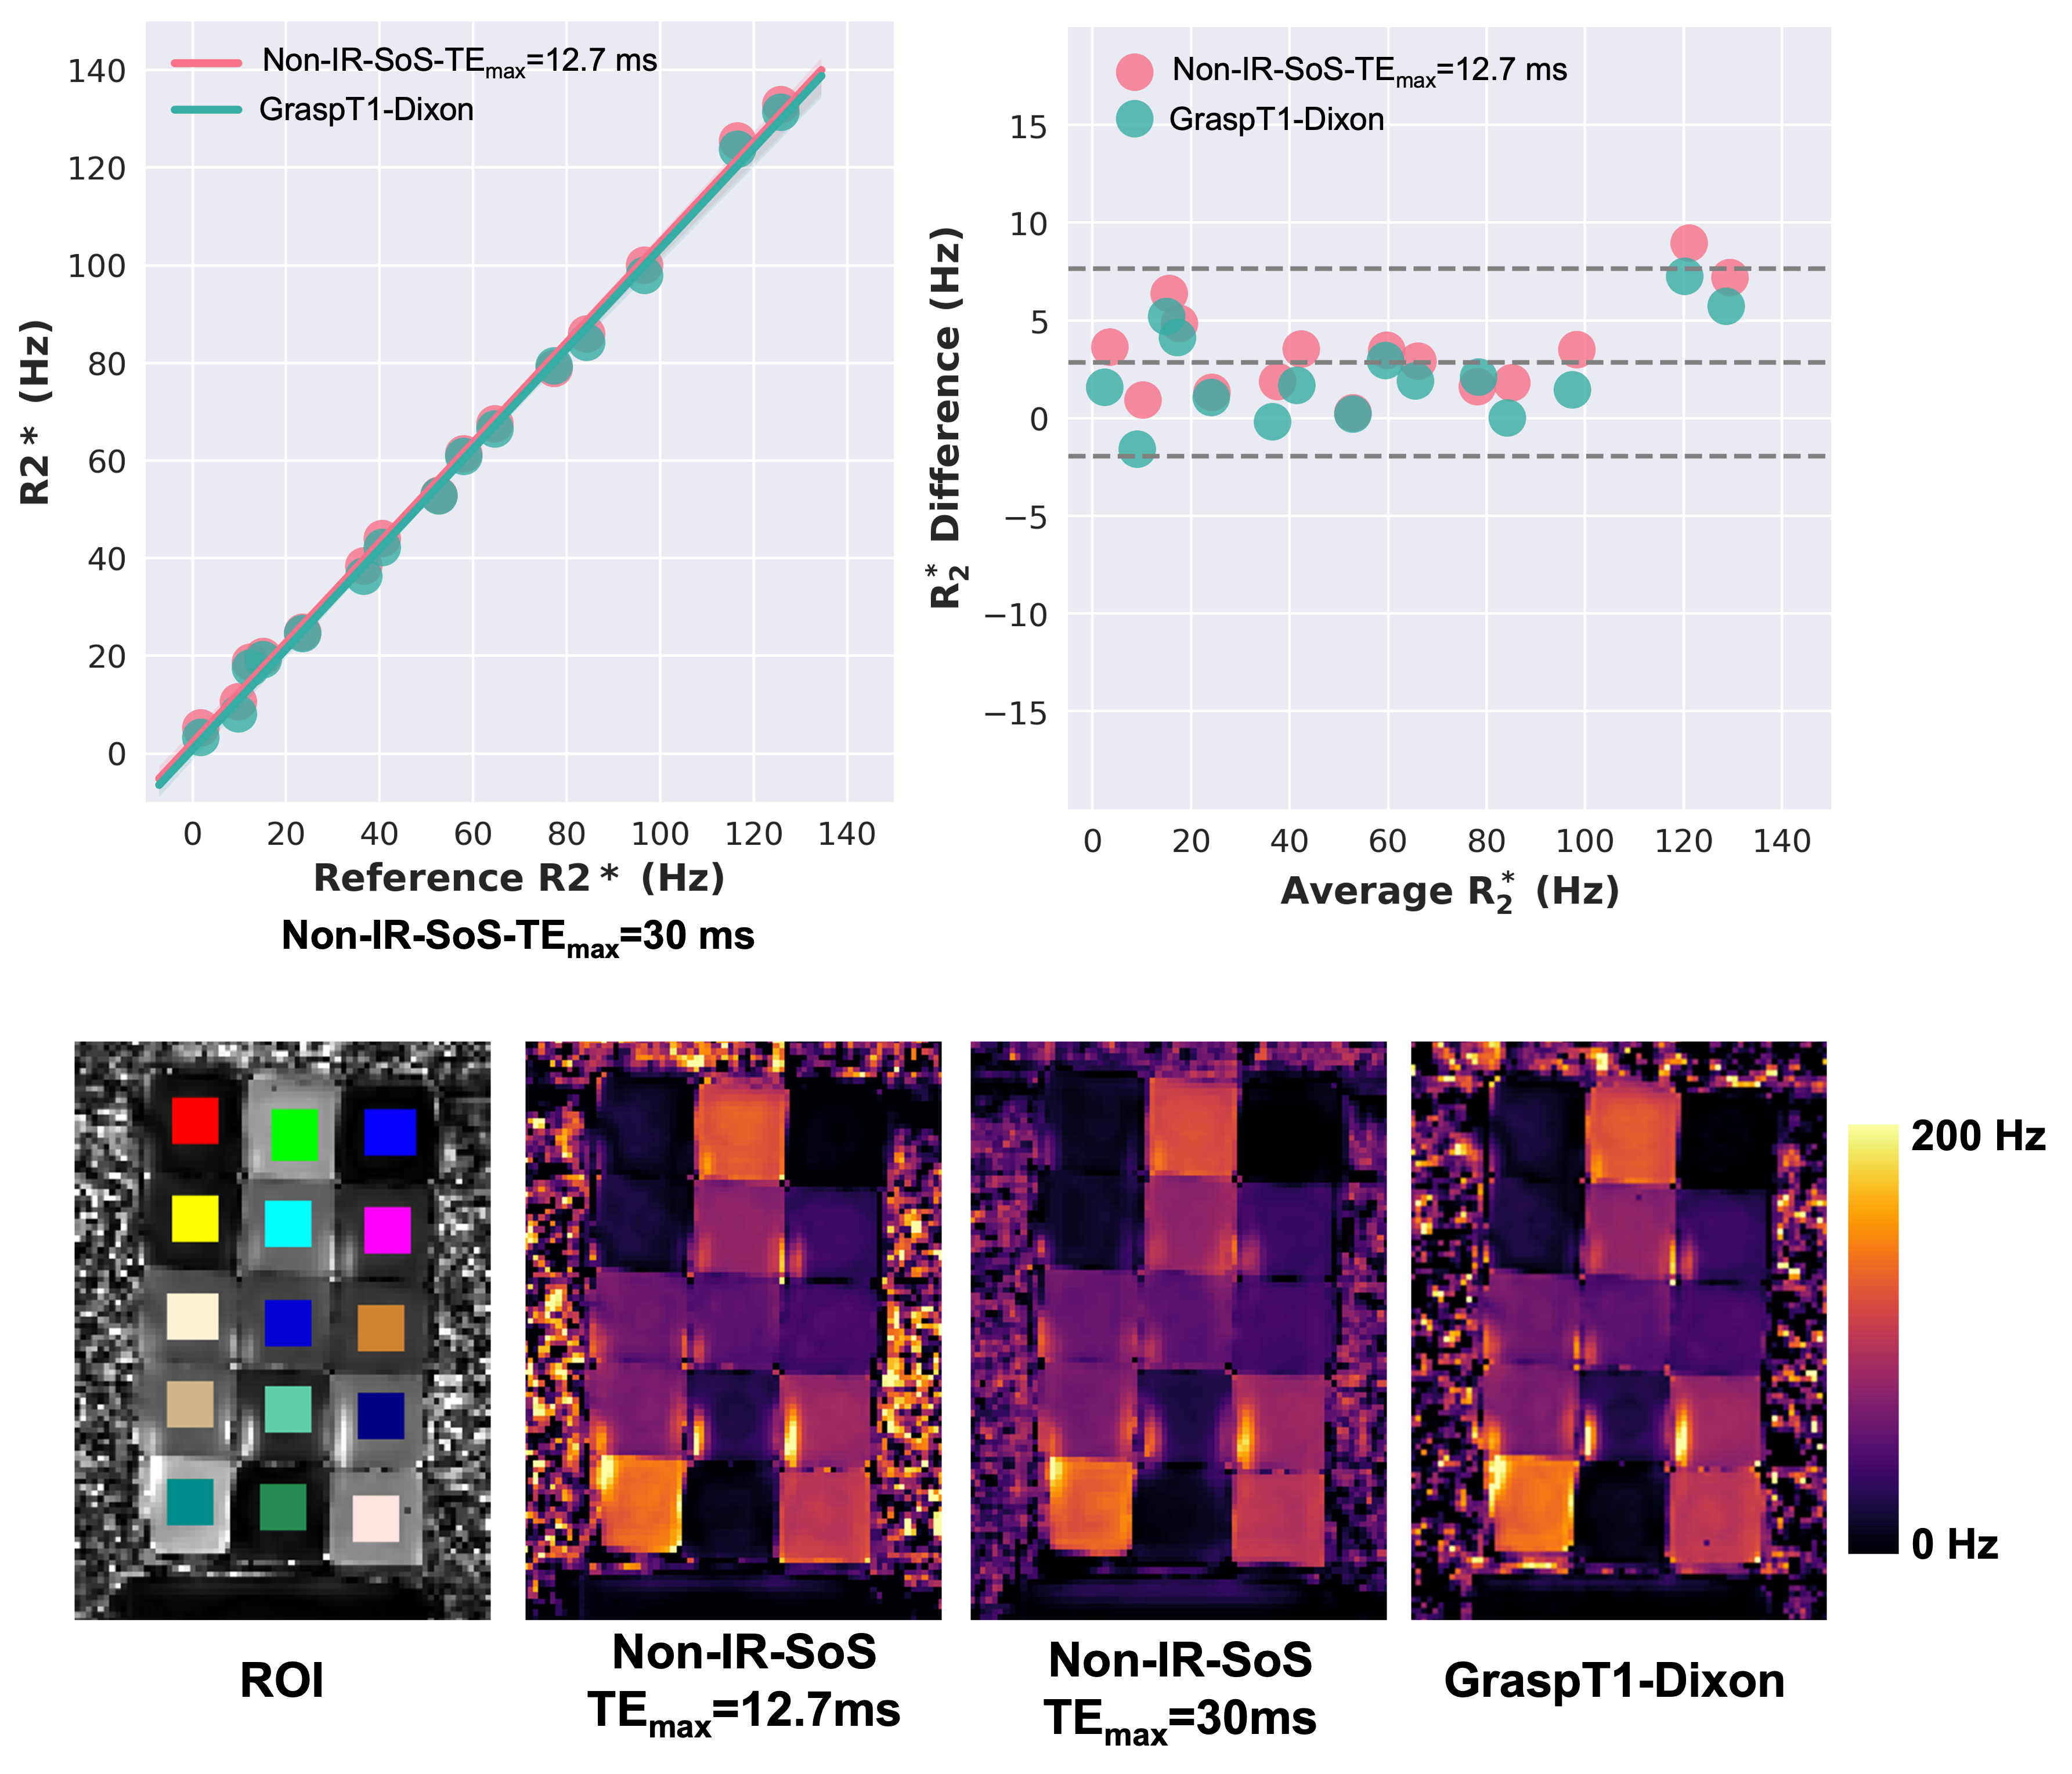
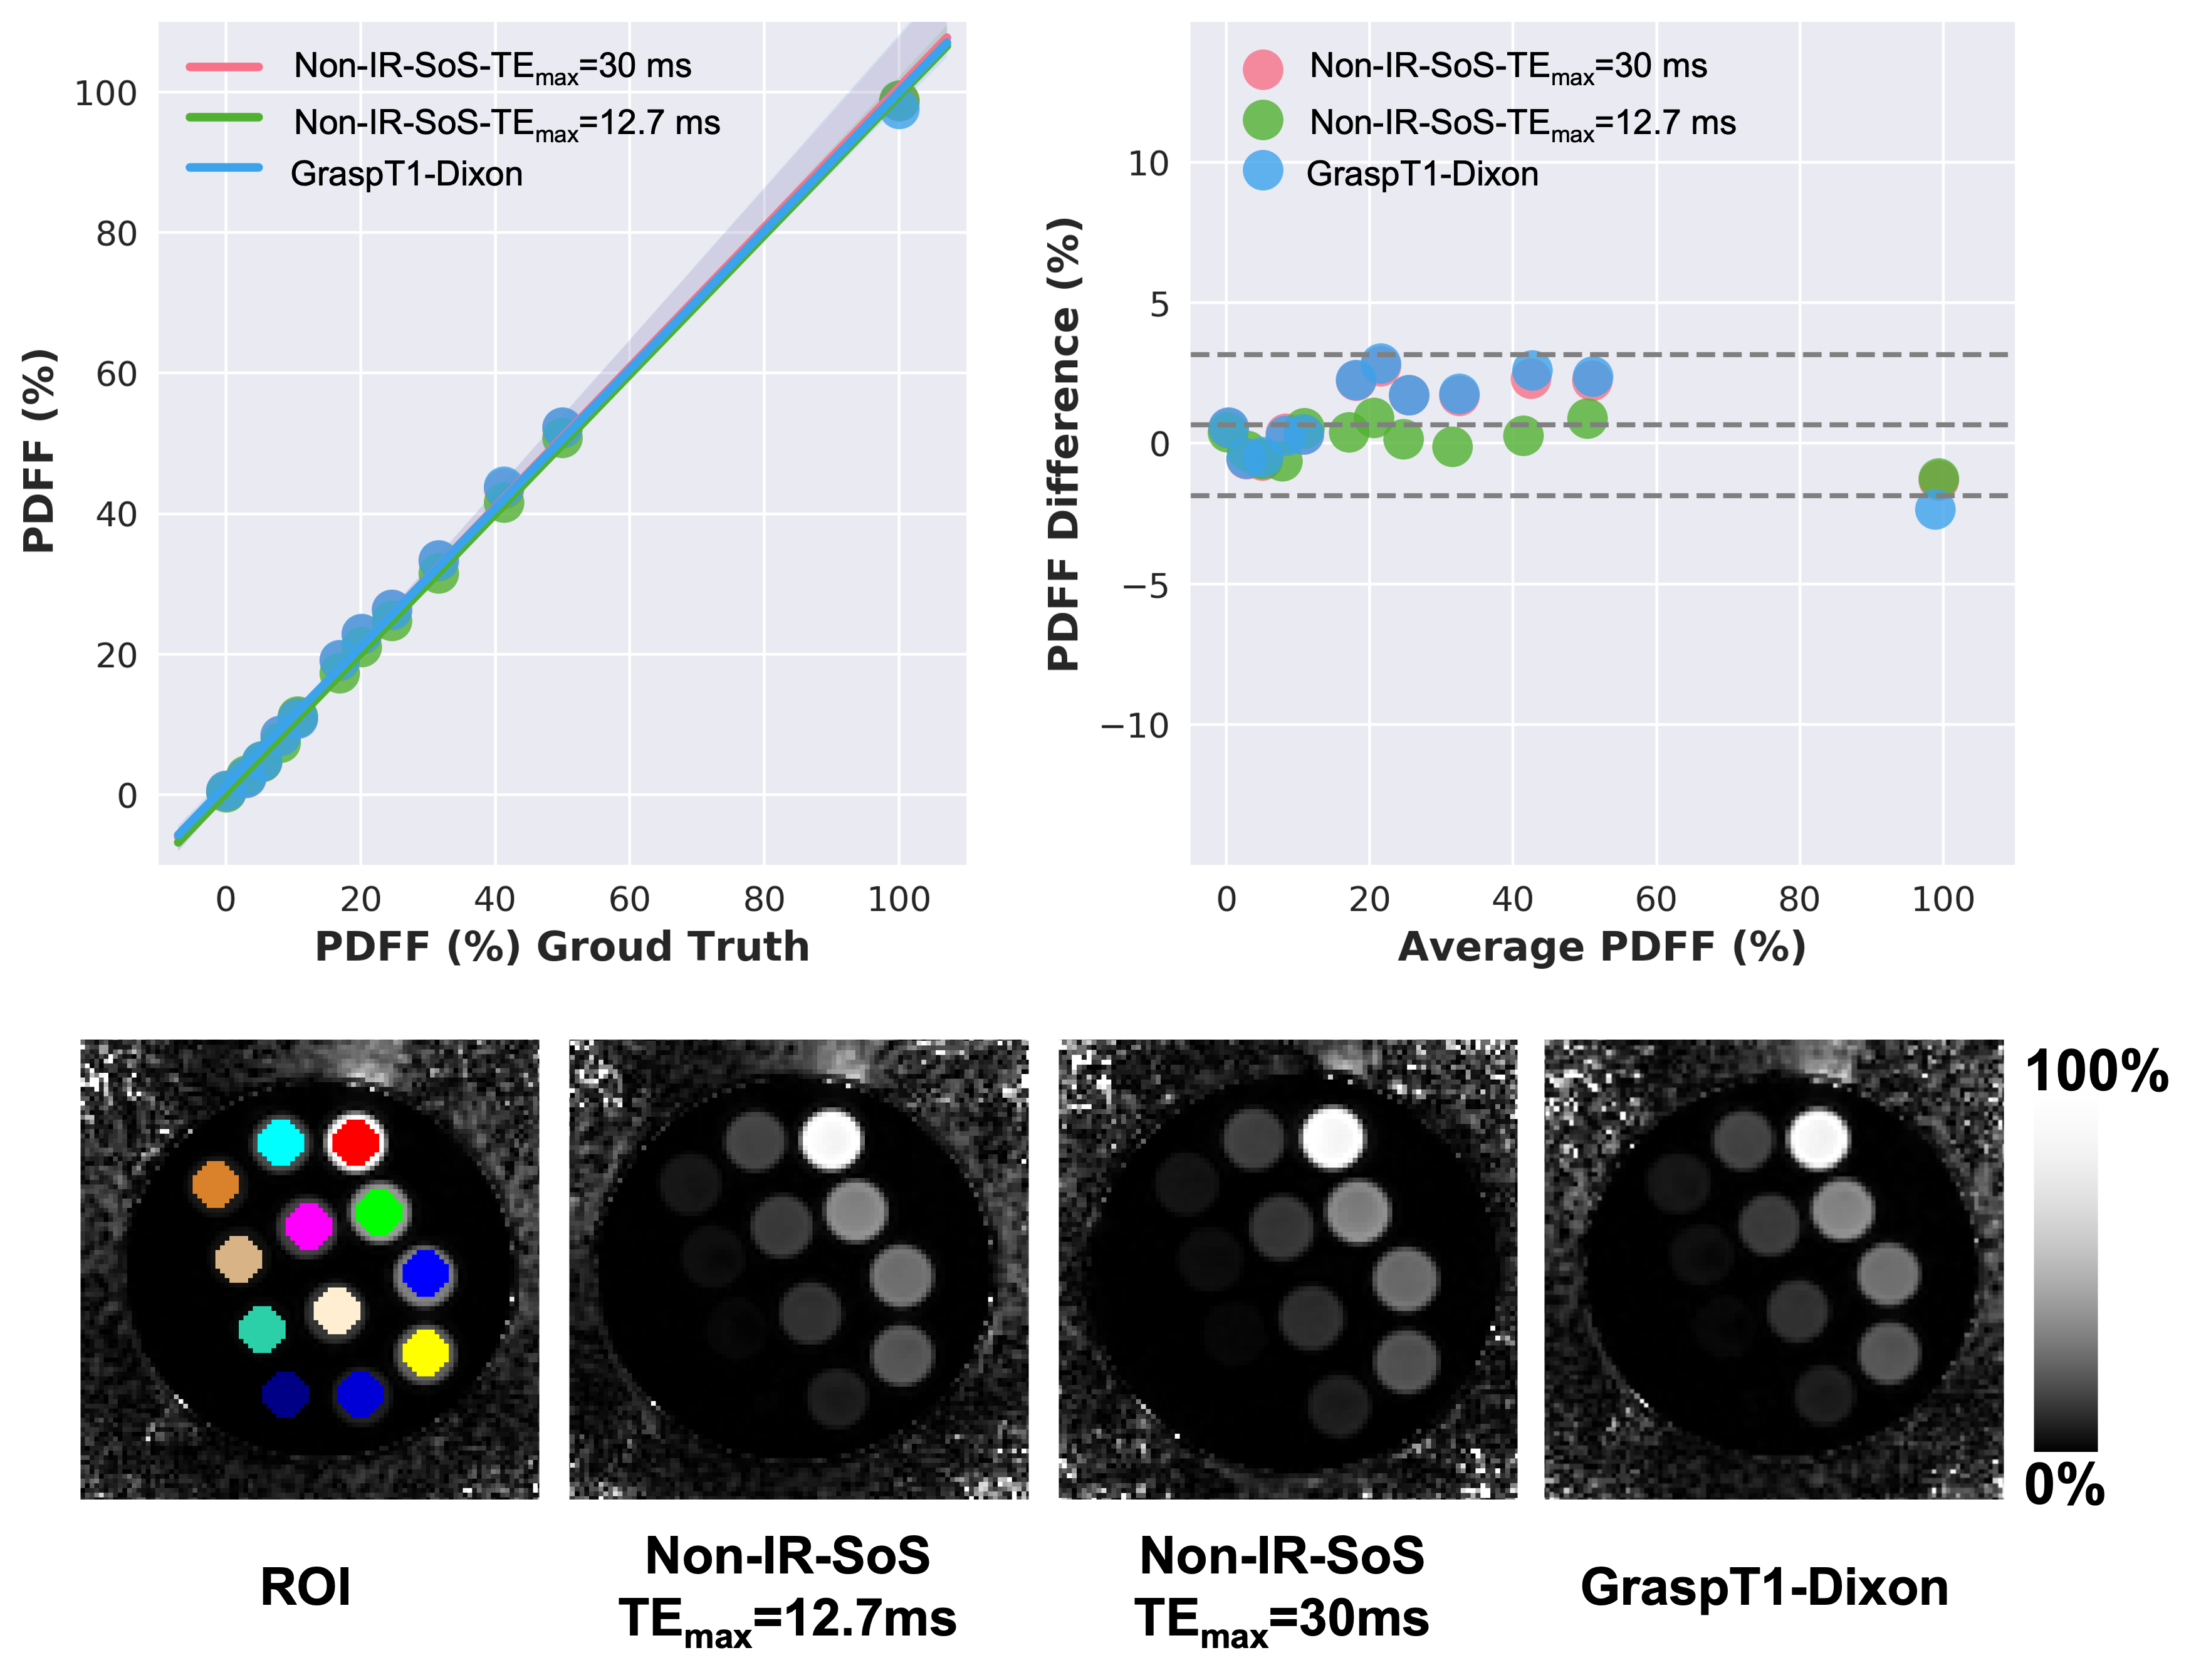
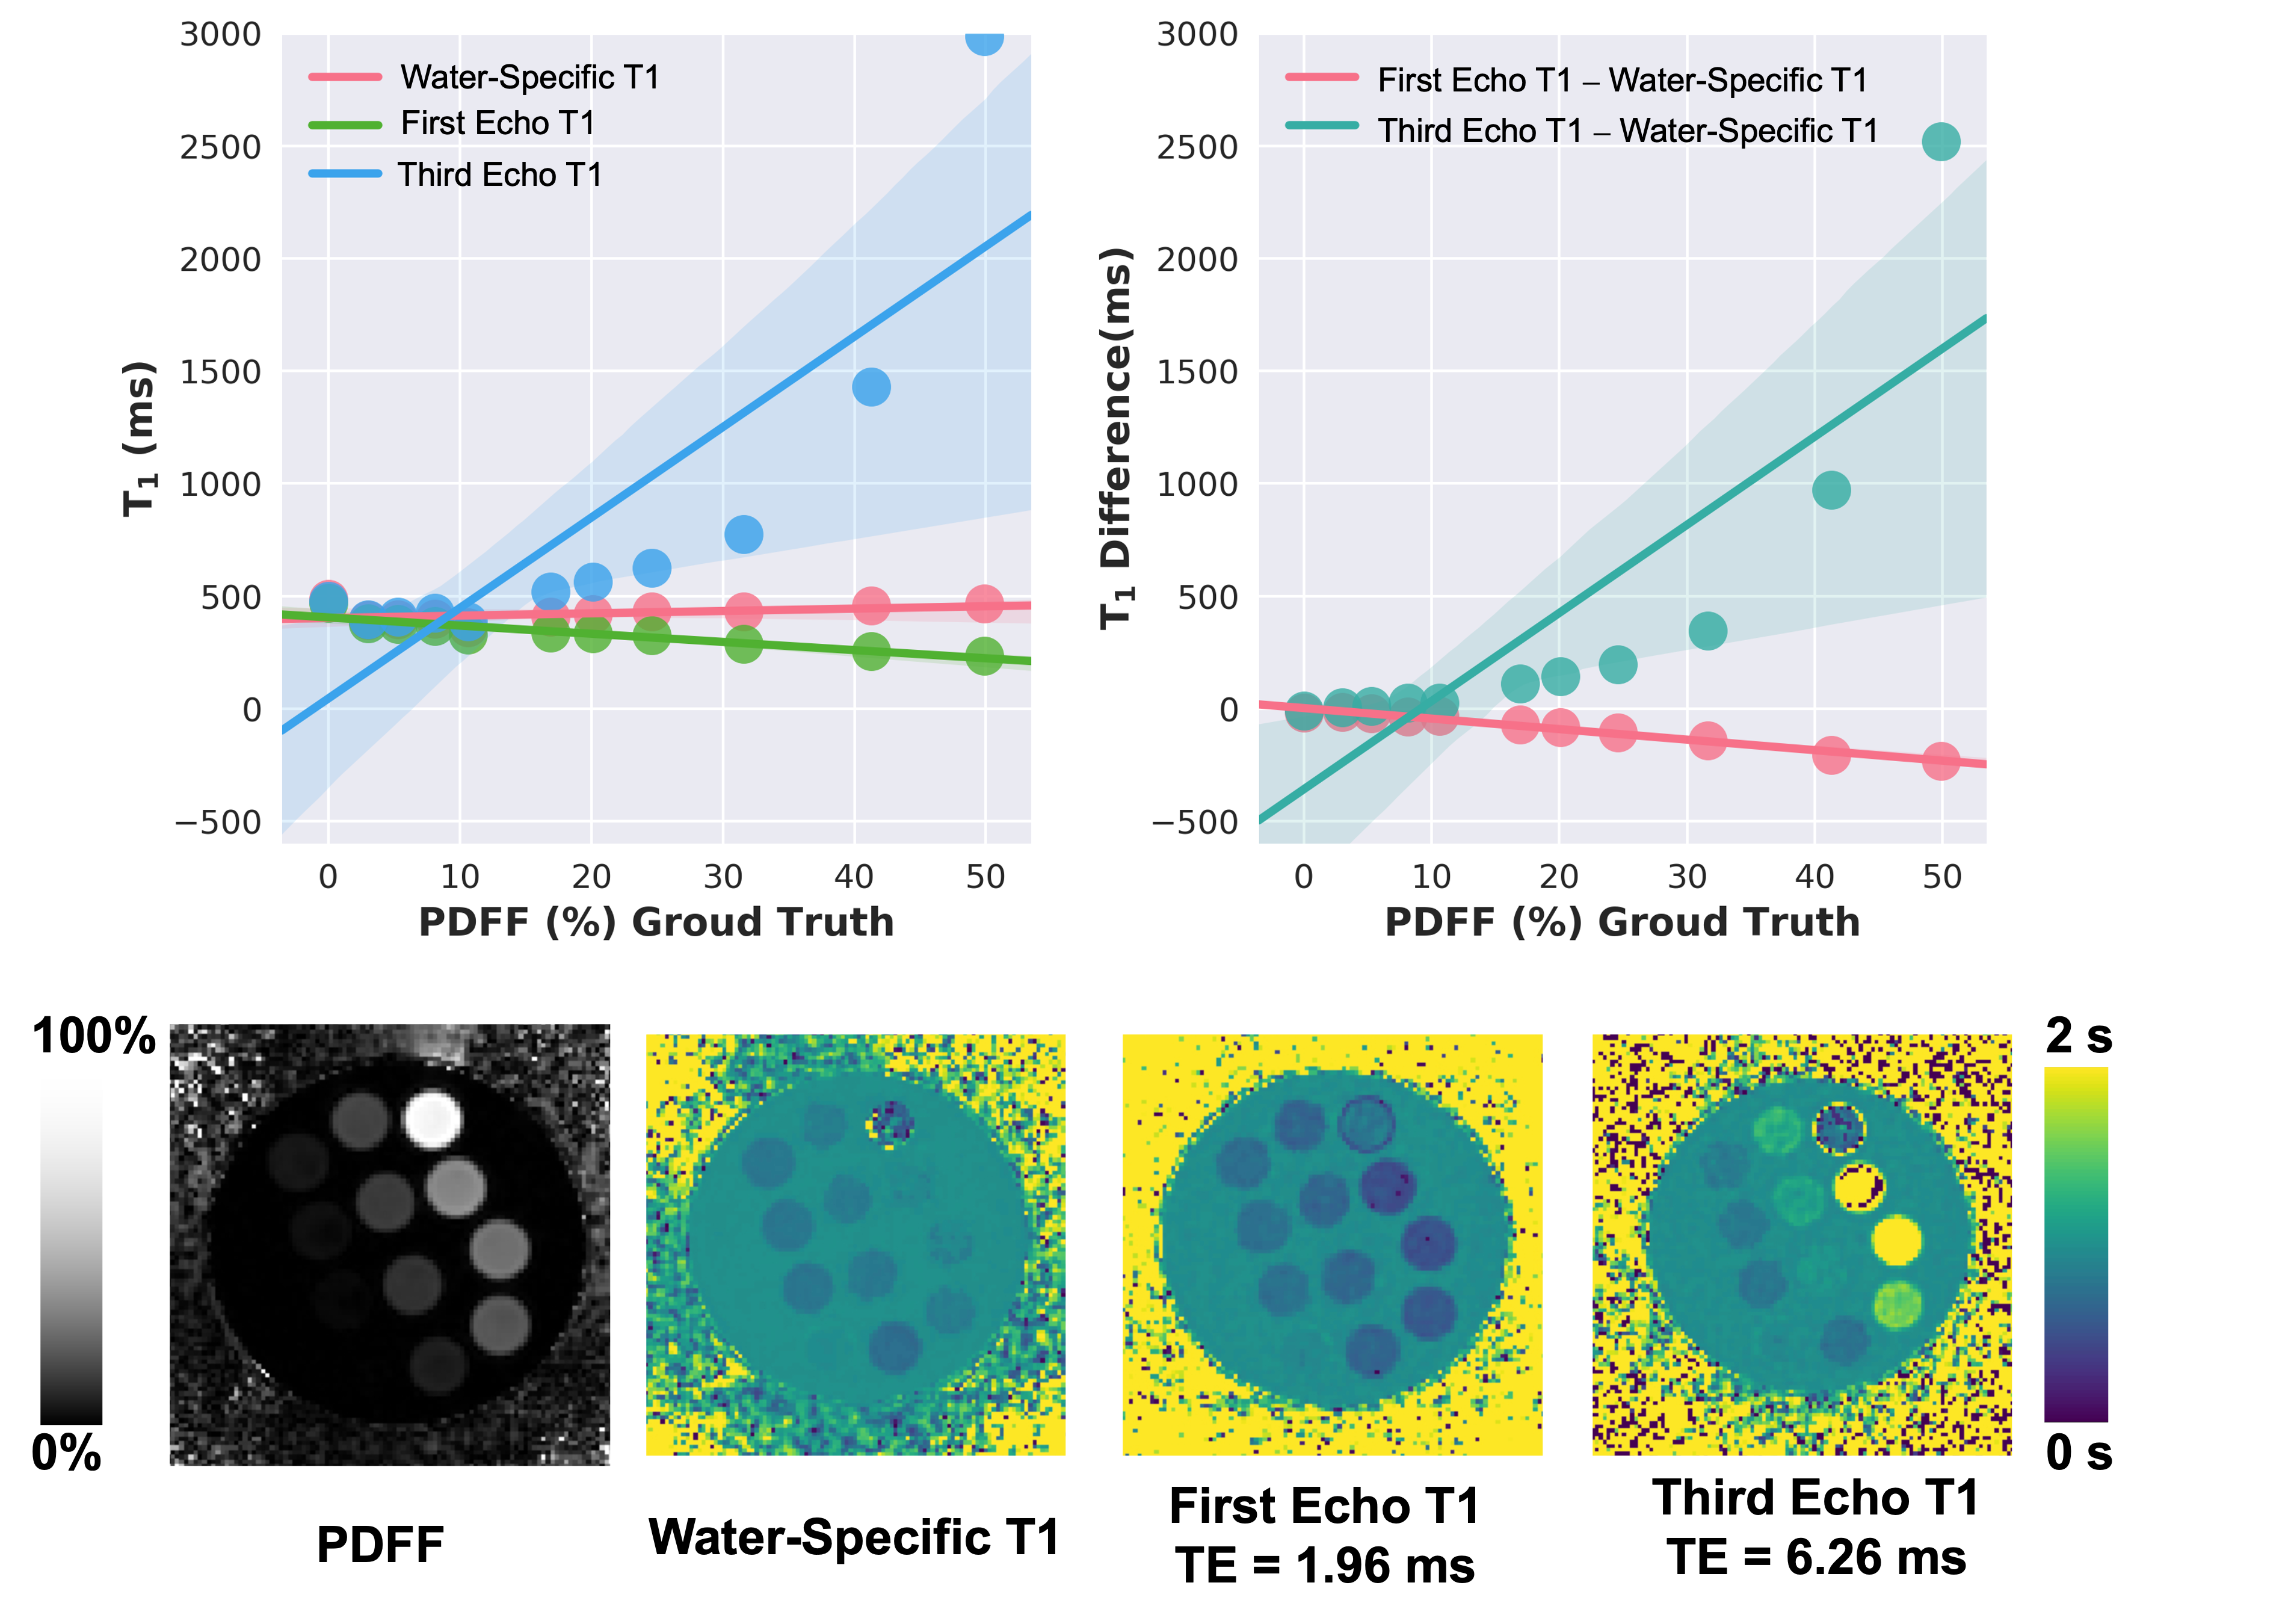
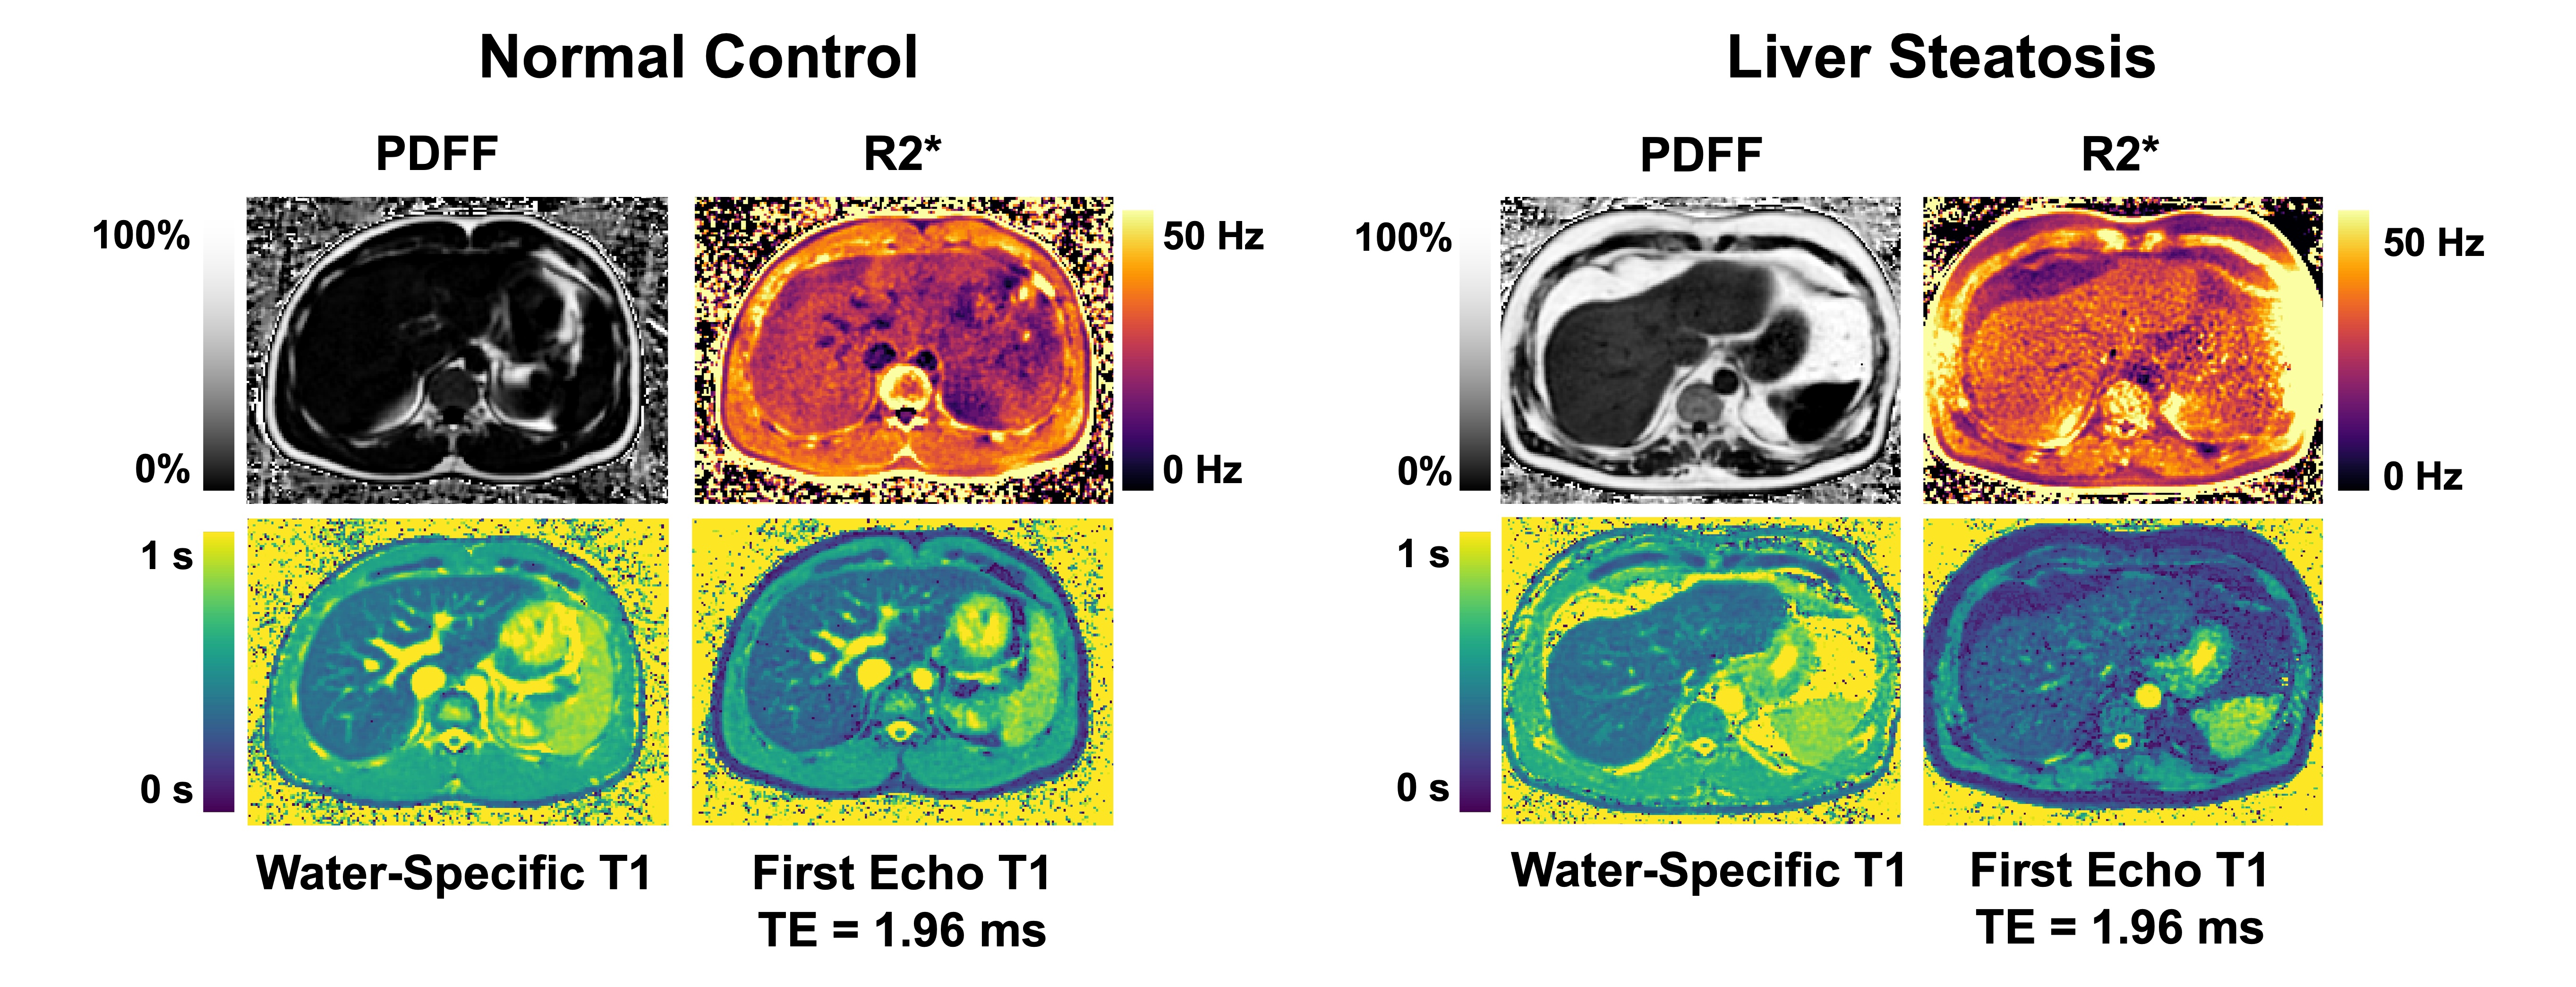
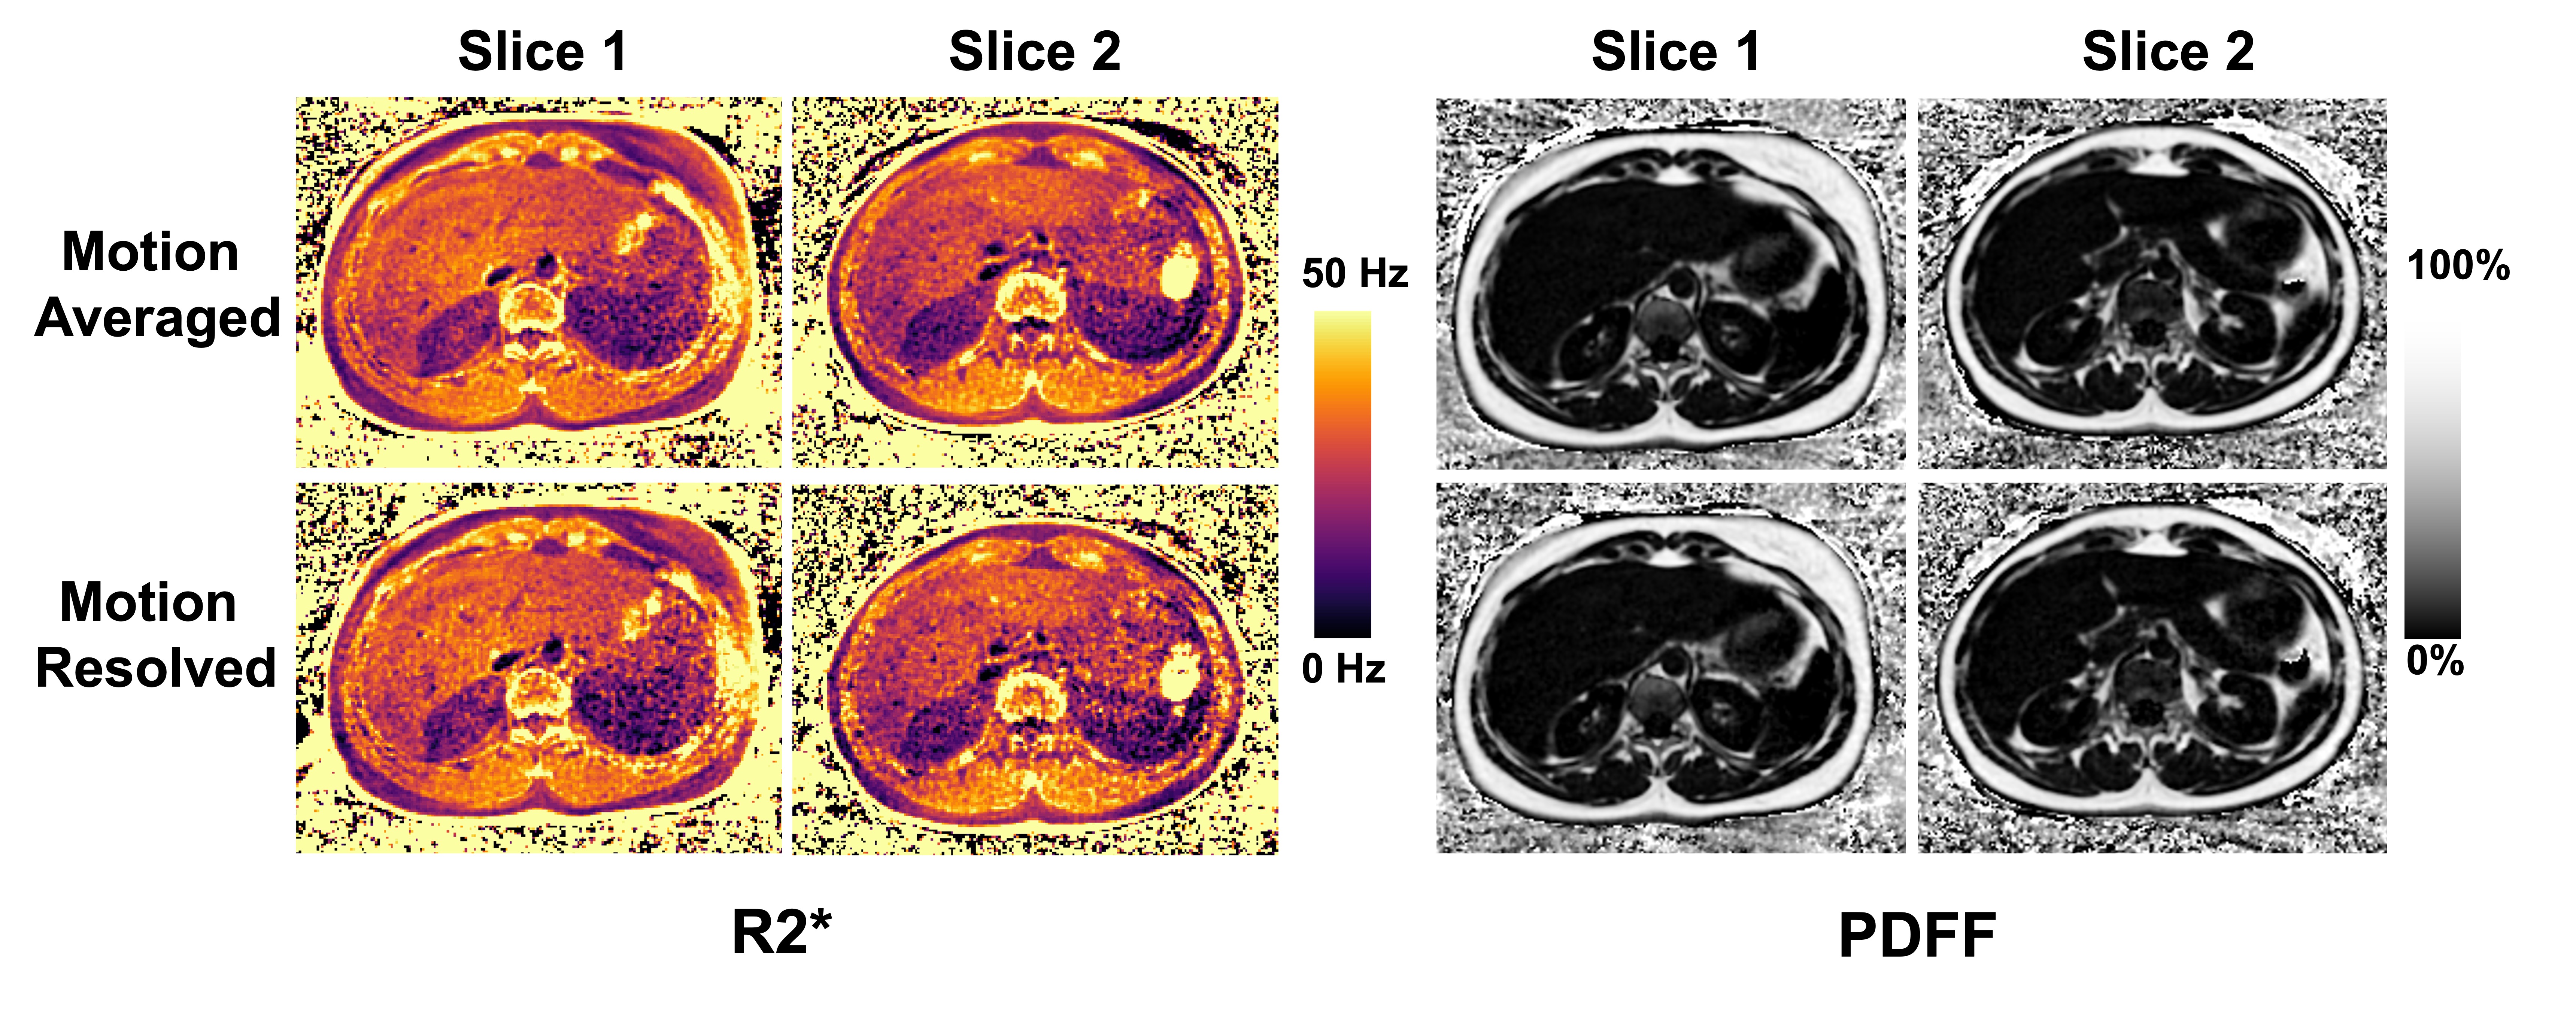
Figure 1 and Figure 2 show results from the phantom experiments, which confirm the accuracy of R2* and PDFF quantification and indicate that changes of the echo spacing do not impact the parameter estimation. In Figure 3, different phantom T1 maps are compared, highlighting the bias induced by fat in the T1 quantification. Specifically, T1 maps generated from the first echo (close to fat/water in-phase condition) underestimate T1, while T1 maps generated from the third echo (close to fat/water opposite-phase condition) overestimate T1.Figure 4 shows parameter maps estimated in two human subjects: a normal control and a subject with elevated liver fat content. Water-specific T1 maps exhibit superior quality compared to fat/water-mixed T1 maps. In Figure 5, motion-averaged PDFF and R2* maps are compared with motion-resolved counterparts, suggesting that respiratory motion may not significantly impact parameter quantification.
Discussion
This study demonstrates rapid free-breathing 3D liver MRI with simultaneous estimation of PDFF, R2*, and water-specific T1 at 0.55T in phantom and in-vivo scans. Our results indicate that the selection of TE has minimal impact on both the PDFF and R2* estimation. While previous studies have shown that R2* mapping can be sensitive to respiratory motion at 3T[14], our results indicate that motion has reduced influence on R2* estimation at 0.55T, which may be attributed to the better B0 homogeneity. These initial findings suggest the potential of 0.55T MRI as a viable platform for quantitative multiparametric liver imaging with improved cost-effectiveness and robustness.Acknowledgements
This work was supported by the NIH (R01EB030549, R01EB031083, R21EB032917 and P41EB017183) and was performed under the rubric of the Center for Advanced Imaging Innovation and Research (CAI2R), an NIBIB National Center for Biomedical Imaging and Bioengineering.References
1. Reeder, S. B., Hu, H. H. & Sirlin, C. B. Proton density fat-fraction: A standardized mr-based biomarker of tissue fat concentration. Journal of Magnetic Resonance Imaging vol. 36 1011–1014 Preprint at https://doi.org/10.1002/jmri.23741 (2012).
2. Hernando, D., Levin, Y. S., Sirlin, C. B. & Reeder, S. B. Quantification of liver iron with MRI: State of the art and remaining challenges. Journal of Magnetic Resonance Imaging 40, 1003–1021 (2014).
3. Welle, C. L., Olson, M. C., Reeder, S. B. & Venkatesh, S. K. MR Imaging of Liver Fibrosis, Fat and Iron. Radiol Clin North Am 60, 705 (2022).
4. Thompson, R. B., Chow, K., Mager, D., Pagano, J. J. & Grenier, J. Simultaneous proton density fat-fraction and R2∗ imaging with water-specific T1 mapping (PROFIT1): application in liver. Magn Reson Med (2020) doi:10.1002/mrm.28434.
5. Li, Z. et al. Rapid fat-water separated T1 mapping using a single-shot radial inversion-recovery spoiled gradient recalled pulse sequence. NMR Biomed 35, (2022).
6. Hines, C. D. G. et al. T1 independent, T2* corrected MRI with accurate spectral modeling for quantification of fat: Validation in a fat-water-SPIO phantom. Journal of Magnetic Resonance Imaging 30, 1215–1222 (2009).
7. Wan, Q. et al. Water Specific MRI T1 Mapping for Evaluating Liver Inflammation Activity Grades in Rats With Methionine-Choline-Deficient Diet-Induced Nonalcoholic Fatty Liver Disease. Journal of Magnetic Resonance Imaging 56, 1429–1436 (2022).
8. Feng, L. et al. Magnetization-prepared GRASP MRI for rapid 3D T1 mapping and fat/water-separated T1 mapping. Magn Reson Med 86, 97–114 (2021).
9. Feng, L. et al. GRASP-Pro: imProving GRASP DCE-MRI through self-calibrating subspace-modeling and contrast phase automation. Magn Reson Med 83, 94–108 (2020).
10. Feng, L. 4D Golden-Angle Radial MRI at Subsecond Temporal Resolution. NMR Biomed (2022) doi:10.1002/NBM.4844.
11. Feng, L. et al. XD-GRASP: Golden-angle radial MRI with reconstruction of extra motion-state dimensions using compressed sensing. Magn Reson Med 75, 775–788 (2016).
12. Hernando, D., Kellman, P., Haldar, J. P. & Liang, Z. P. Robust water/fat separation in the presence of large field inhomogeneities using a graph cut algorithm. Magn Reson Med 63, 79–90 (2010).
13. Benkert, T., Feng, L., Sodickson, D. K., Chandarana, H. & Block, K. T. Free-breathing volumetric fat/water separation by combining radial sampling, compressed sensing, and parallel imaging. Magn Reson Med 78, 565–576 (2017).
14. Zhong, X. et al. Effect of respiratory motion on free-breathing 3D stack-of-radial liver [Formula: see text] relaxometry and improved quantification accuracy using self-gating. Magn Reson Med 83, 1964–1978 (2020).
Figures