2663
Real-Time Respiration Feedback System to Correct Respiration Induced Fluctuation of B0 Field1Beckman Institute, Biomedical Imaging Center, University of Illinois at Urbana-Champaign, Urbana, IL, United States, 2Department of Psychology, University of Illinois at Urbana-Champaign, Urbana, IL, United States, 3Department of Electrical and Computer Engineering, University of Illinois at Urbana-Champaign, Urbana, IL, United States
Synopsis
Keywords: Motion Correction, fMRI (resting state), respiration feedback
Motivation: To implement the respiration-feedback system using the respiration monitor signal available at the MRI console and a solenoid shim coil that has been developed for direct neuronal current mapping.
Goal(s): To compensate for the respiration induced B0 fluctuation in a real-time mode.
Approach: The respiration signal was extracted from the MRI console display using a USB screen capture in real-time. The extracted respiration signal was adjusted and driven to the solenoid shim coil using a custom-built amplifier. Its function was checked by monitoring a resonance frequency at a MRS voxel.
Results: The B0 fluctuation was compensated by the captured respiration signal in real-time.
Impact: The respiration signal which is available at any MRI console can be used for real-time feedback with a USB capturing device to compensate for the respiration induced B0 fluctuation. This will make the respiration feedback system more easily implementable.
Introduction
Respiration-induced B0 fluctuations are a major source of confound in fMRI 1, 2. In prior work, real-time correction of respiration-induced fluctuation of B0 field in MRI has been developed using specially designed sensors and real-time system 3-6. However, these approaches require sophisticated feedback control system. Here, we present a simple method of respiration-feedback and correction using the respiration signal from the scanner and a solenoid coil located at the back of the magnet.Methods
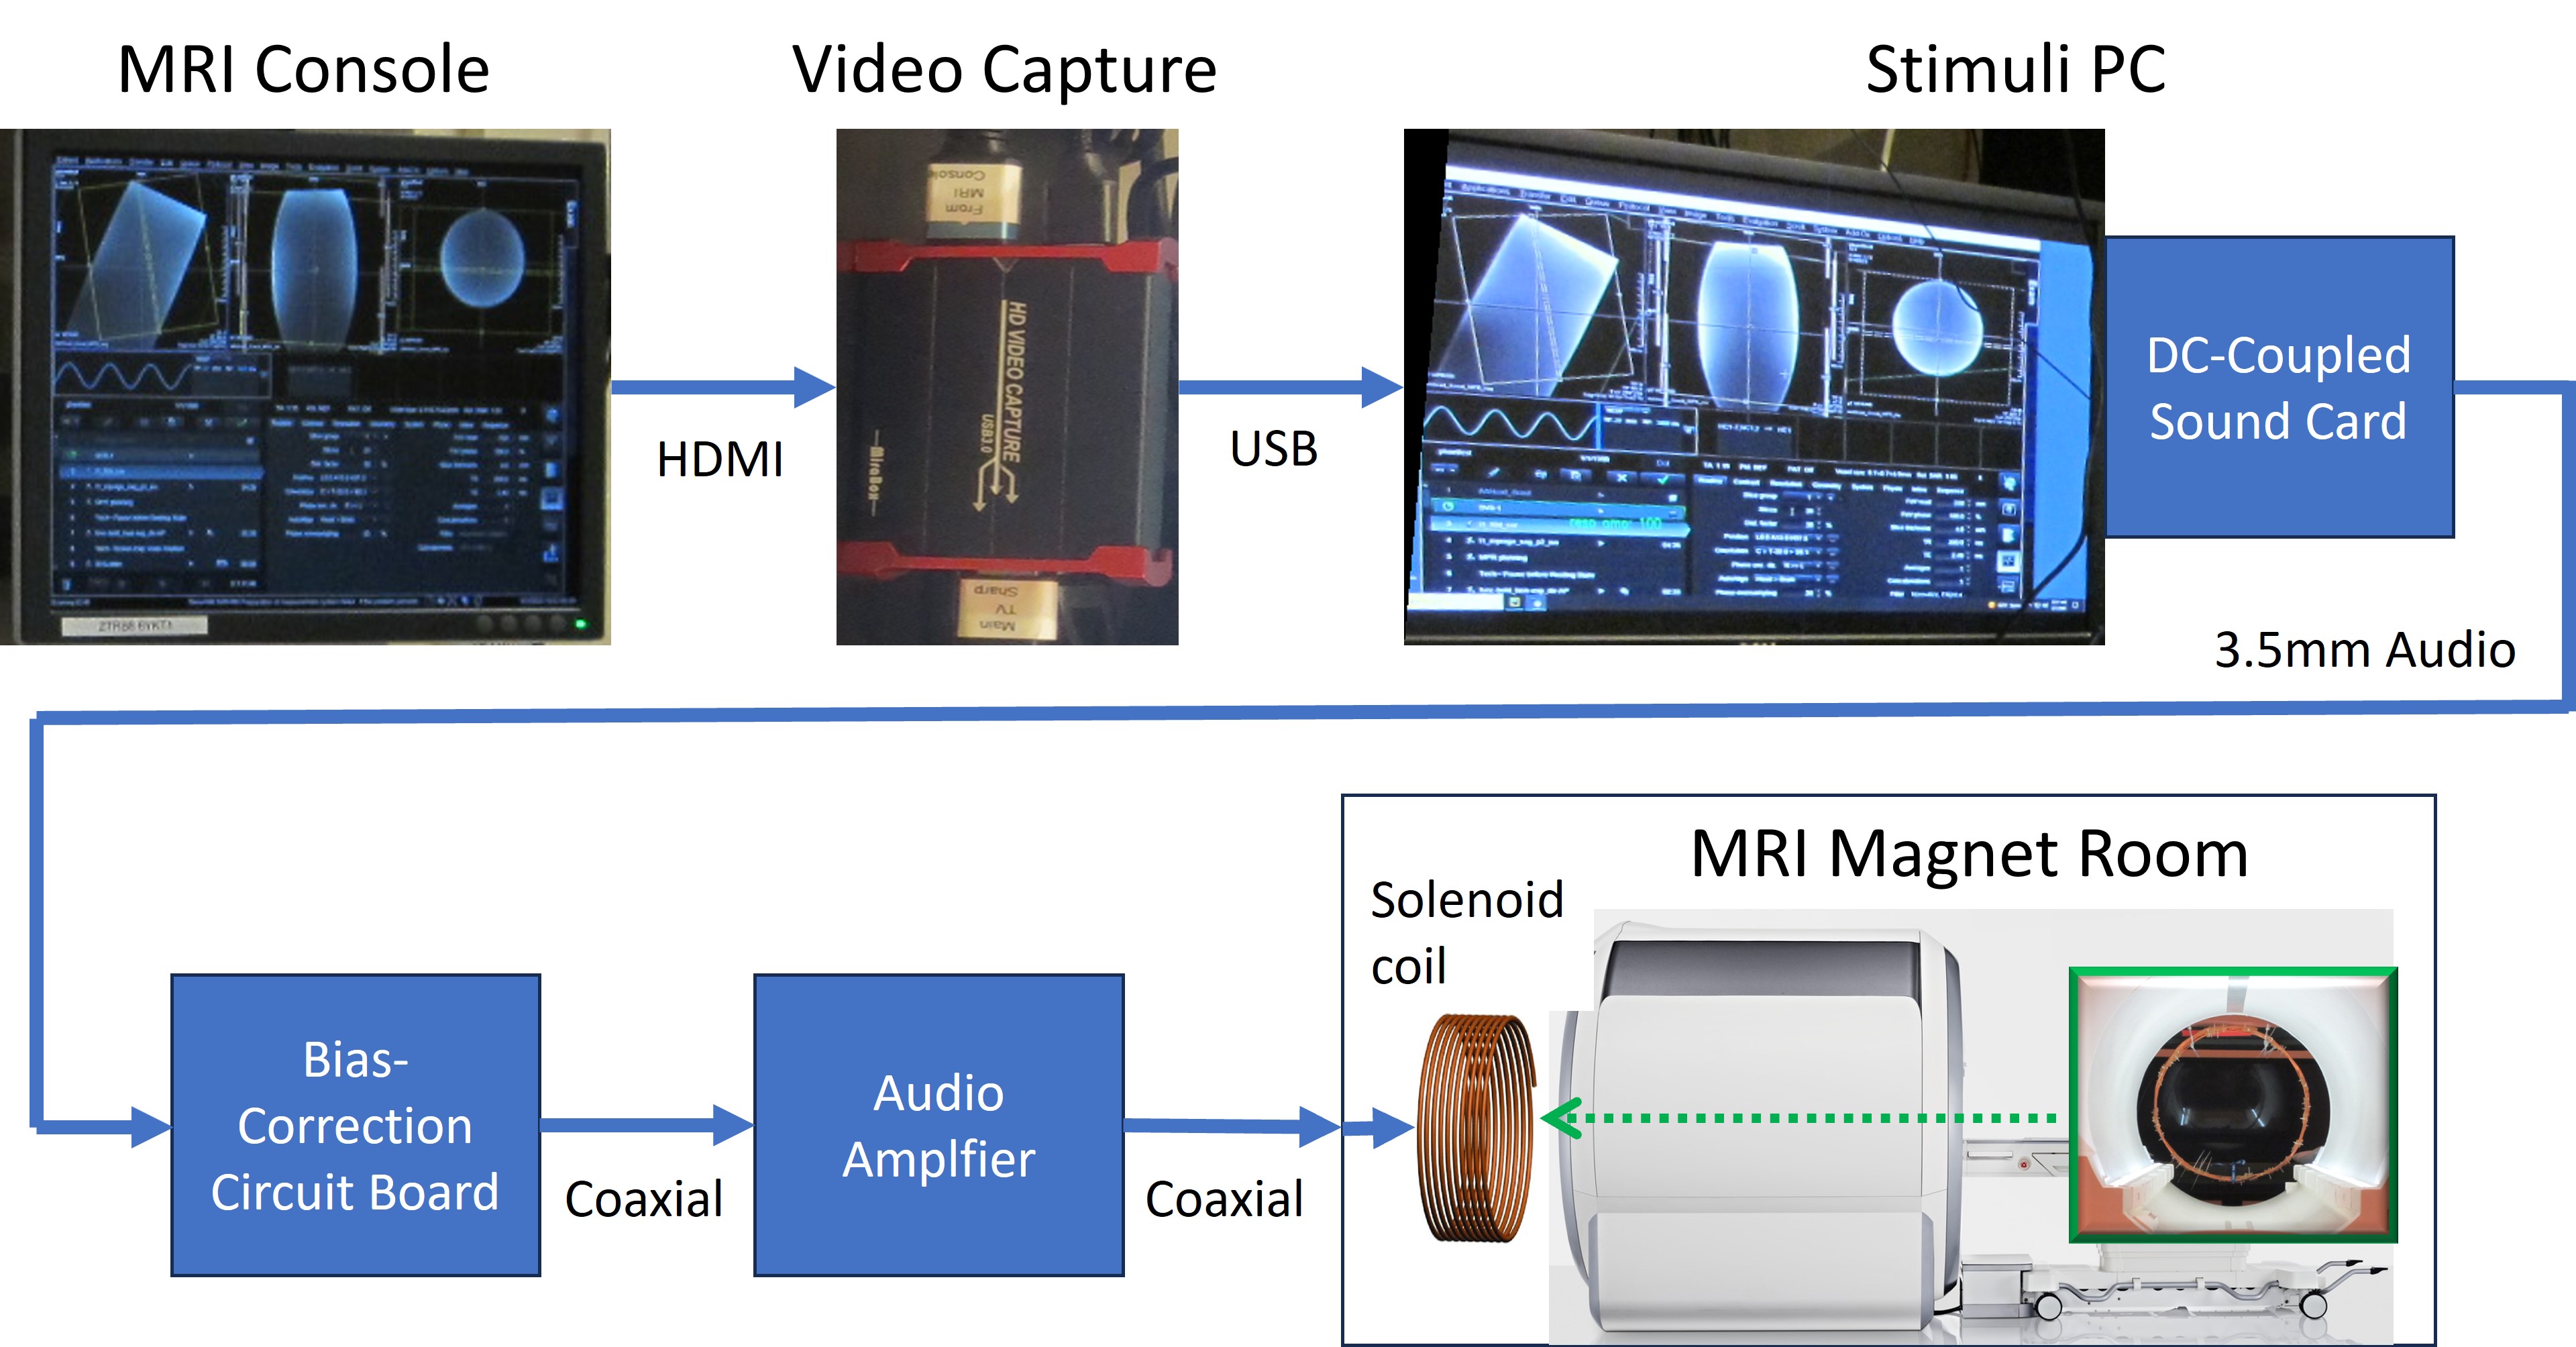
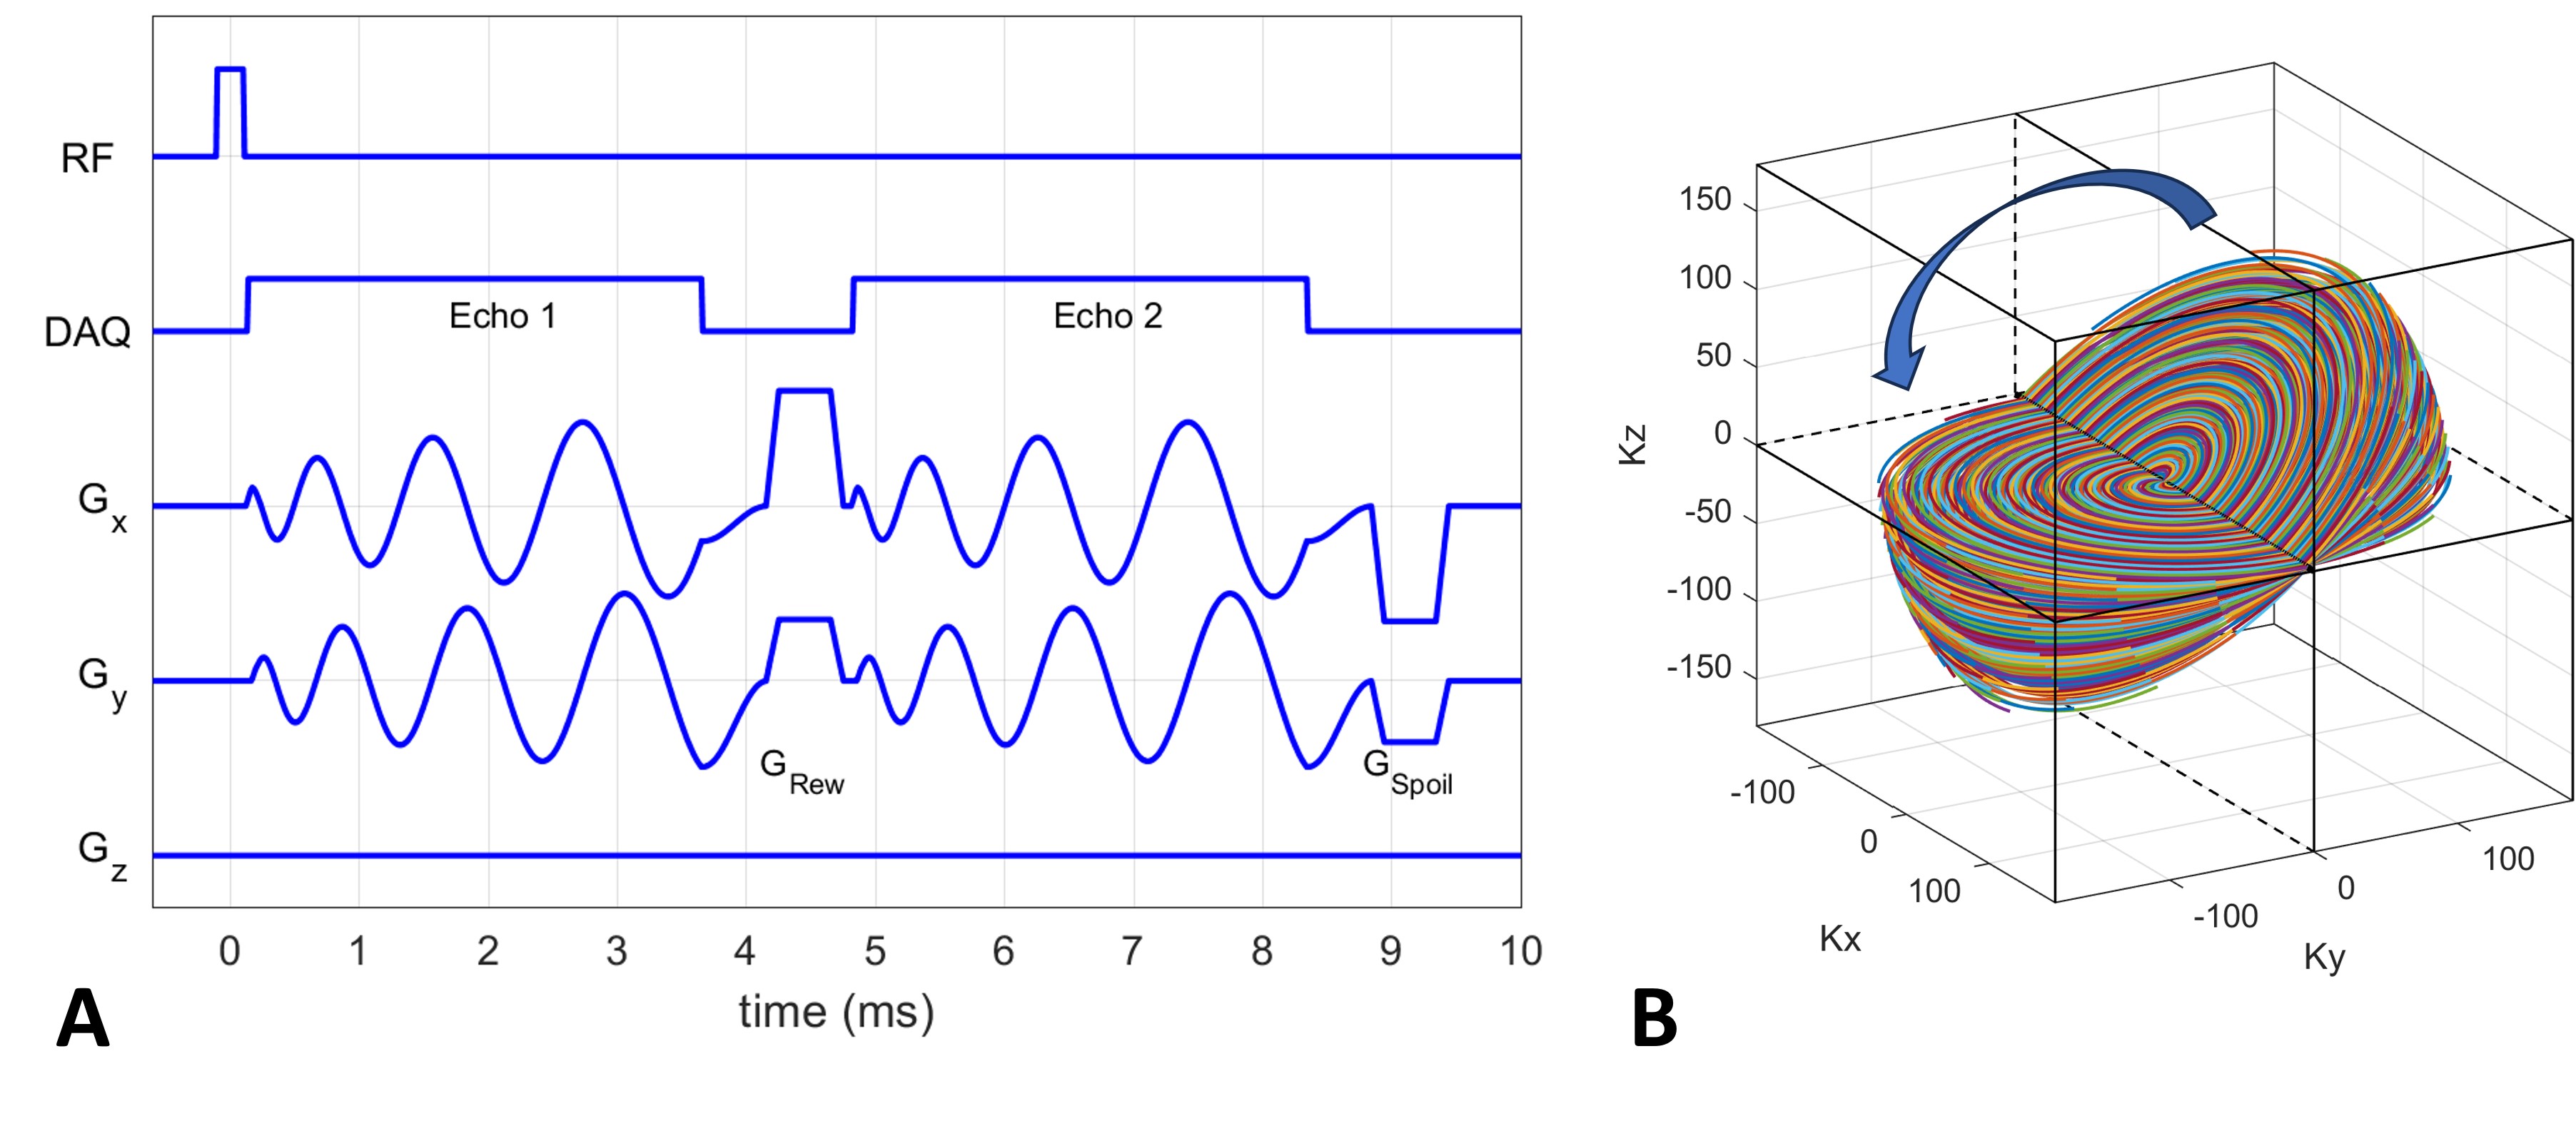
The respiration waveform displayed on the MRI console was captured into a stimulation computer configured for fMRI through a video capturing USB device as shown in Figure 1. A vendor-supplied pneumatic respiration device was used at a 3T whole body scanner. The respiration signal was extracted from the captured console using a CV2 library in a python script. The respiration signal was then fed into a sound card that was modified into a DC-coupled circuit by shunting a capacitor on the output channel. The DC-coupled respiration signal was first corrected for a bias at a custom-built bias correction circuit board using OP amplifiers of MC1458 and then it was driven into a solenoid coil through an audio amplifier with an OP amplifier of OPA548 (Figure 1). The solenoid coil was constructed using a copper wire (10 turns and diameter of 49cm) and it was attached to a plastic stand. It was located 10 cm distance from the rear cover of the 3T magnet. The B0 magnetic field map was measured at full inhale and exhale breath-hold using a 3-D fast (scan time=9s) field-mapping sequence that was developed by extending the RSD UTE sequence to acquire two echoes at echo times= 0.07 and 4.8ms with a 3.4mm isotropic voxel size, TR=9.8ms, and flip angle=7° (Figure 2) 7, 8. The field maps were obtained at maximum inhale and exhale breath-hold conditions to calibrate the polarity, amplitude, and delay of the correction current to the solenoid. The feedback system was tested on two subjects in natural breathing experiments in which the frequency of a water spectral peak was monitored together with a respiration signal using a single-voxel PRESS MRS sequence at a right visual cortex region (voxel size=15mm, TR/TE=250/33ms, flip angle=40°, 128 measurements, and vector size=256). Frequency values at each TR were calculated using the FID-A toolbox 9. The effect of feedback was measured by standard deviation of the B0 field fluctuation and by correlation coefficient between the respiratory and the B0 field fluctuation.Results
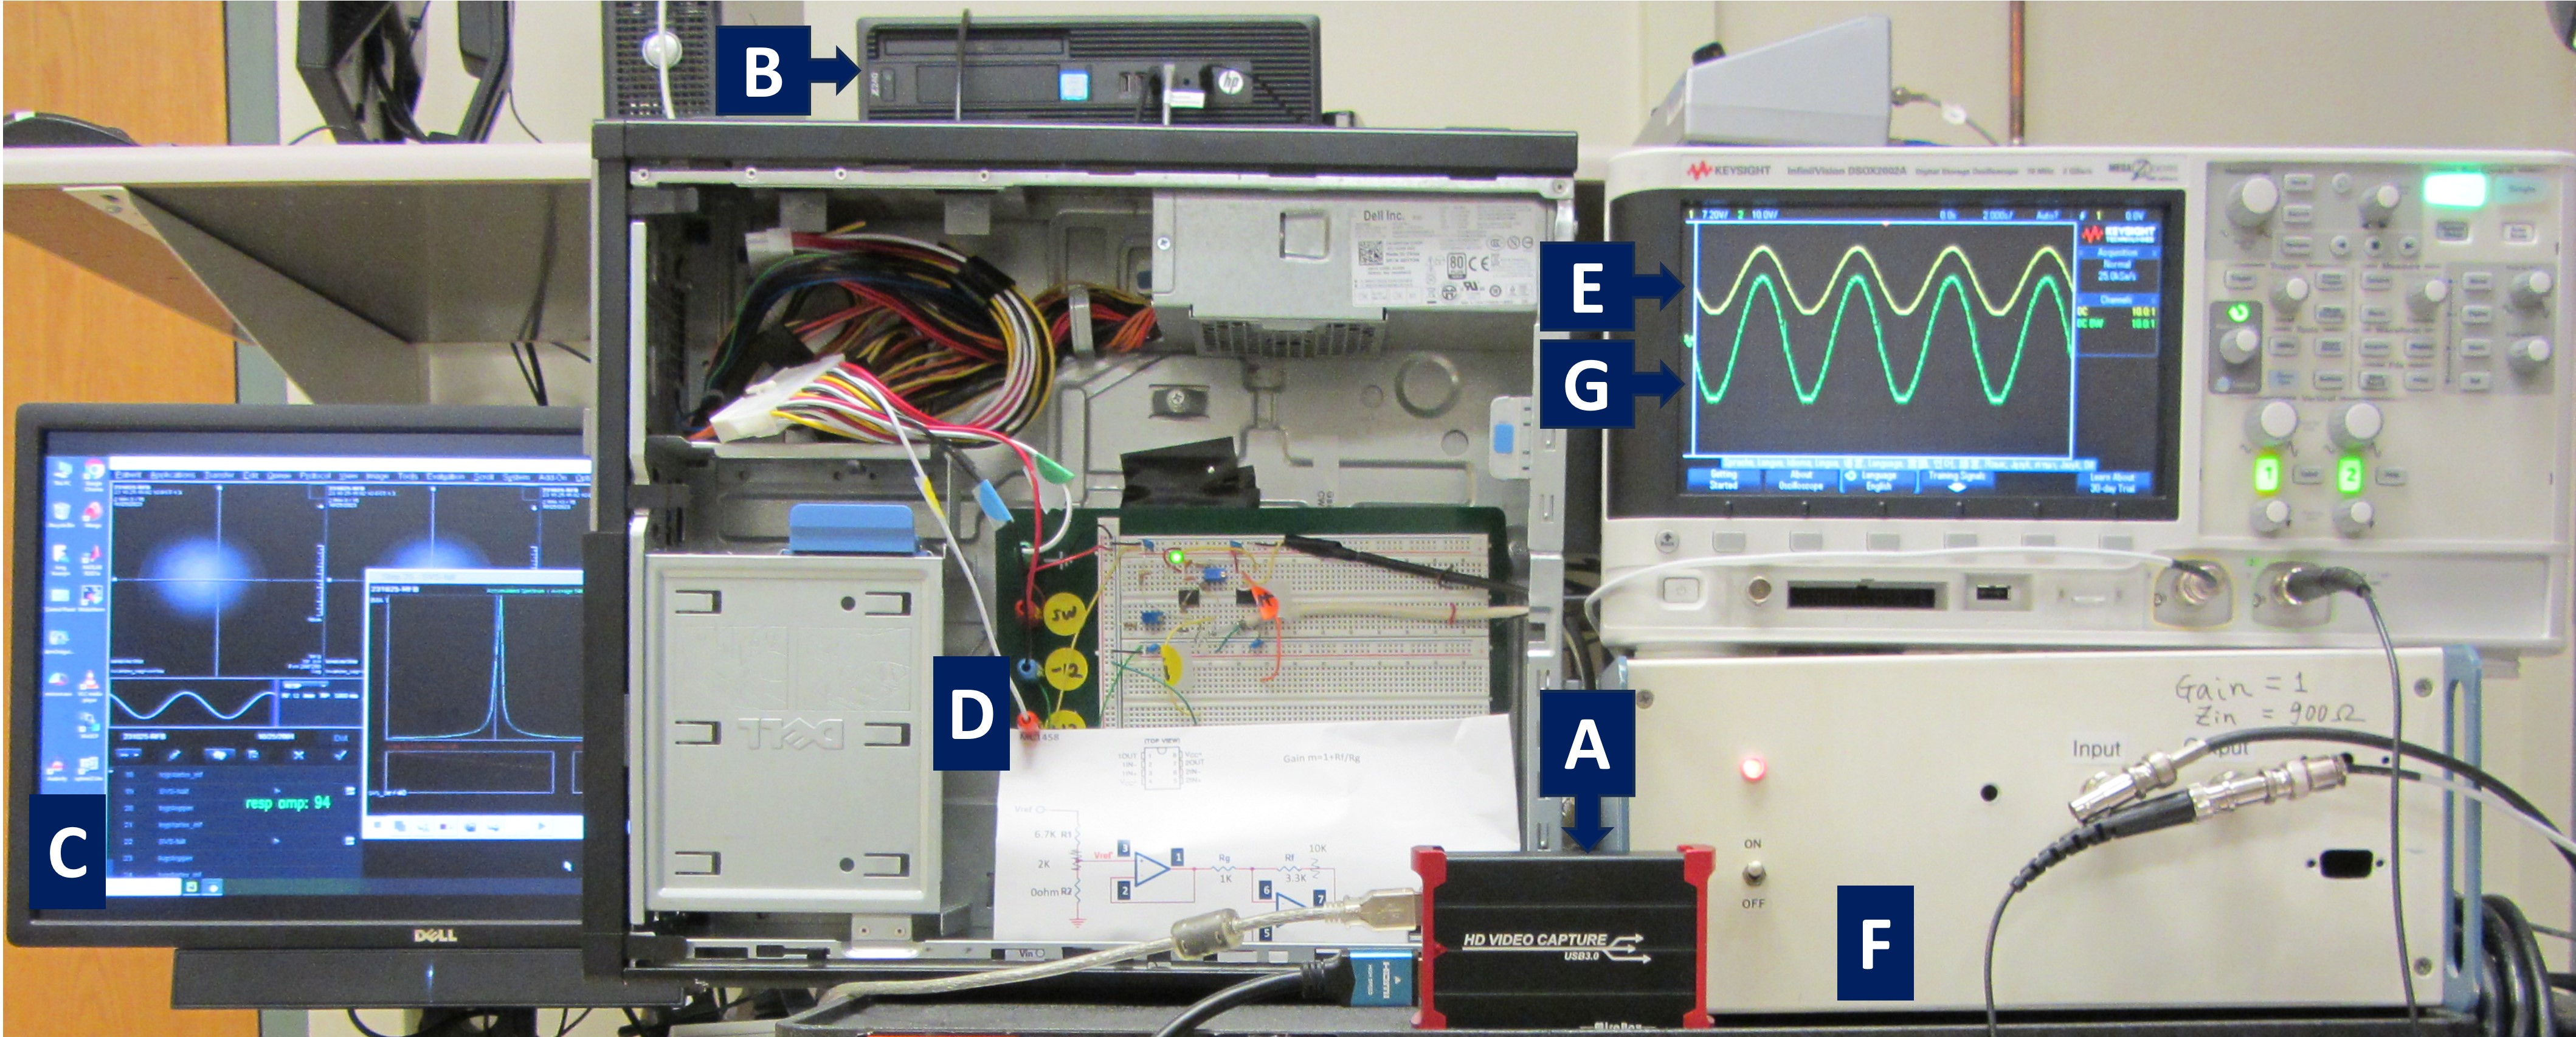
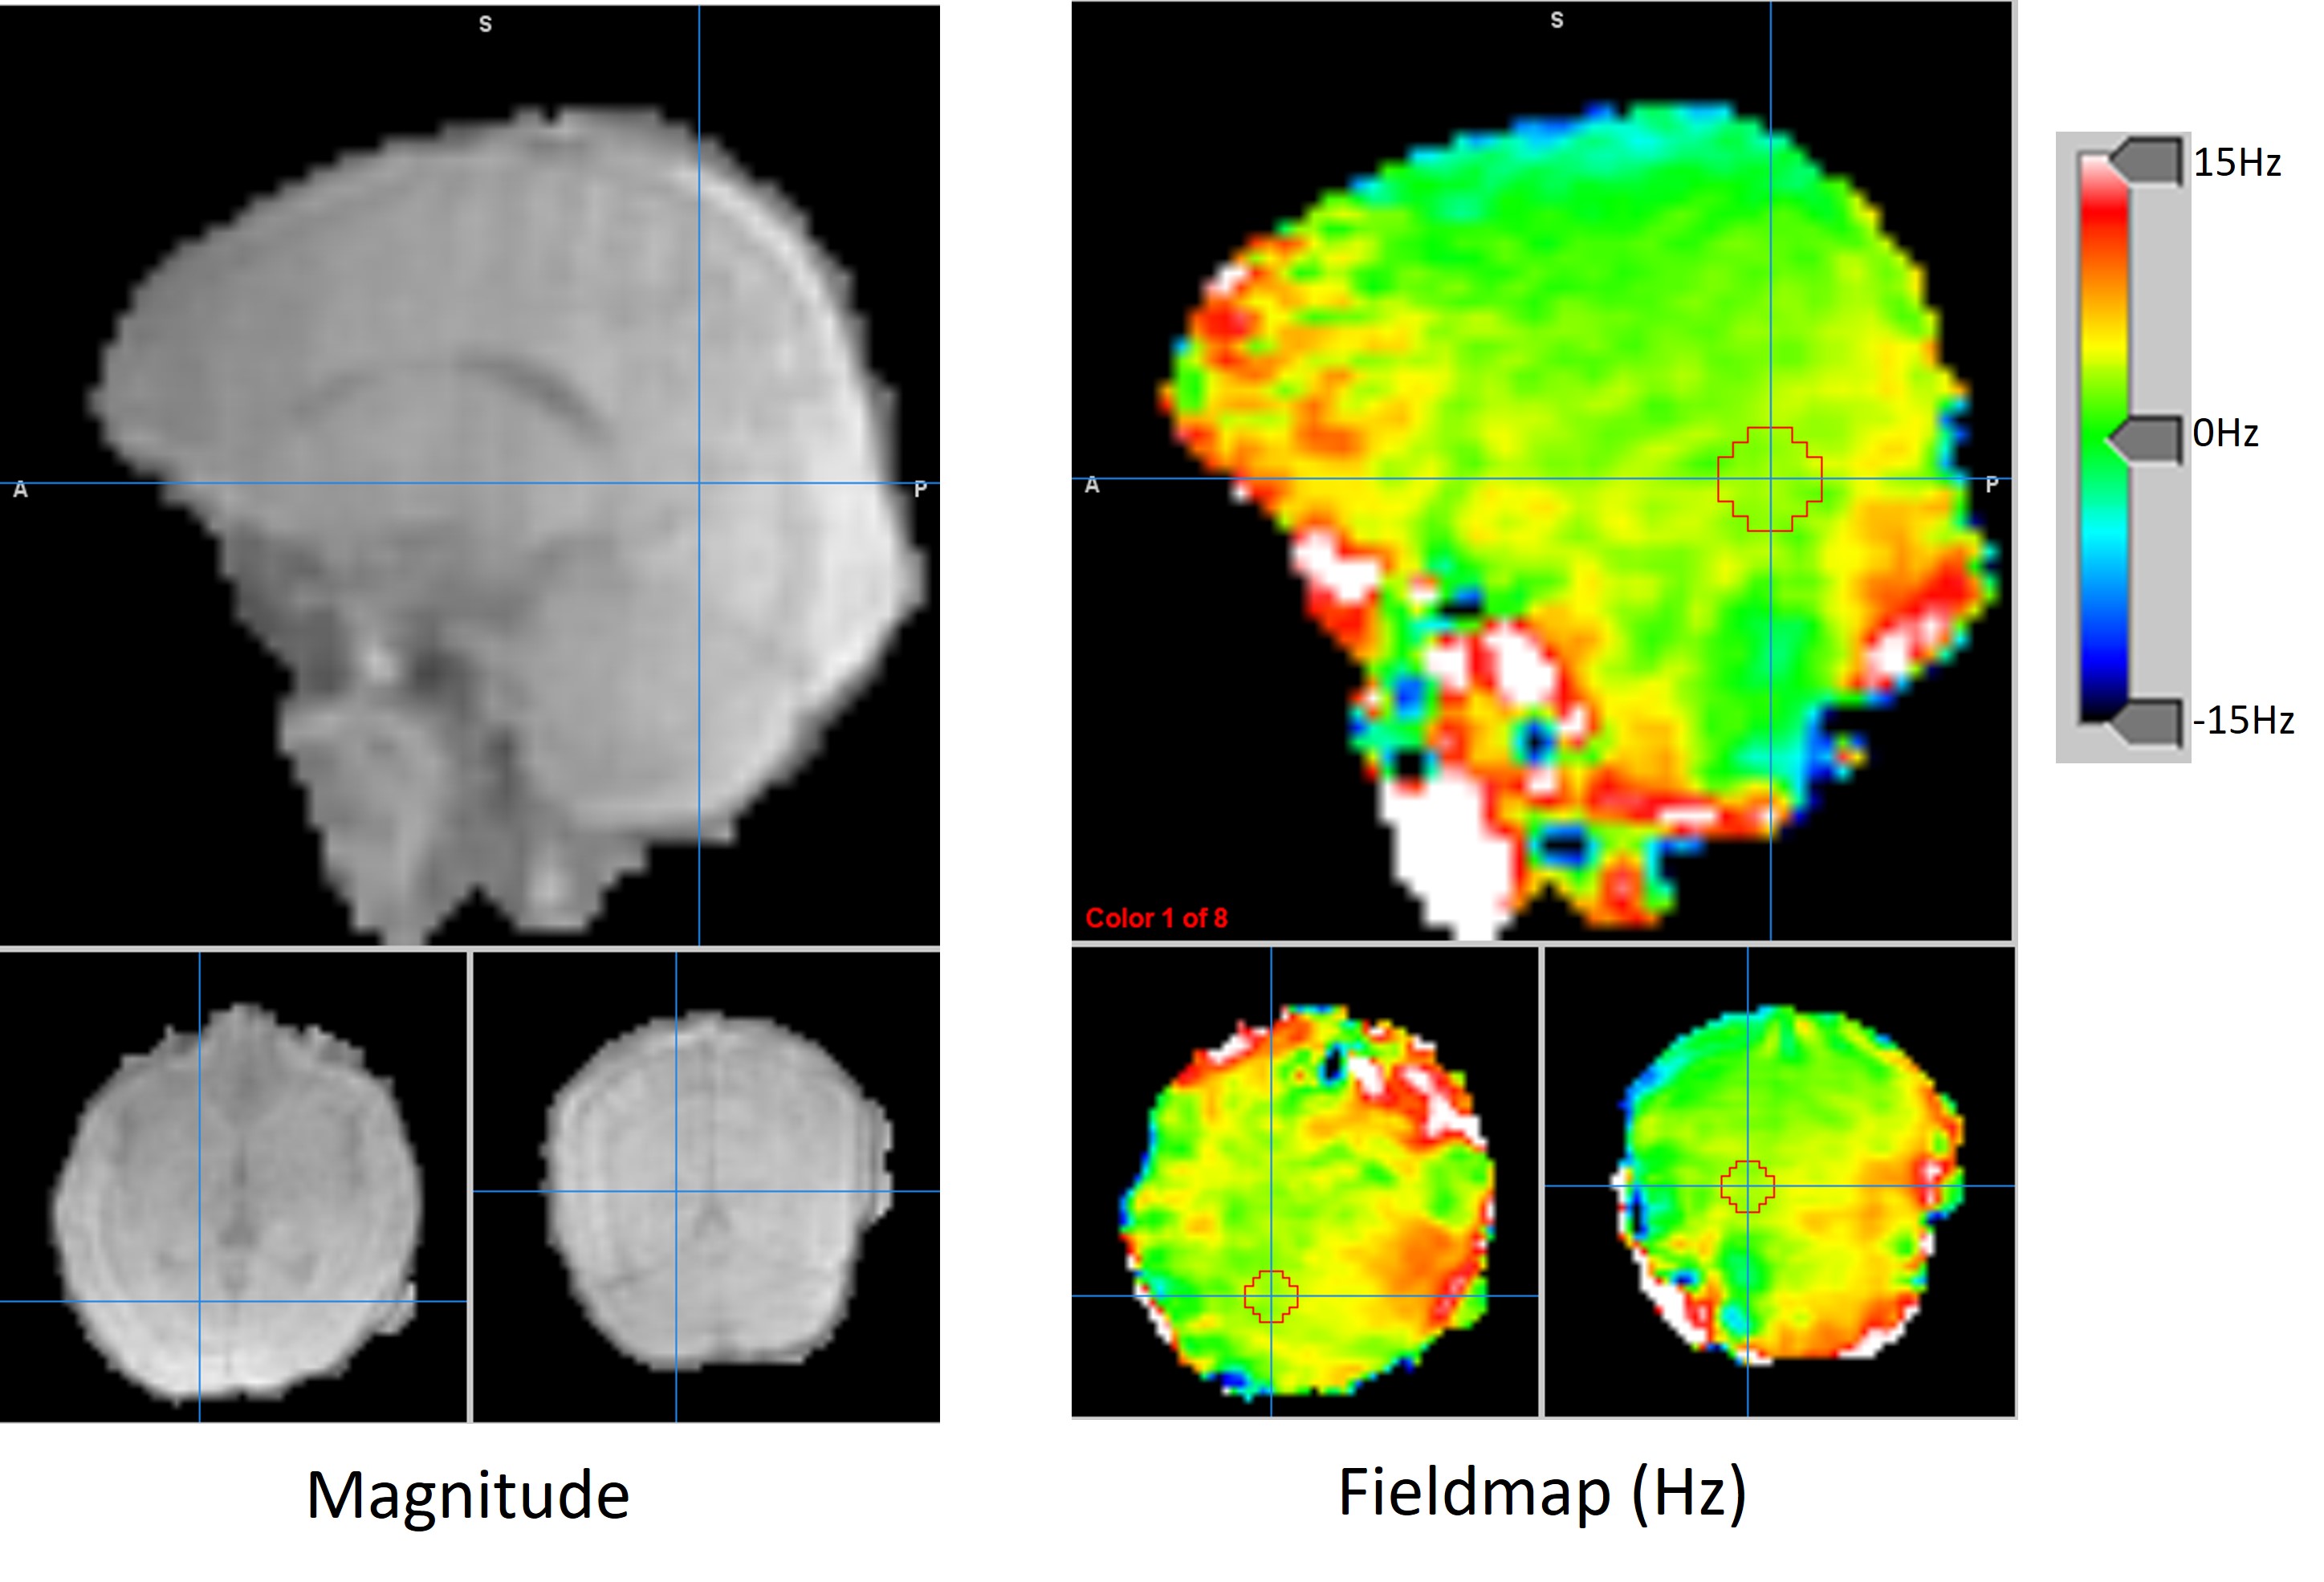
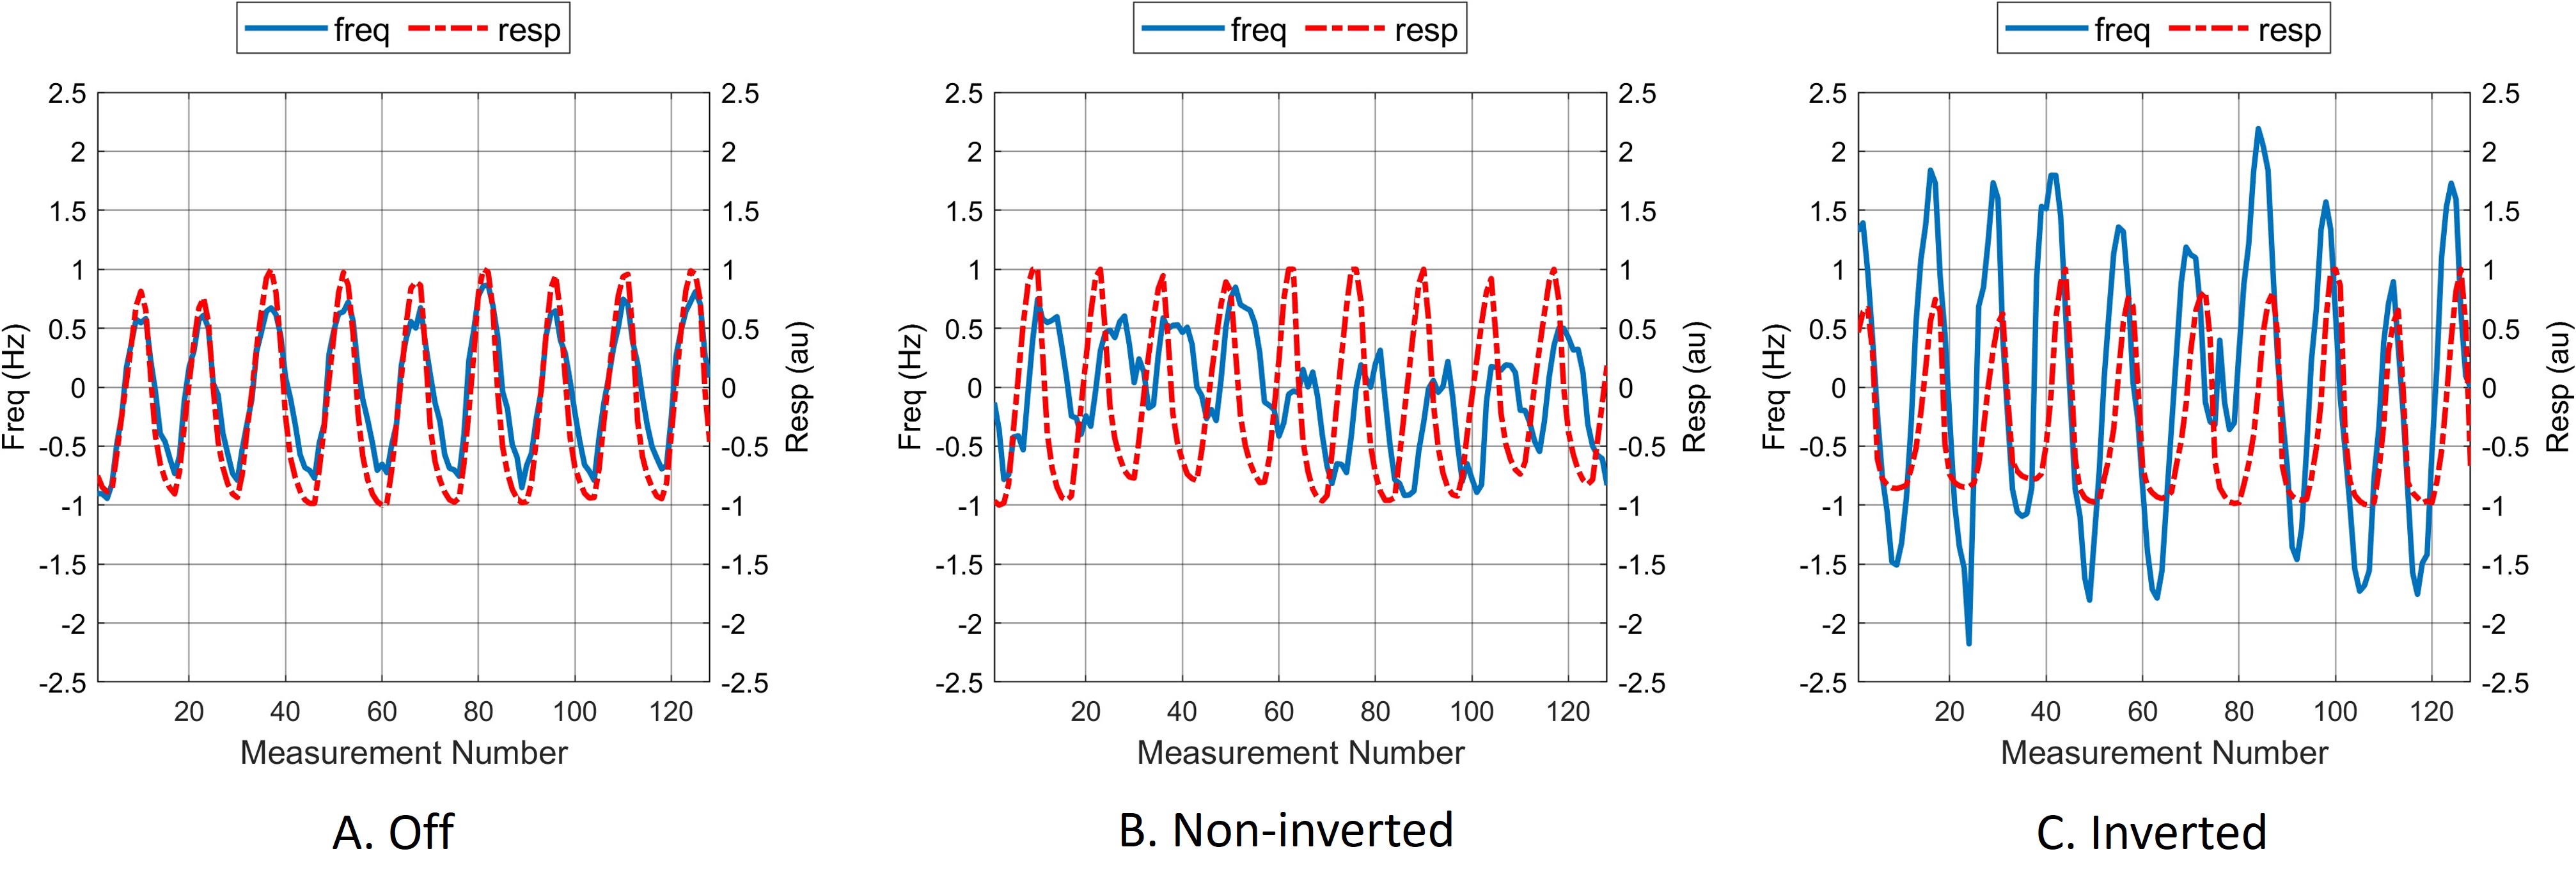
The overall hardware configuration and respiration waveform are shown in Figure 3. There was no detectable lag from the respiration signal displayed on the scanner’s console and the output waveform from the audio amplifier. The solenoid coil was noticed to sway a few millimeters following the driving respiratory waveform. Measurement results from one representative subject (age=24, weight=86kg, height=182cm) is shown here. The field maps acquired at full inhale and exhale conditions resulted in 3.0Hz difference in frequency at the optical cortex region (Figure 4). The B0 or frequency fluctuation during natural breathing is shown in Figure 5 in the absence and presences of respiration feedback. The respiration feedback effect with the non-inverting polarity resulted in decreased standard deviation and correlation, while that with the inverting polarity resulted in increased standard deviation and higher correlation coefficient from the non-inverted feedback.Discussion
The calibration of the feedback variables such as the gain and delay time had not been fully implemented in this report, but we will develop an effective calibration method. The solenoid-coil-induced field is sloped in the solenoid axis or the Z direction 10, and this will limit the field correction area. However, the solenoid-coil-induced field can be calibrated at a small region as in MR spectroscopy. In future work, a more general correction can be obtained for real-time control of the existing shim coils in the MRI system.Conclusion
We designed a real-time feedback system of respiration with minimum additional components and demonstrated its effectiveness in compensating the respiration induced B0 filed at a single voxel region as a proof-of-concept. In this work, we also developed a fast B0 field mapping sequence using a 3D UTE sequence that acquired the field maps during a short period of breath hold.Acknowledgements
This project was partially supported by an award from the Campus Research Board (RB22097. PI: S Sadaghiani, Co-I: B Sutton). The audio amplifier was built by a research engineer John Roscheck in NMR laboratory of University of Illinois at Urbana-Champaign.References
1. Raj D, Paley DP, Anderson AW, Kennan RP, Gore JC. A model for susceptibility artefacts from respiration in functional echo-planar magnetic resonance imaging. Physics in Medicine and Biology. 2000;45(12):3809-20.
2. Van de Moortele PF, Pfeuffer J, Glover GH, Ugurbil K, Hu X. Respiration-induced B0 fluctuations and their spatial distribution in the human brain at 7 Tesla. Magn Reson Med. 2002;47(5):888-95.
3. Duerst Y, Wilm BJ, Wyss M, Dietrich BE, Gross S, Schmid T et al. Utility of Real-Time Field Control in T2-Weighted Head MRI at 7T. Magnet Reson Med. 2016;76(2):430-9.
4. Topfer R, Foias A, Stikov N, Cohen-Adad J. Real-time correction of respiration-induced distortions in the human spinal cord using a 24-channel shim array. Magnet Reson Med. 2018;80(3):935-46.
5. Wilm BJ, Duerst Y, Dietrich BE, Wyss M, Vannesjo SJ, Schmid T et al. Feedback Field Control Improves Linewidths in In Vivo Magnetic Resonance Spectroscopy. Magnet Reson Med. 2014;71(5):1657-62.
6. Lee J, Santos JM, Conolly SM, Miller KL, Hargreaves BA, Pauly JM. Respiration-induced B field fluctuation compensation in balanced SSFP:: Real-time approach for transition-band SSFP fMRI. Magnet Reson Med. 2006;55(5):1197-201.
7. Jung KJ, Sutton B, editors. Three-Dimensional Sodium MRI Using A Rotation of Spiral Disc (RSD) Trajectory. Int Soc Magn Reson Med; 2021.
8. Jung KJ, Fang HY, Wilund K, Sutton B, editors. Separation of Intra- and Extra-cellular Sodium Using A Rotation of Spiral Disc (RSD) Sequence with Multiple Echoes. Int Soc Magn Reson Med; 2022.
9. Simpson R, Devenyi GA, Jezzard P, Hennessy TJ, Near J. Advanced processing and simulation of MRS data using the FID appliance (FID-A)An open source, MATLAB-based toolkit. Magnet Reson Med. 2017;77(1):23-33.
10. Zahneisen B, Assländer J, LeVan P, Hugger T, Reisert M, Ernst T et al. Quantification and Correction of Respiration Induced Dynamic Field Map Changes in fMRI Using 3D Single Shot Techniques. Magnet Reson Med. 2014;71(3):1093-102.Figures