2657
Motion correction with subspace-based self-navigation for combined angiography, structural and perfusion imaging using ASL1University of Oxford, Oxford, United Kingdom, 2Physical Sciences, Sunnybrook Research Institute, Toronto, ON, Canada, 3Department of Medical Biophysics, University of Toronto, Toronto, ON, Canada
Synopsis
Keywords: Motion Correction, Motion Correction
Motivation: Perfusion and angiographic images using arterial spin labeling (ASL) are particularly susceptible to head motion.
Goal(s): To correct motion for Combined Angiography, Structural and Perfusion using Radial Imaging and ASL (CASPRIA) and reduce motion induced aliasing and blurriness for angiographic, perfusion and structural imaging.
Approach: 3D navigators are reconstructed after each ASL preparation using subspace to account for varying contrast. These are used to correct the raw data for motion. A joint label and control reconstruction was formulated to generate motion corrected perfusion and angiographic images.
Results: Motion induced artefacts and blurriness were greatly reduced in angiographic, structural and perfusion data.
Impact: Motion robustness of CASPRIA sequence was improved, facilitating future clinical application with less cooperative patients.
Introduction
Arterial spin labeling (ASL) is a non-invasive, non-contrast-based imaging method for visualization of angiographic and perfusion images1,2. Recently, an efficient acquisition method for 4D- Combined Angiography, Structural and Perfusion using Radial Imaging and ASL (CASPRIA)3 was proposed to simultaneously obtain angiographic, structural and perfusion images.However, the resulting perfusion and angiographic images are susceptible to motion in case of mismatch between label and control images. Previous motion correction methods for perfusion imaging4,5 would fail in this case due to the time-varying static tissue signal after PCASL preparation. To address this, we propose a new self-navigated motion correction method which incorporates a subspace approach6 for navigator reconstruction and jointly reconstructs tag and control images. In-vivo experiments validated the reduced noise and blurriness in perfusion, structural and angiographic images reconstructed from CASPRIA.Method
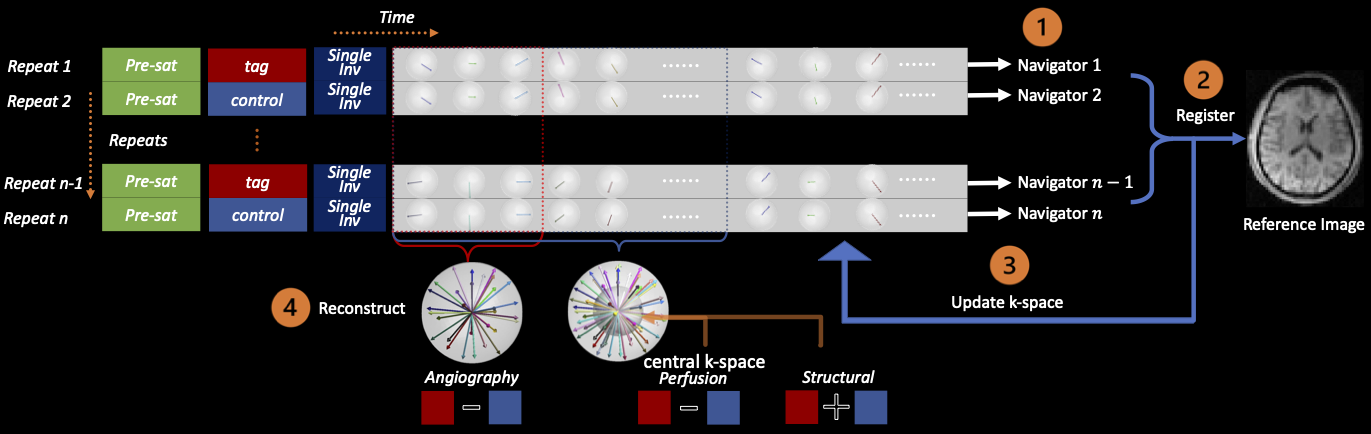
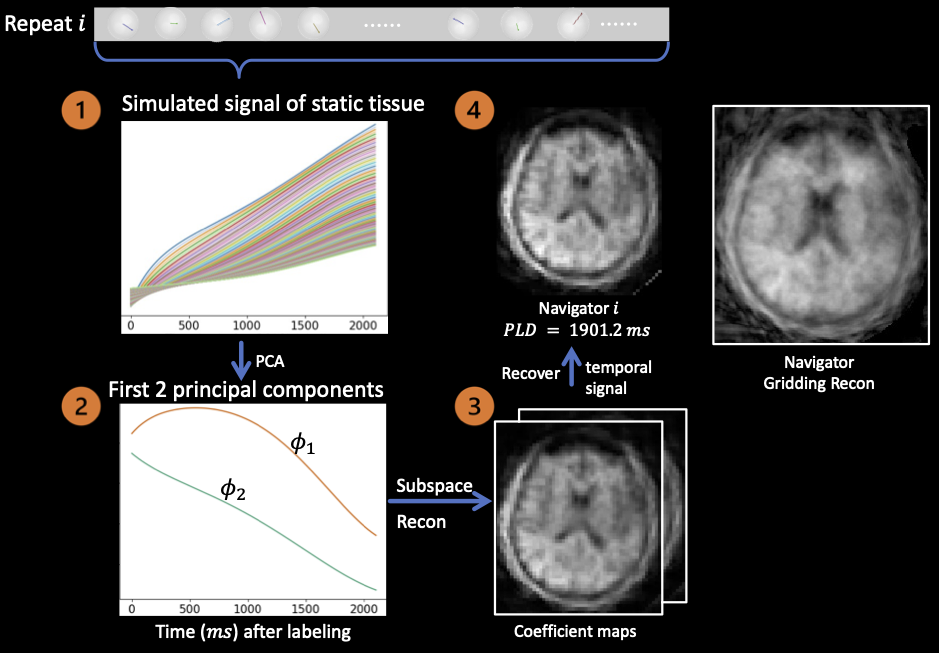
Overview of the pipeline: As illustrated in Figure 1, the CASPRIA3 sequence is composed of multiple repeats. A PCASL7 pulse train is followed by a single inversion pulse for background suppression and a train of radial readouts with 3D golden angle ordering8. An interleaved scheme across repeats ensures the same lines of k-space are acquired for “tag” and “control”. Subtraction of tag and control data isolates the blood signal, whereas their summation gives the static tissue signal. Readouts are grouped across all repeats of several adjacent acquisition timepoints to achieve sufficient k-space sampling. Assuming within-repeat motion was negligible in ~2s, a navigator was reconstructed from each repeat. Because of the continuously varying contrast introduced by the single inversion pulse and limited number of radial spokes available for each navigator, conventional reconstructions like CG-SENSE9 and gridding10 generated images with significant artefacts. Therefore, a subspace method was developed to accommodate the signal evolution within each repeat.Subspace based reconstruction of navigator: Figure 2 illustrates the process of reconstructing structural images using the subspace method. The simulated dictionary of static tissue signal evolution is compressed to two principal components , and the corresponding coefficient maps were reconstructed from Equation 1 (A is the forward model and W represents wavelet transform). The navigator image was recovered from coefficient maps according to Equation 2. Each navigator was registered using MCFLIRT11 and the transformation matrices were used to update the k-space trajectory and the data.
$$\alpha=\arg\min_{\alpha}\|A\Phi\alpha-y\|_2+\lambda\|W\alpha\|\quad(1)$$$$x=\Phi\alpha\quad(2)$$
Joint reconstruction of tag & control images for perfusion and angiography: Since the k-space coordinates for tag and control data are no longer matched after motion correction, direct k-space subtraction becomes infeasible. Additionally, subtraction of separately reconstructed tag and control images led to significant artefacts due to strong static tissue signal. Hence, the tag and control images were jointly reconstructed with regularization on their difference, as shown in Equation 3. $$$x_1,x_2$$$ are tag and control images respectively. $$$R_i$$$ is an operator for patch extraction. A split-variable method adapted from POGM12 was used for optimization. In addition to the perfusion and angiographic images, motion-corrected dynamic structural images were reconstructed using a subspace method, following Equation 1. $$\left|\left|\left[\begin{matrix}P_1FC&0\\0&P_2FC\end{matrix}\right]\left[\begin{matrix}x_1\\x_2\end{matrix}\right]-\left[\begin{matrix}y_1\\y_2\end{matrix}\right]\right|\right|_2+\lambda\sum_i\left|\left|R_i\left[\begin{matrix}1&-1\end{matrix}\right]\left[\begin{matrix}x_1\\x_2\end{matrix}\right]\right|\right|_*\quad(3)$$
Acquisition parameters: Three sets of data covering no-motion, mild-motion and strong motion were acquired on a 3T Siemens Prisma scanner using a $$$32$$$-channel head coil in a healthy volunteer. For each dataset, $$$98$$$ repeats with $$$49$$$ tag and control respectively were acquired each with $$$216$$$ readouts ($$$TR=9.8ms$$$). Angiographic, structural and perfusion images were reconstructed with isotropic spatial resolution of $$$1.13mm$$$, $$$1.13mm$$$ and $$$3.4mm$$$, and temporal resolution $$$176.4ms$$$, $$$352.8ms$$$ and $$$9.8ms$$$. To investigate the accuracy of motion estimation, motion was simulated using the no-motion data.
Results and conclusion
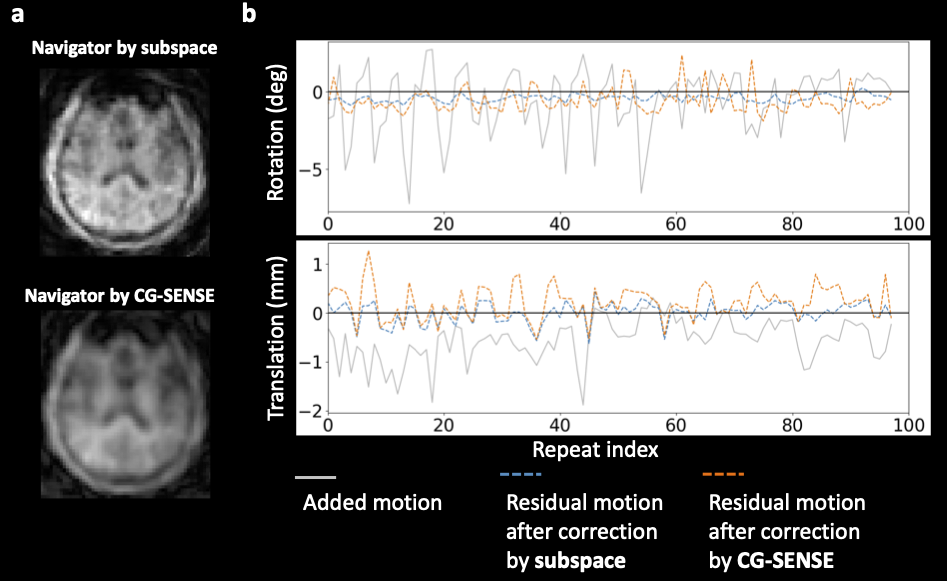
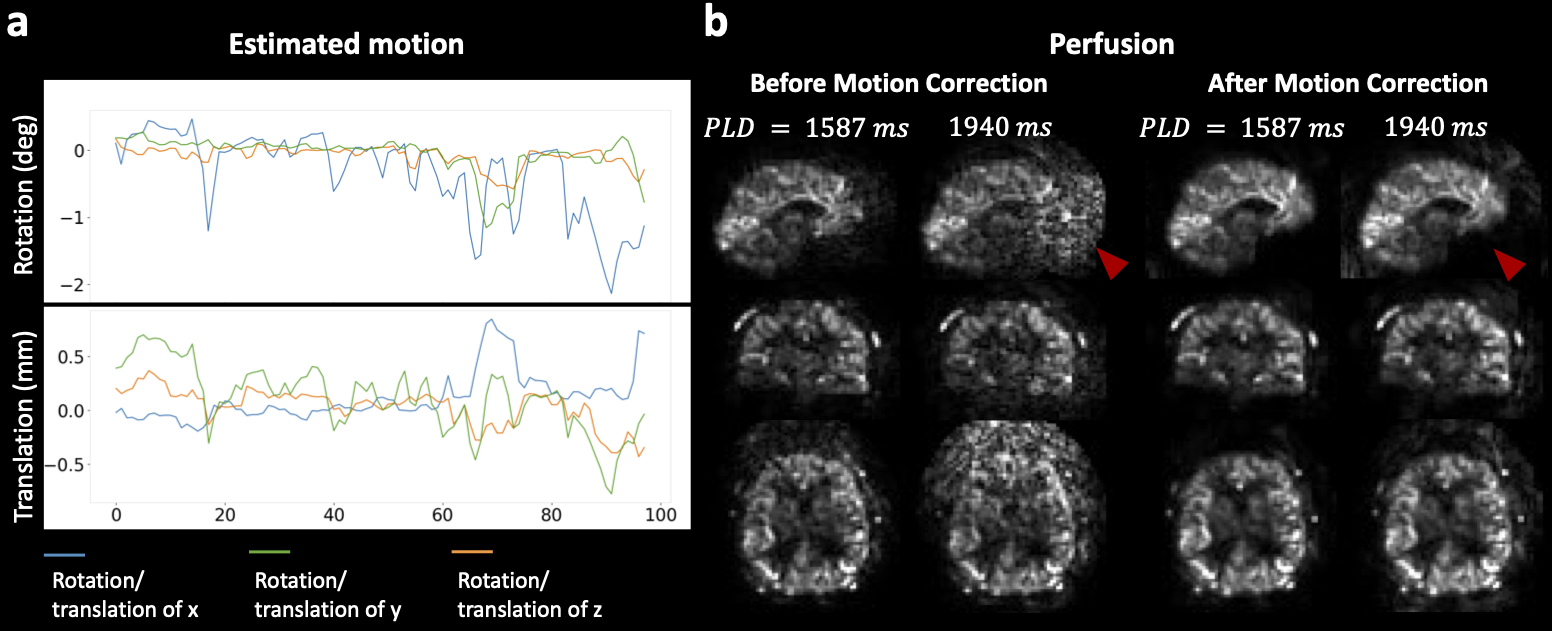
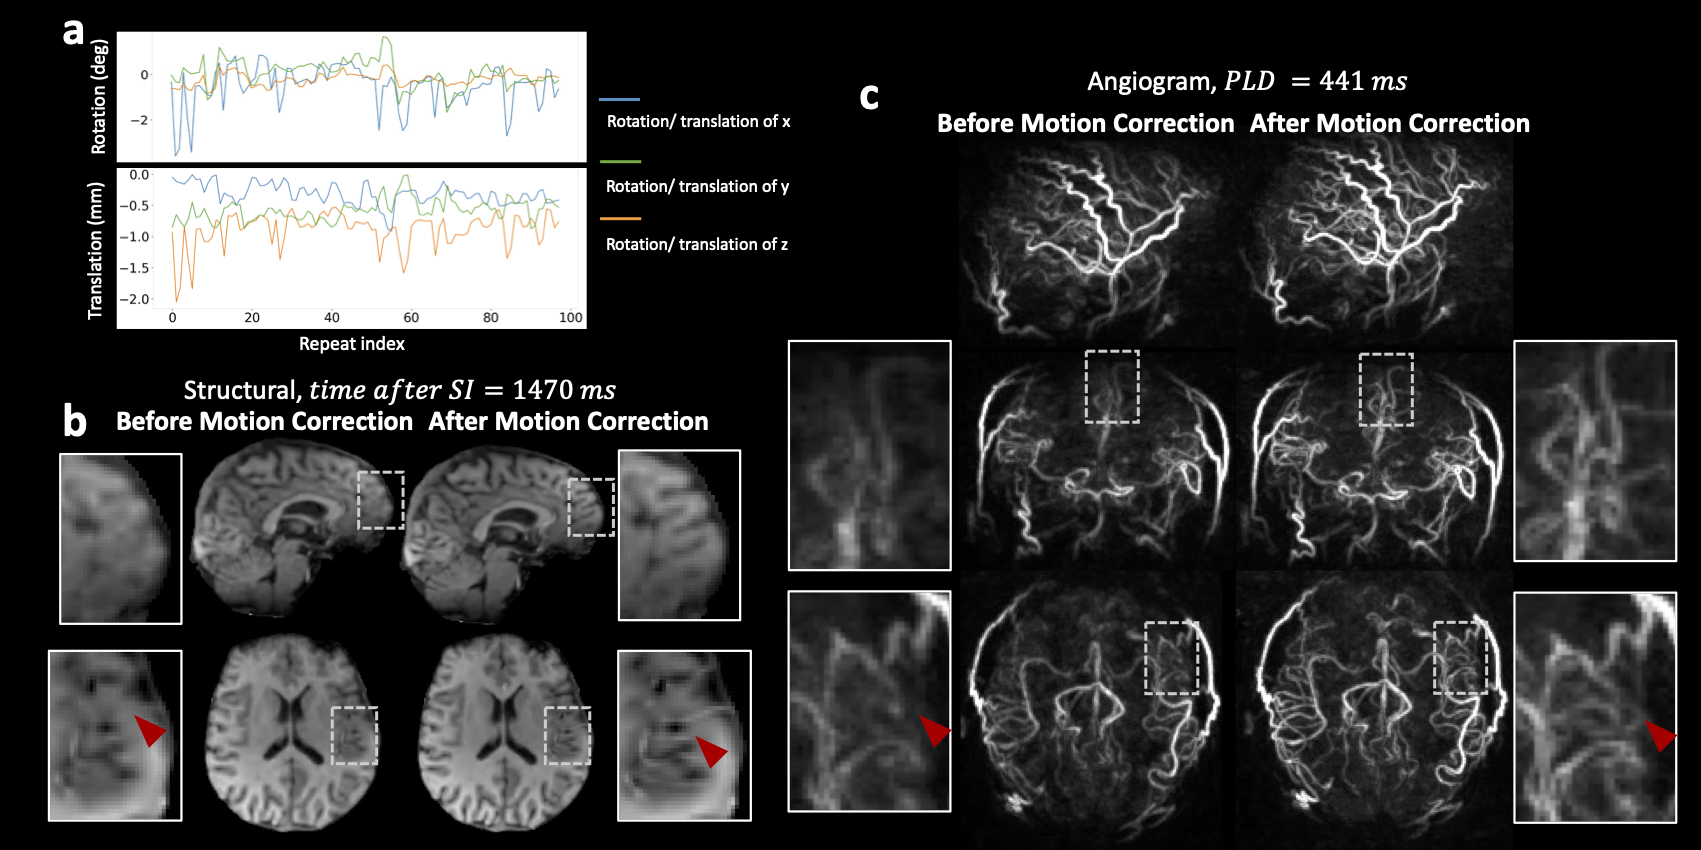
The simulated motion estimation is presented in Figure 3. Figure 3a demonstrates the improved sharpness and reduced artifacts of the navigator reconstructed using the subspace-based method compared to the CG-SENSE-based method, which enabled more accurate registration, as shown in Figure 3b. The results for mild-motion data are shown in Figure 4. The estimated motion is plotted in Figure 4a. Figure 4b demonstrates that the perfusion data is highly susceptible to motion. The reconstructed perfusion images were corrupted by strong artefacts, which were largely removed by our approach. In the strong motion scenario, the structural and angiogram reconstructions were noticeably blurred (Figure 5a). The brain structure and small vessels became much more discernible after motion correction (Figure 5b,c). In conclusion, our self-navigated motion correction approach incorporated signal evolution for a high quality navigator and reduced motion-induced artefacts in perfusion, as well as blurriness in structural and angiographic images. Quantitative comparisons in a larger number of healthy subjects will be performed in future work.Acknowledgements
This study is supported by the NIHR Oxford Health Biomedical Research Centre (NIHR203316). The views expressed are those of the author(s) and not necessarily those of the NIHR or the Department of Health and Social Care. The Wellcome Centre for Integrative Neuroimaging is supported by core funding from the Wellcome Trust (203139/Z/16/Z and 203139/A/16/Z). W.W. is supported by the Royal Academy of Engineering (RF\201819\18\92). M.C. is supported by the Canada Research Chair Program. TWO is supported by a Royal Academy of Engineering (RF/132, RF/201617/16/23) and a Sir Henry Dale Fellowship jointly funded by the Wellcome Trust and the Royal Society (220204/Z/20/Z).
References
1. Nishimura DG, Macovski A, Pauly JM, Conolly SM. MR angiography by selective inversion recovery. Magnetic Resonance in Medicine. 1987;4(2):193-202. doi:10.1002/mrm.1910040214
2. Wang SJ, Nishimura DG, Macovski A. Multiple-readout selective inversion recovery angiography. Magnetic Resonance in Medicine. 1991;17(1):244-251. doi:10.1002/mrm.1910170127
3. Okell TW, Chiew M. Optimization of 4D combined angiography and perfusion using radial imaging and arterial spin labeling. Magn Reson Med. 2023;89(5):1853-1870. doi:10.1002/mrm.29558
4. Suzuki Y, Okell TW, Chappell MA, van Osch MJP. A framework for motion correction of background suppressed arterial spin labeling perfusion images acquired with simultaneous multi-slice EPI. Magnetic Resonance in Medicine. 2019;81(3):1553-1565. doi:10.1002/mrm.27499
5. Huber J, Hoinkiss DC, Günther M. Joint estimation and correction of motion and geometric distortion in segmented arterial spin labeling. Magnetic Resonance in Medicine. 2022;87(4):1876-1885. doi:10.1002/mrm.29083
6. Tamir JI, Uecker M, Chen W, et al. T 2 shuffling: Sharp, multicontrast, volumetric fast spin‐echo imaging. Magn Reson Med. 2017;77(1):180-195. doi:10.1002/mrm.26102
7. Dai W, Garcia D, de Bazelaire C, Alsop DC. Continuous flow-driven inversion for arterial spin labeling using pulsed radio frequency and gradient fields. Magnetic Resonance in Medicine. 2008;60(6):1488-1497. doi:10.1002/mrm.21790
8. Chan RW, Ramsay EA, Cunningham CH, Plewes DB. Temporal stability of adaptive 3D radial MRI using multidimensional golden means. Magn Reson Med. 2009;61(2):354-363. doi:10.1002/mrm.21837
9. Pruessmann KP, Weiger M, Börnert P, Boesiger P. Advances in sensitivity encoding with arbitrary k-space trajectories. Magnetic Resonance in Medicine. 2001;46(4):638-651. doi:10.1002/mrm.1241
10. Fessler JA, Sutton BP. Nonuniform fast fourier transforms using min-max interpolation. IEEE Trans Signal Process. 2003;51(2):560-574. doi:10.1109/TSP.2002.807005
11. Jenkinson M, Bannister P, Brady M, Smith S. Improved Optimization for the Robust and Accurate Linear Registration and Motion Correction of Brain Images.
12. Exact Worst-Case Performance of First-Order Methods for Composite Convex Optimization. doi:10.1137/16M108104X
Figures