2632
Evaluation of Imaging Difference in Glymphatic System between Motor Symptoms and Levodopa Responsiveness of Parkinson's Disease1Department of Radiology, The Second People's Hospital of Shenzhen, Shenzhen, China, 2Philips Healthcare, Guangzhou, China, 3Philips Healthcare, Shanghai, China, 4Philips Healthcare, Hongkong, China
Synopsis
Keywords: Parkinson's Disease, Parkinson's Disease, Glymphatic dysfunction, Motor symptoms, Imaging biomarkers
Motivation: Growing evidence has shown that glymphatic dysfunction is closely linked to Parkinson’s disease(PD), yet its imaging in glymphatic system with motor symptoms remains unclear.
Goal(s): Using three different imaging metrics to validate the association of the glymphatic system with motor symptoms before and after administration of exogenous levodopa, and levodopa responsiveness in PD.
Approach: The calculation of DTI-ALPS index, the automated quantification of PVSs of basal ganglia region (BG-PVSs) and choroid plexus volume (CPV) based on MRI.
Results: When DTI-ALPS index decreases and BG-PVSs and CPV increase, motor symptom gets worsen and levodopa effectiveness diminishes. Significant linear correlations were observed (CPV-DTI-ALPS, CPV-PVSs, DTI-ALPS-PVSs).
Impact: This study employed three distinct imaging metrics (DTI-ALPS index, automated PVSs quantification, and CPV) to provide a more comprehensive characterization of the glymphatic system, affirming a correlation between glymphatic dysfunction and motor symptoms in Parkinson's patients.
Introduction
Parkinson's disease (PD) is the second most common neurodegenerative disease. Recent studies have shown that dysfunction of the glymphatic system, which serves as the cerebrospinal fluid transport system responsible for the metabolism of waste products in the brain (1-2), leads to the accumulation of the associated proteins. The glymphatic pathway can be characterized through three main noninvasive modalities by MRI, including the ALPS index conducted diffusion tensor imaging (DTI), the enlargement of perivascular spaces (PVSs), and morphological changes of choroid plexus (CP). The aim of this study is to use three different imaging metrics to validate the association of the glymphatic system with motor symptoms before and after administration of exogenous levodopa, and levodopa responsiveness (%LR) in Parkinson's patients.Methods
Eighty-six Parkinson's patients were retrospectively collected. All subjects underwent routine MRI examinations and DTI scan on 3.0 MRI scanners with a 64-channel head coil (Prisma, Siemens Healthcare; Ingenia, Philips Healthcare). DTI was acuqired using the following parameters: consisted 32 different diffusion directions with b-value = 1000 s/mm², TE/TR = 64ms/8000ms; slice thickness = 2 mm; acquisition matrix = 244 × 244; FOV = 240 × 240 mm²; and. Analysis of imaging included the calculation of DTI-ALPS index (Fig.1), the automated quantification of PVSs of the bilateral basal ganglia region (BG-PVSs) (Fig.2) and choroid plexus volume (CPV ) conducted by Freesurfer software.All statistical analyses were performed using Stata, version 16. Comparisons between groups were conducted using independent samples t-tests or chi-square tests. Pearson's correlation analysis, linear regression analysis, and logistic regression analysis were employed to investigate the relationships between DTI-ALPS index, PVSs, and CPV, and factors such as age, the third part of the Unified Parkinson’s Disease Rating Scale score(UPDRSIII) before and after the administration of exogenous levodopa( “OFF” UPDRSIII, “ON” UPDRSIII) and levodopa responsiveness (%LR = (“OFF” UPDRSIII scores - “ON” UPDRSIII scores)/ “OFF” UPDRSIII scores *100%). P<.05 was considered statistically significant.
Results
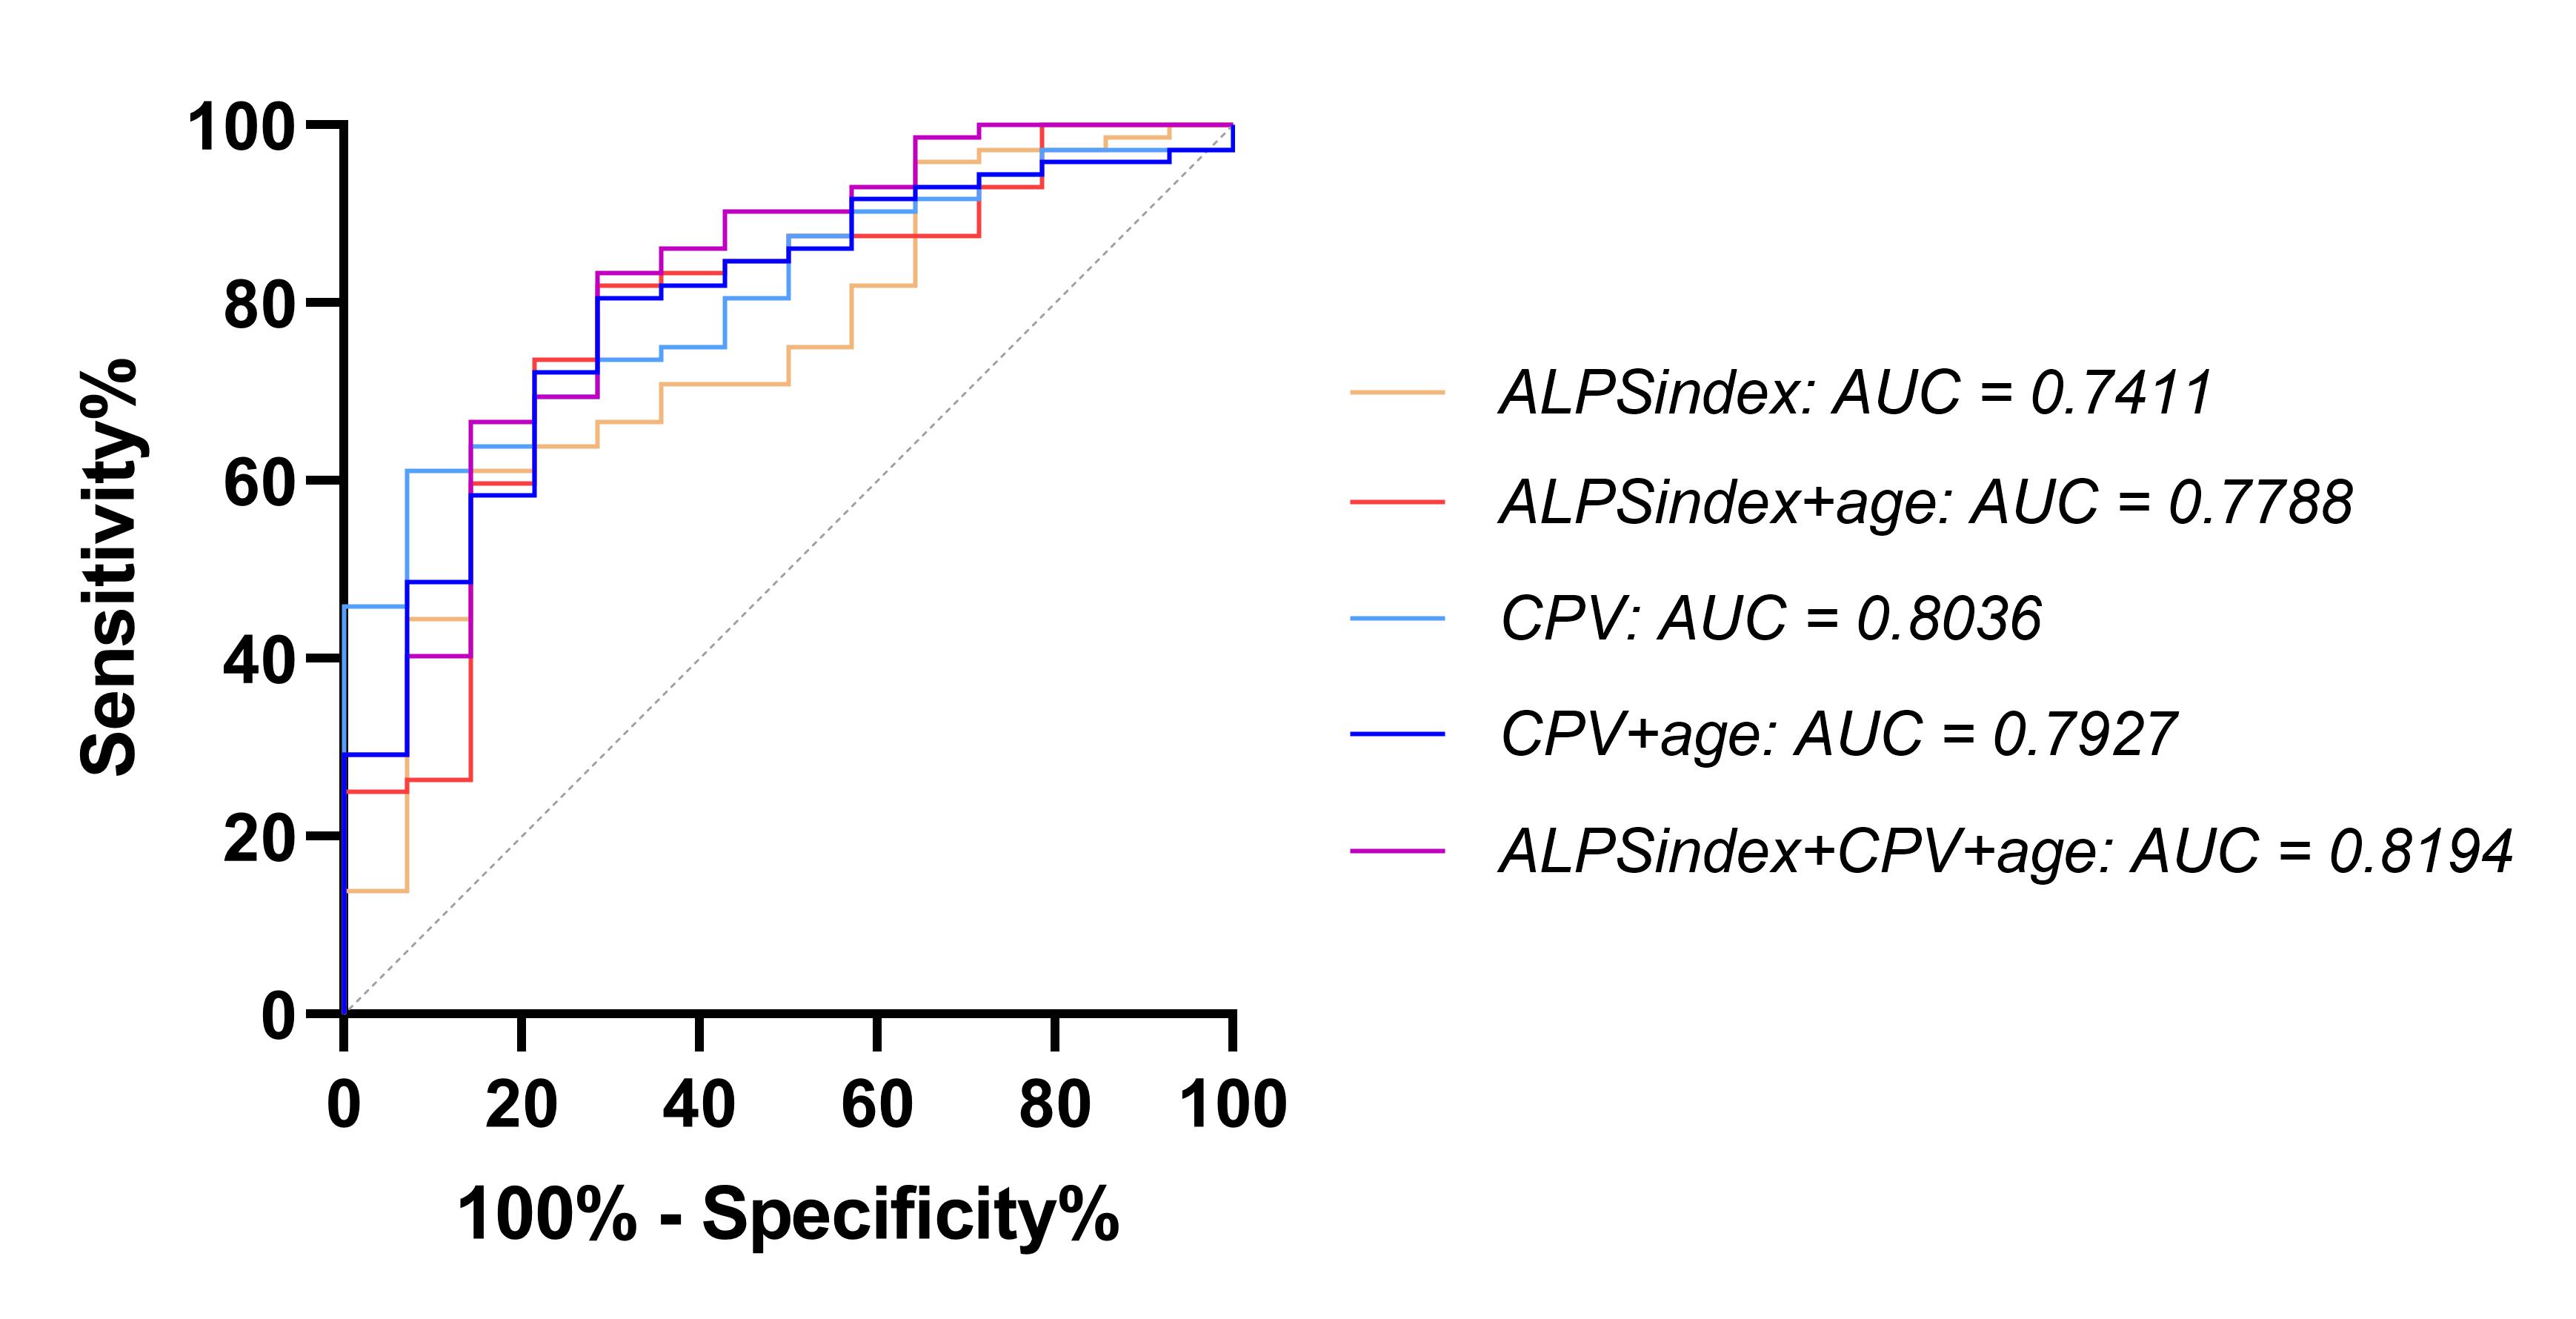
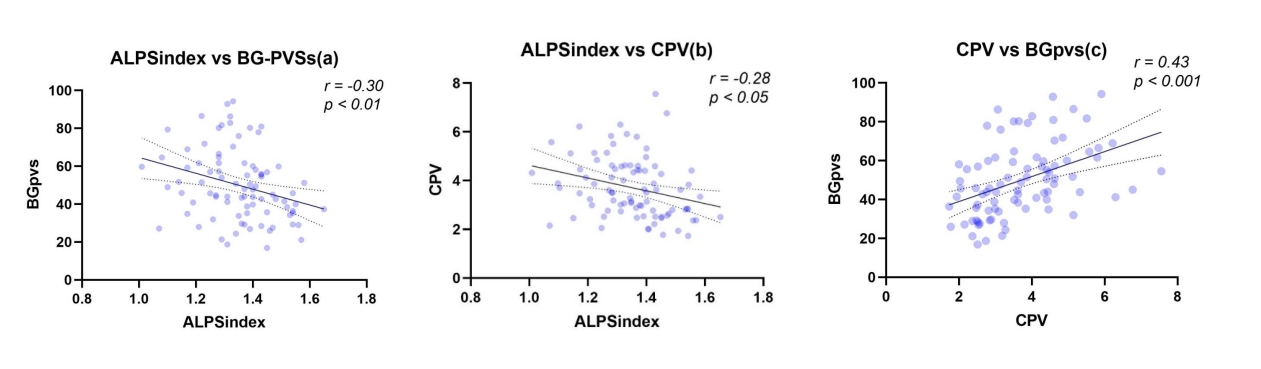
The “OFF” UPDRSIII negative correlated with DTI-ALPS index, positive correlated with BG-PVSs. After administration of exogenous levodopa, the “ON” UPDRSIII scores were correlated with the DTI-ALPS index negatively, correlated with BG-PVSs and CPV positively. %LR exhibited a positive linear correlation with DTI-ALPS index and negative linear correlations with both BG-PVSs and CPV(Fig.3). With a set %LR threshold of 30%, the DTI-ALPS index or CPV has a positive predictive value for the outcome of levodopa challenge test(LCT), with AUCs of 0.7788 (DTI-ALPS index), and 0.7927 (CPV), with accuracies of 86.05%, 81.40%. The prediction model created by combining the DTI-ALPS index and CPV had an AUC of 0.8194 and an accuracy of 87.21%(Fig.4). Significant linear correlations were observed (CPV-DTI-ALPS, CPV-PVSs, DTI-ALPS-PVSs) (Fig.5).Discussion
Our study indicates that DTI-ALPS index and BG-PVSs correlate with the UPDRSIII score, suggesting that as the glymphatic functional impairment intensifies, motor symptoms become more severe. Prior experimental studies have elucidated that glymphatic dysfunction influences motor function through diminishing AQP4 expression and α-synuclein accumulation, which lead to dopaminergic neuron degeneration, reduced dopamine secretion, and the emergence of motor symptoms (3-5). LCT is an important component of surgical screening for deep brain stimulation (6), with an indication for %LR less than 30% (7-9). The prediction model created by combining the DTI-ALPS index and CPV shows a high prediction value, which has the potential to be objective evidence for LCT and has some predictive ability for the outcome of the test.DTI-ALPS index, PVSs, and CPV characterize glymphatic circulation from different perspectives, and their close correlations with motor symptoms underscore the pivotal role of imaging dysfunction in the motor symptoms of PD, indicating a consistent portrayal of glymphatic function by these three parameters. However, the outcomes of three parameters perform differently with motor scores. The quantification of PVSs is based on the dilation of the extracellular spaces caused by disorders of the glymphatic system, which can be observed in various parts of the entire brain by MRI. While the assessment of the DTI-ALPS index is based on the diffusion rate of water molecules, which may already have changed and could be dected in the early stages of glymphatic disorder even though there are no noticeable changes in PVSs, but limited for fixation positions measuring. CP is pivotal in cerebrospinal fluid production, reflecting driving force behind glymphatic circulation. Its enlargement could be a compensatory outcome stemming from a glymphatic dysfunction(10-13).
Conclusion
Study affirms glymphatic impairment's link to motor symptoms and levodopa response in PD. As glymphatic function declines, symptoms get worsen and levodopa effectiveness diminishes. DTI-ALPS index and CPV emerge as potential predictors of PD patient LCT outcomes.Acknowledgements
The authors declare that they have no conflicts of interest. This work was supported by the Guangdong Basic and Applied Basic Research Foundation, No. 2021A1515220131.References
1. Klostranec JM, Vucevic D, Bhatia KD, et al. Current Concepts in Intracranial Interstitial Fluid Transport and the Glymphatic System: Part I-Anatomy and Physiology. Radiology. 2021;301(3):502–514. doi: 10.1148/radiol.2021202043.
2. Klostranec JM, Vucevic D, Bhatia KD, et al. Current Concepts in Intracranial Interstitial Fluid Transport and the Glymphatic System: Part II-Imaging Techniques and Clinical Applications. Radiology. 2021;301(3):516–532. doi: 10.1148/radiol.2021204088.
3. Anwar S, Peters O, Millership S, et al. Functional alterations to the nigrostriatal system in mice lacking all three members of the synuclein family. J Neurosci. 2011;31(20):7264–7274. doi: 10.1523/JNEUROSCI.6194-10.2011.
4. Logan T, Bendor J, Toupin C, Thorn K, Edwards RH. α-Synuclein promotes dilation of the exocytotic fusion pore. Nat Neurosci. 2017;20(5):681–689. doi: 10.1038/nn.4529.
5. Masato A, Plotegher N, Boassa D, Bubacco L. Impaired dopamine metabolism in Parkinson’s disease pathogenesis. Mol Neurodegener. 2019;14(1):35. doi: 10.1186/s13024-019-0332-6.
6. Saranza G, Lang AE. Levodopa challenge test: indications, protocol, and guide. J Neurol. 2021;268(9):3135–3143. doi: 10.1007/s00415-020-09810-7.
7. Defer GL, Widner H, Marié RM, Rémy P, Levivier M. Core assessment program for surgical interventional therapies in Parkinson’s disease (CAPSIT-PD). Mov Disord. 1999;14(4):572–584. doi: 10.1002/1531-8257(199907)14:4<572::aid-mds1005>3.0.co;2-c.
8. Merello M, Gerschcovich ER, Ballesteros D, Cerquetti D. Correlation between the Movement Disorders Society Unified Parkinson’s Disease rating scale (MDS-UPDRS) and the Unified Parkinson’s Disease rating scale (UPDRS) during L-dopa acute challenge. Parkinsonism Relat Disord. 2011;17(9):705–707. doi: 10.1016/j.parkreldis.2011.07.002.
9. Zheng Z, Yin Z, Zhang B, et al. Levodopa Challenge Test Predicts STN-DBS Outcomes in Various Parkinson’s Disease Motor Subtypes: A More Accurate Judgment. Neural Plast. 2021;2021:4762027. doi: 10.1155/2021/4762027.
10. Serot JM, Béné MC, Foliguet B, Faure GC. Morphological alterations of the choroid plexus in late-onset Alzheimer’s disease. Acta Neuropathol. 2000;99(2):105–108. doi: 10.1007/pl00007412.
11. Dietrich MO, Spuch C, Antequera D, et al. Megalin mediates the transport of leptin across the blood-CSF barrier. Neurobiol Aging. 2008;29(6):902–912. doi: 10.1016/j.neurobiolaging.2007.01.008.
12. Fishman RA. The cerebrospinal fluid production rate is reduced in dementia of the Alzheimer’s type. Neurology. 2002;58(12):1866; author reply 1866. doi: 10.1212/wnl.58.12.1866.
13. Christensen J, Li C, Mychasiuk R. Choroid plexus function in neurological homeostasis and disorders: The awakening of the circadian clocks and orexins. J Cereb Blood Flow Metab. 2022;42(7):1163–1175. doi: 10.1177/0271678X221082786.
14. Jenkinson M, Beckmann CF, Behrens TEJ, Woolrich MW, Smith SM. FSL. Neuroimage. 2012;62(2):782–790. doi: 10.1016/j.neuroimage.2011.09.015.
15. Boutinaud P, Tsuchida A, Laurent A, et al. 3D Segmentation of Perivascular Spaces on T1-Weighted 3 Tesla MR Images With a Convolutional Autoencoder and a U-Shaped Neural Network. Front Neuroinform. 2021;15:641600. doi: 10.3389/fninf.2021.641600.
Figures
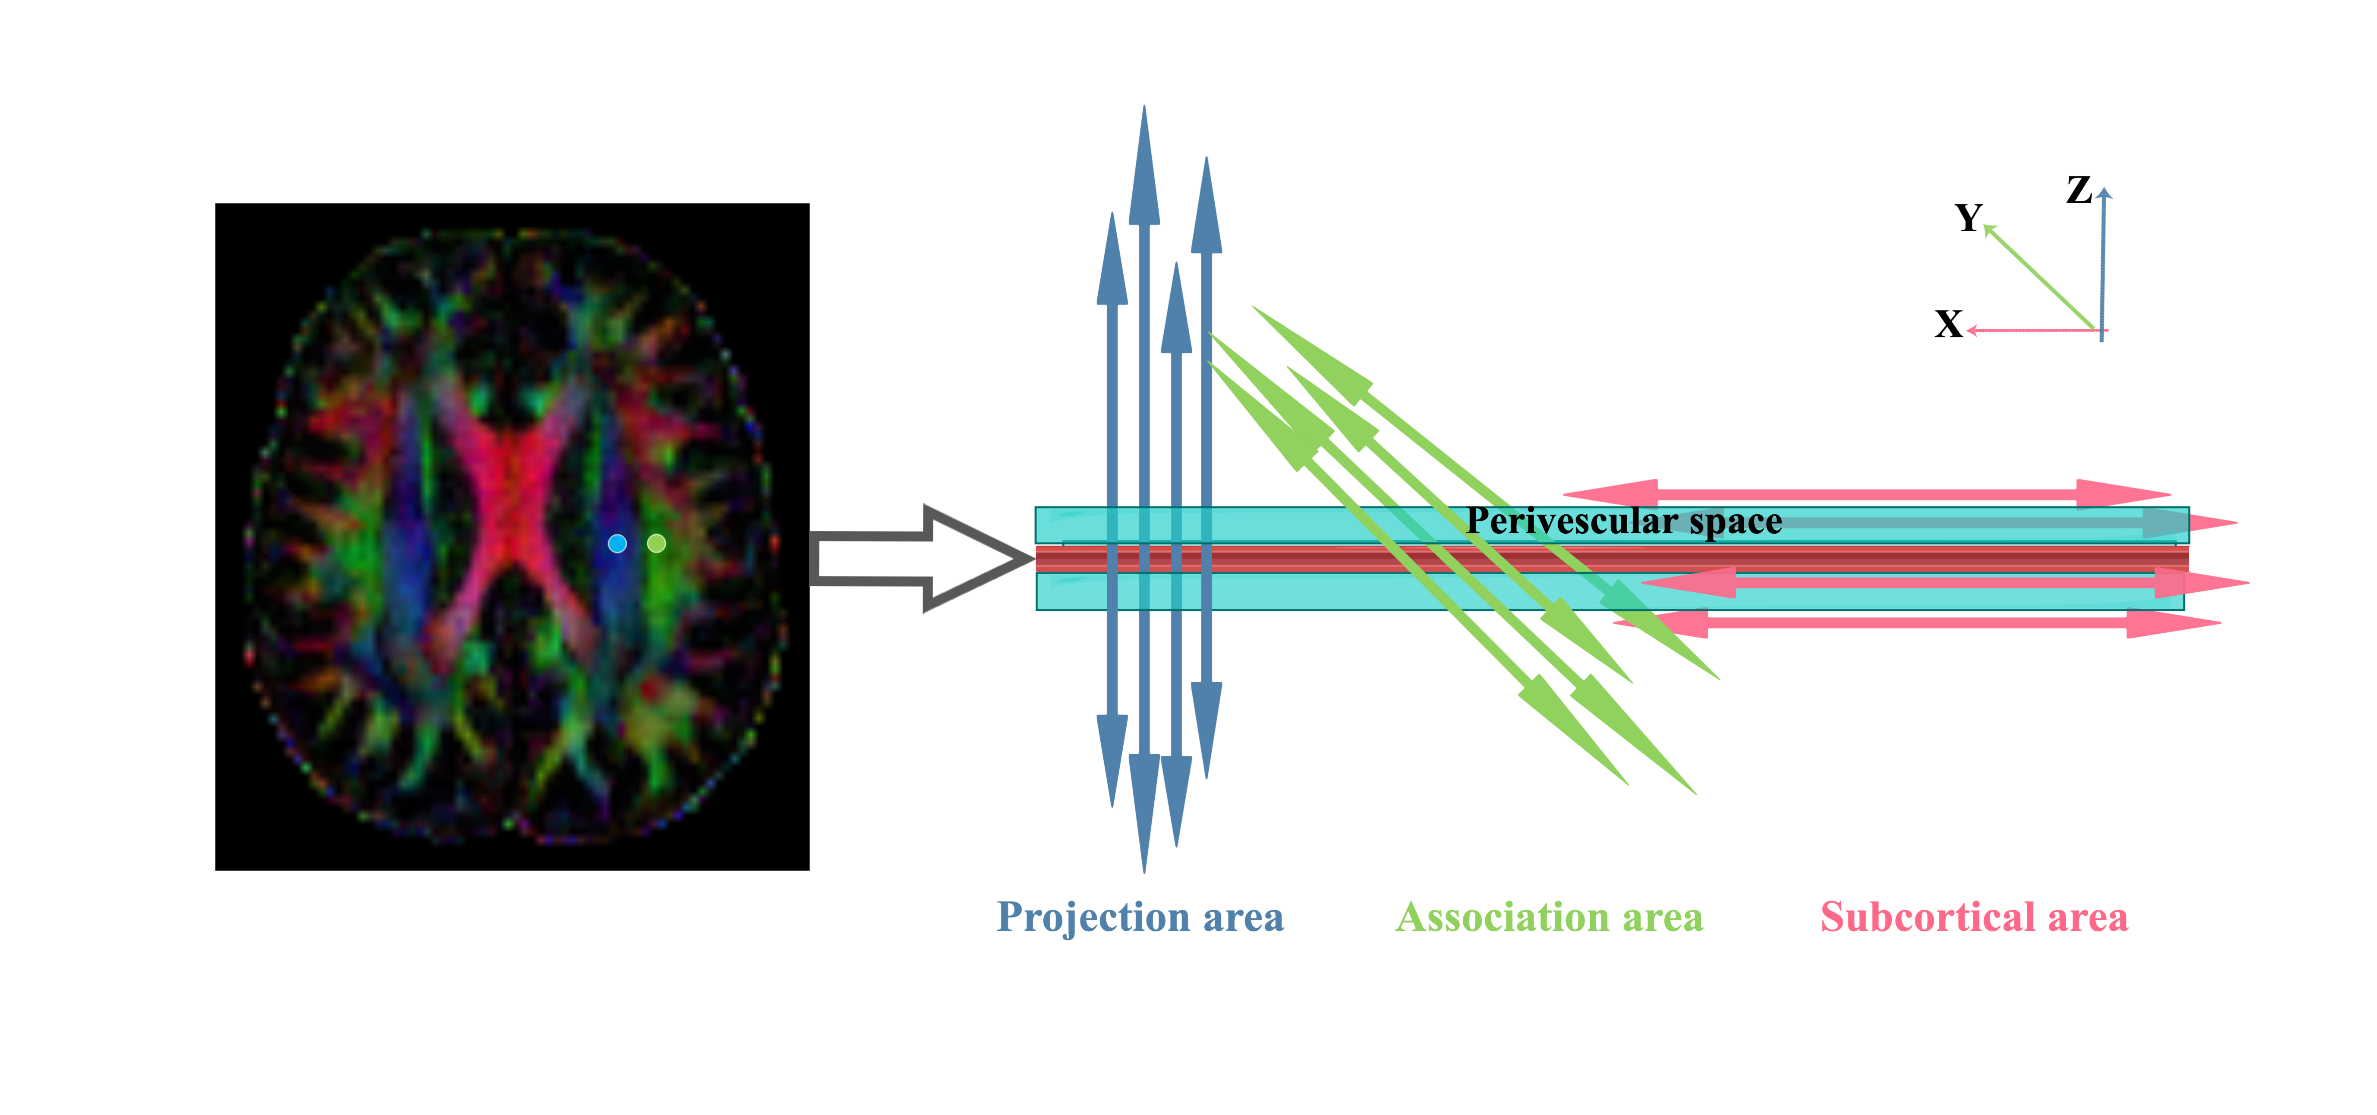
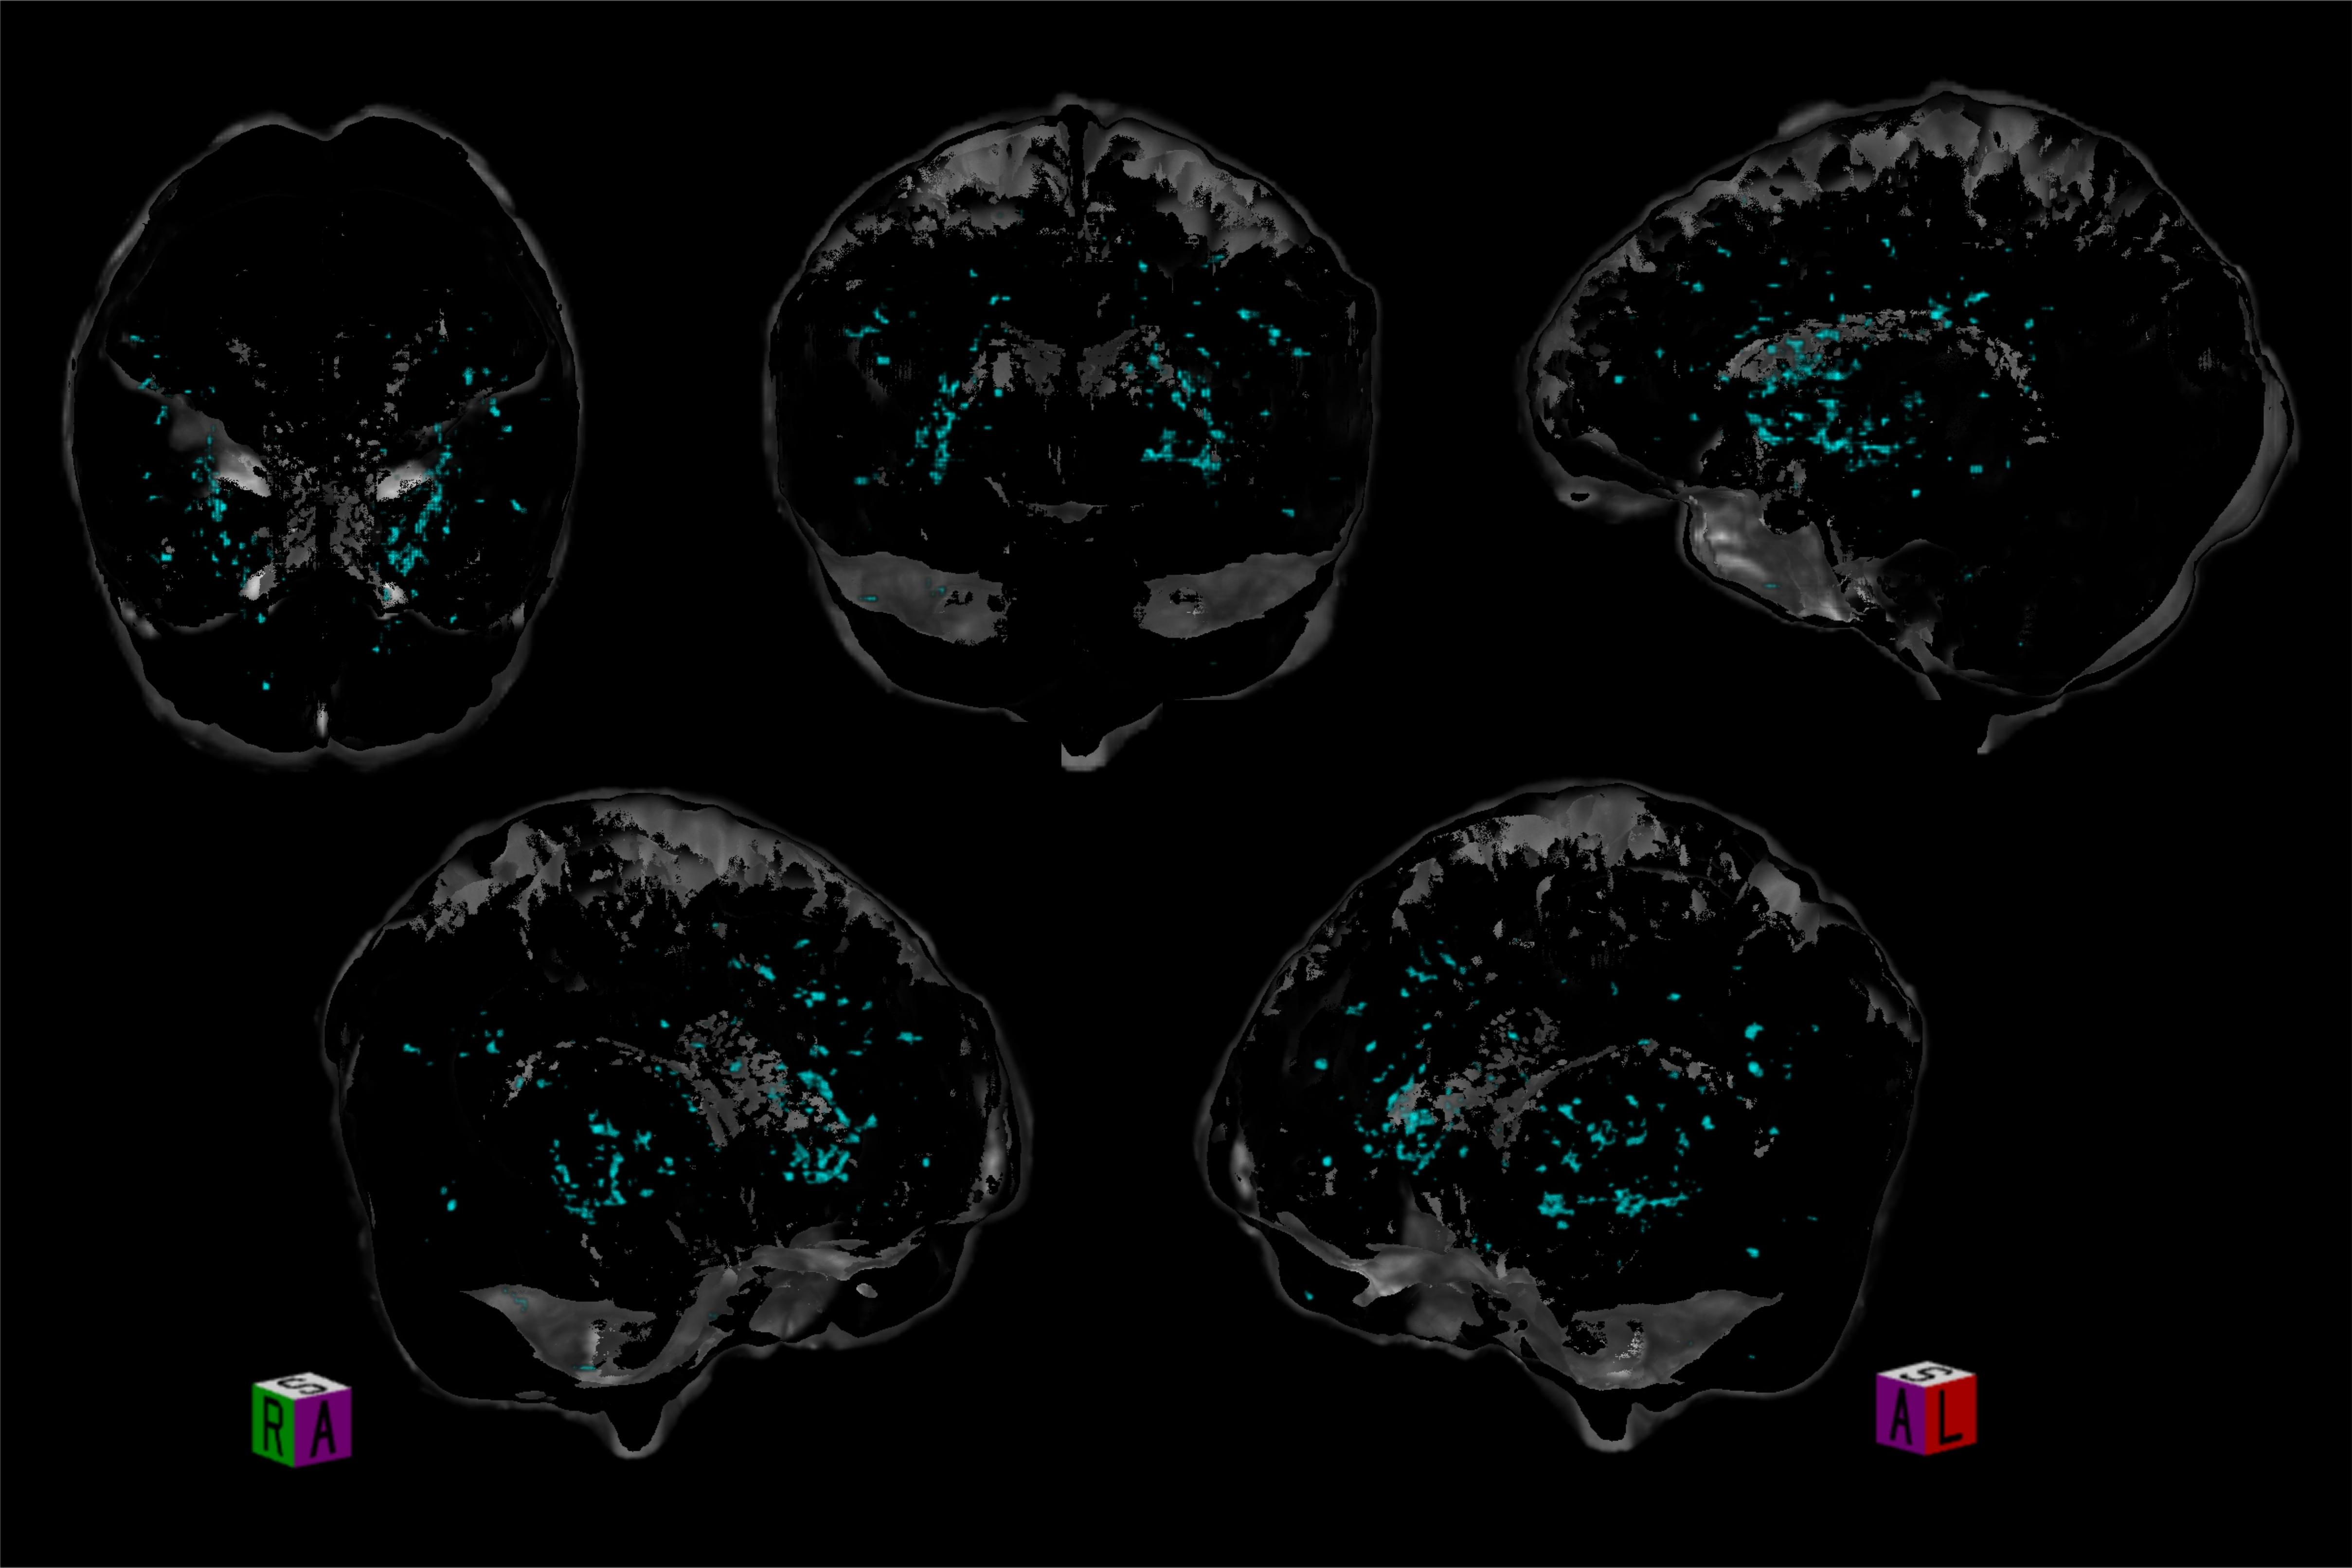
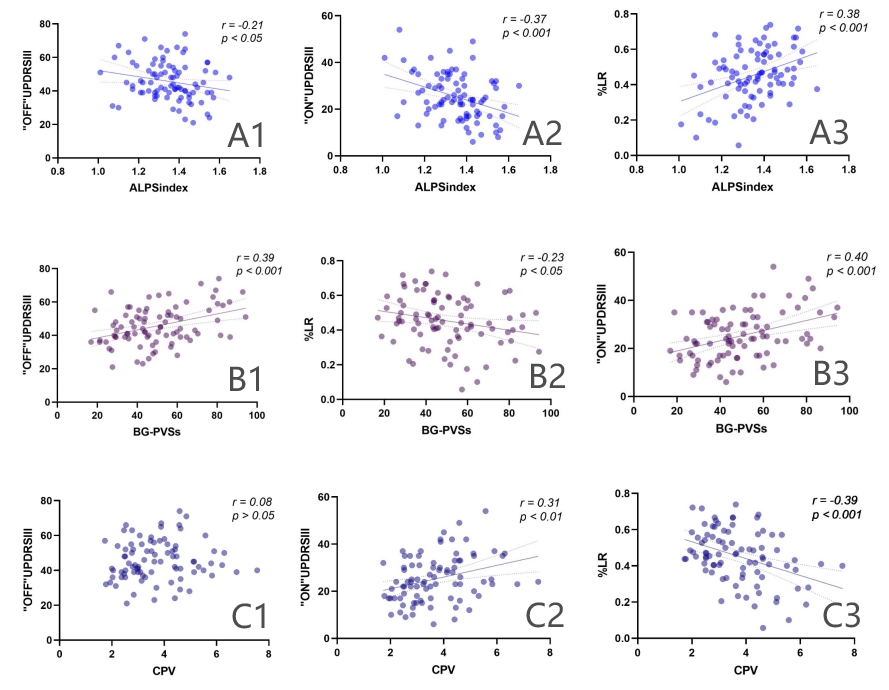
Fig.3 (A1-3) There is a significant linear relationship between ALPS-index with “OFF”UPDRSⅢ, ALPS-index with “ON”UPDRSⅢ, and ALPS-index with %LR.
(B1-3) There is a significant linear relationship between BG-PVSs with “OFF”UPDRSⅢ, BG-PVSs with “ON”UPDRSⅢ, and BG-PVSs with %LR.
(C1-3) There is no significant linear relationship for CPV vs “OFF” UPDRSⅢ. Significant linear relationship can be found between CPV with “ON”UPDRSⅢ, and CPV with %LR.
The correlation is significant at a 0.05 level.