2622
Systematic analysis of relaxometric constant in brain using temperature-dependent relaxometry and susceptibility: Toward 7T chi-separation1Department of Radiology and Radiological Science, Johns Hopkins University School of Medicine, Baltimore, MD, United States, 2F.M. Kirby Research Center for Functional Brain Imaging, Kennedy Krieger Research Institute, baltimore, MD, United States, 3Department of Pathology, Division of Neuropathology, Johns Hopkins University School of Medicine, Baltimore, MD, United States, 4Department of Electrical and Computer Engineering, Seoul National University, Seoul, Korea, Republic of, 5F.M. Kirby Research Center for Preclinical Imaging Facility, Kennedy Krieger Institute, baltimore, MD, United States, 6The Richman Family Precision Medicine Center of Excellence in Alzheimer's Disease, baltimore, MD, United States
Synopsis
Keywords: Susceptibility/QSM, Susceptibility
Motivation: Important physical parameter, relaxometric constant$$$\;{D_r}$$$, linking magnetic susceptibility to induced transverse relaxation acceleration (i.e.,$$$\;{R2'}$$$) has not yet been fully understood in brain.
Goal(s): To investigate underlying mechanisms affecting relaxometric constant in brain using temperature-dependent relaxometry and susceptibility and explore a better field-strength correction for ultra-high-field MRI.
Approach: 3T and 7T R2*/R2'/quantitative-susceptibility maps were acquired from a post-mortem brain at different temperatures and analyzed based on the physical model.
Results: In human brain, effects of temperature-dependent water susceptibility, water diffusion, and field strength on Dr were observed, and a field-strength correction coefficient was calculated, generating consistent chi-separation maps at both 3T and 7T.
Impact: A better understanding of relaxometric constant in brain can provide better insight on effects of susceptibility sources (e.g., iron and myelin), on MR relaxometry, improving quantification accuracy of those biological substances using MRI.
Introduction
Recent developments on magnetic susceptibility source separation1–3 have demonstrated the potential to give more specific measures of tissue iron and myelin4. Most susceptibility source separation methods rely on a relaxometric constant (Dr) linking magnetic susceptibility sources (𝜒para and 𝜒dia) to their induced reversable relaxation (R2’). This Dr constant was previously determined empirically in in-vivo brain at 3T, using R2’ and susceptibility measures in basal ganglia where iron is the known dominant source1. Theoretically maximum Dr ignoring diffusion effects (324 Hz/ppm @3T5) or iterative fitted values have also been used3,6. Theoretically, such relaxometric constant is expected to be dependent on field strength,2,5 temperature7,8, and the underlying susceptibility source geometry (size/shape/etc.)5, but have not been physically measured in human tissues in a systematic way.Methods
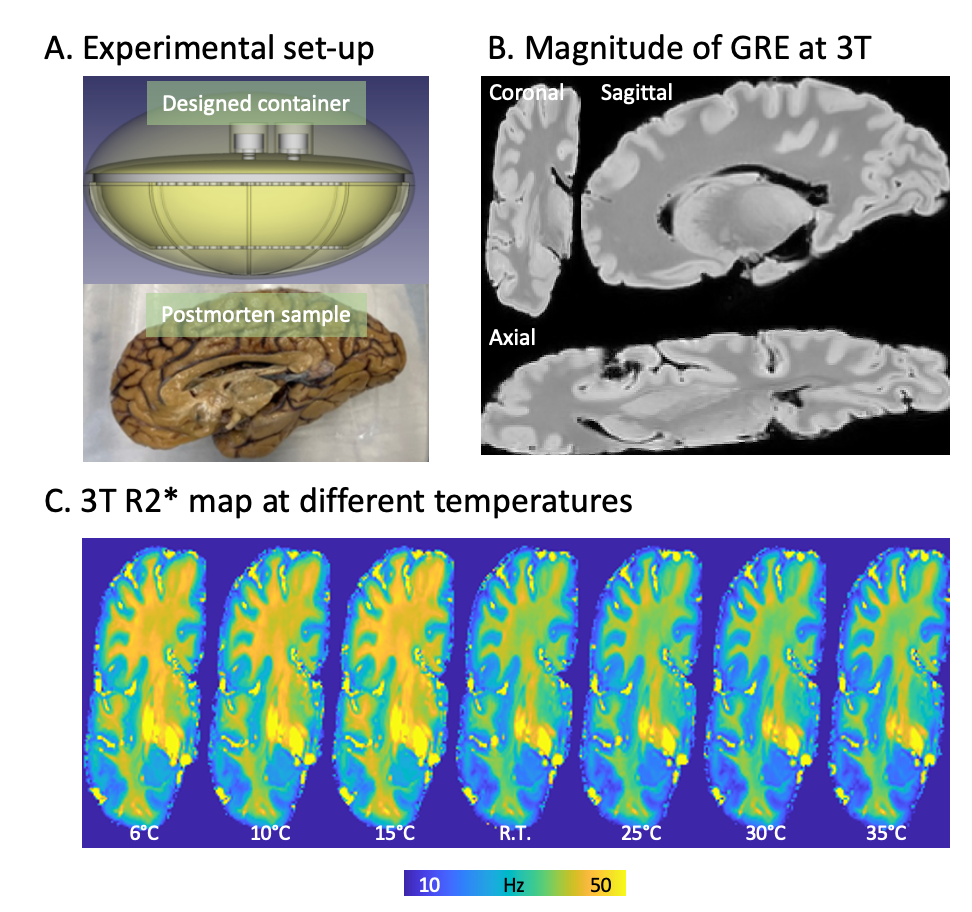
[Temperature-dependent transverse relaxation and bulk susceptibility]Assume a voxel including two types of susceptibility inclusions with opposite sign, like diamagnetic myelin and paramagnetic iron in brain. In static dephasing regime, bulk susceptibility and R2' (sensitized by water) can be described1,5:$$\\{\chi_{bulk}}={\zeta_{para}}{\triangle\chi_{para}}+{\zeta_{dia}}{\triangle\chi_{dia}}\\={\zeta_{para}}{\chi_{para,inc}}+{\zeta_{dia}}{\chi_{dia,inc}}-(\zeta_{para}+\zeta_{dia}){\chi_{water}}\;\;\;\;\;\;[Eq.1]\\R2'={D_{r,para}}{\zeta_{para}}{\triangle\chi_{para}}+{D_{r,dia}}{\zeta_{dia}}{\triangle\chi_{dia}}\\={D_{r,para}}{\zeta_{para}}{\chi_{para,inc}}-{D_{r,dia}}{\zeta_{dia}}{\chi_{dia,inc}}-({D_{r,para}}\zeta_{para}-{D_{r,dia}}\zeta_{dia}){\chi_{water}}\;\;\;\;\;\;[Eq.2]\\where\\{\triangle\chi_{para}}={\chi_{para,inc}}-{\chi_{water}}\\{\triangle\chi_{dia}}={\chi_{dia,inc}}-{\chi_{water}}\\{\chi_{water}}:magnetic\;susceptibility\;of\;water,\\{\chi_{para,inc}}=magnetic\;susceptibility\;of\;paramagnetic\;inclusion\;({\chi_{para,inc}}>{\chi_{water}})\\{\chi_{dia,inc}}=magnetic\;susceptibility\;of\;diamagnetic\;inclusion\;({\chi_{dia,inc}}<{\chi_{water}})\\\zeta=volume\;fraction\;of\;susceptibility\;inclusion\\D_r=relaxometric\;constant\;for\;susceptibility\;inclusion\\$$. These equations suggest that when paramagnetism and diamagnetism colocalize, temperature dependency in $$$\;{\chi_{bulk}}\;$$$and R2' cannot describe solely by paramagnetism (a.k.a Curie's law), unlike the previous studies7,8,12, rendering effects of diamagnetism on both R2' and$$$\;{\chi_{bulk}}\;$$$ due to temperature dependent $$$\;{\chi_{water}}\;$$$. Relaxometric constant Dr is a complex function of source geometry/diffusivity/field strength1,5,13. Nevertheless, the combination of Eq.1 and 2 still offers opportunity to assess Dr when there is a single susceptibility source.$$\\$$[Data Acquisition]A fixed postmortem hemibrain (57y/male) was scanned at 3T and 7T at 7 different tissue temperatures (6-35°C). MRI for each temperature included multi-orientational multi-echo gradient echo for R2* and local frequency map (MEGE; resolution=1-mm-isotropic, TR/TE/ΔTE@3T=40/7/7ms[4-echo], TR/TE/ΔTE@7T=40/3/3ms[5-echo], 4 orientations per temperature) and multi-echo spin-echo for R2 (resolution=2-mm-isotropic, TE/ΔTE@3T=11/11ms[8-echo], TE/ΔTE@3T=12/12m[5-echo]). To minimize B0 field inhomogeneity, a 3D-printed brain container were utilized (Fig.1).$$\\$$[Processing]Per temperature, R2 map and multi-orientation local frequency and R2* maps were reconstructed and co-registered.$$$\;{\chi_{bulk}}\;$$$was estimated using COSMOS9 (CSF-referenced), and R2' by subtracting R2 from orientationally-averaged R2*.$$\\$$[ROI analysis]Six gray matter ROIs were segmented using SynthSeg17 and 17 white matter ROIs were manually segmented.Results
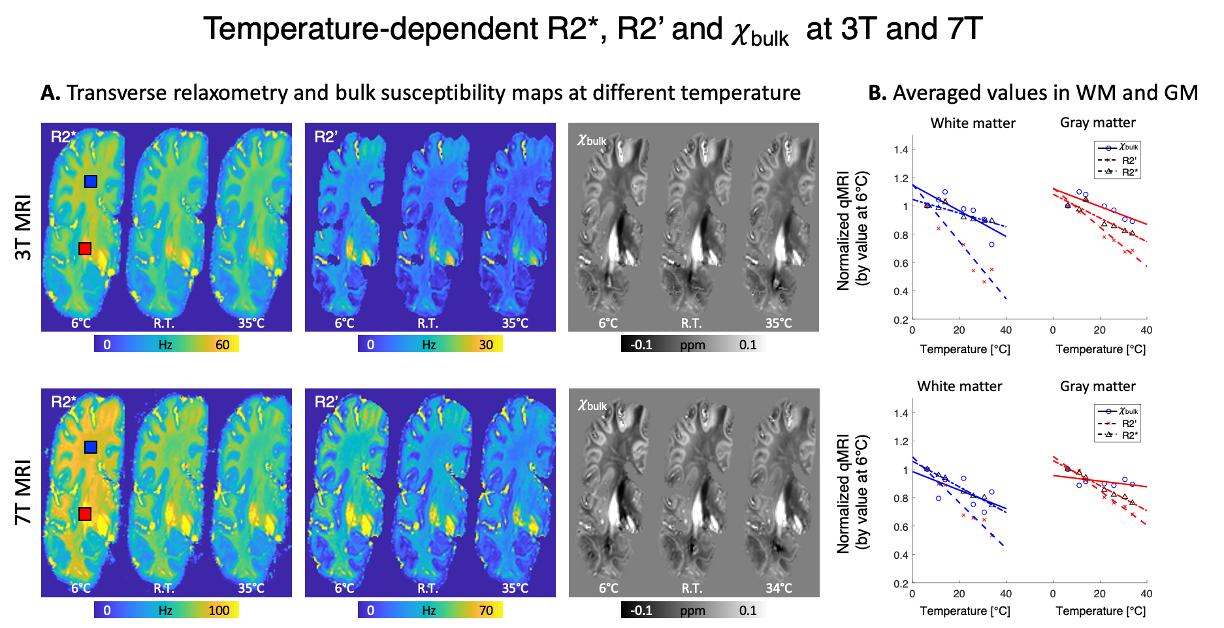
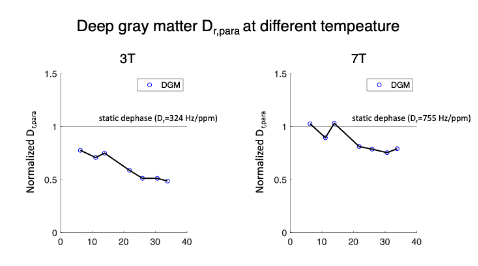
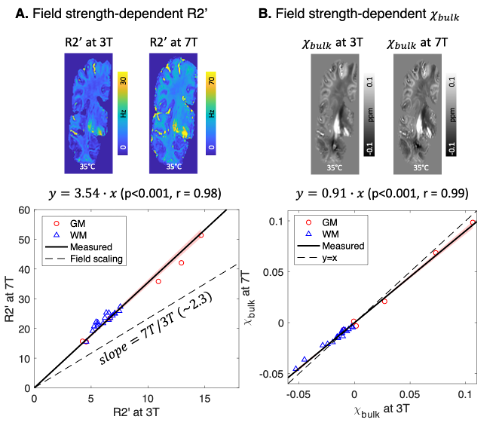
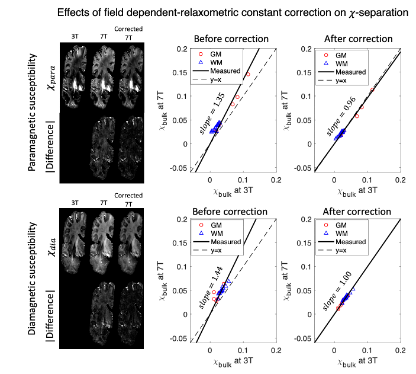
Fig.2. shows R2'/R2*/𝜒bulk, measured at different temperatures at different field strengths. While both relaxometry and susceptibility maps reveal changes with temperature (Fig.2A), 𝜒bulk shows consistent temperature dependency and contrast, independent on field strength but relaxometry shows different temperature dependency between field strengths as well as between measurement methods (R2' vs. R2*), as expected by theory. Notably, 𝜒bulk shows increase with temperature, which has not yet been reported, suggesting the contribution of temperature-dependent water susceptibility (Fig.2B; note 𝜒bulk in white matter is normalized by negative value).$$\\$$When investigating relaxometric constant in DGM where tissue susceptibility is dominated by a single susceptibility source (paramagnetic iron), Dr,para exhibits dependency on both field strength and temperature (Fig.3). Given diffusivity independent on field strength, enlarged normalized Dr,para values at 7T compared to 3T indicate super-linear increase in R2' over field strength13,18. This agrees with theory on an increasing effect of static dephasing in higher field13,18 (becoming ideal static dephasing regime5), necessitating an additional consideration on field dependency in relaxometric constant. In addition, the results highlight the relaxometric constant around body temperature is much lower than one assumed in static dephasing regime (48% @3T and 78% @7T), consistent with previous observation1.$$\\$$When R2' and 𝜒bulk are compared between 3T and 7T, 7T R2' shows higher values than that expected from 3T with field strength scaling, while 𝜒bulk is in good agreement with theoretical expectation (Fig. 4). This higher 7T R2' values over theoretical expectation is also consistent with the super-linear behavior of Dr over field strength observed in Fig.3. Additionally, strong linearity between R2s or between 𝜒bulk at different field strengths without intercept (p<0.01) shows the feasibility of linear modelling using Dr for chi-separation at both 3T and 7T, suggesting piece-wise linear approximation of R2'-field strength relationship between 3T and 7T.$$\\$$Fig.5. shows 3T/7T chi-separation results using measured 3T Dr values. When Dr is scaled for 7T according to field strength (=7T/3T), both chi-para and chi-para maps show overestimation compared to 3T results. Conversely, using Dr scaled by the corrected scaling factor in Fig.4, 7T chi-separation results agree better to those at 3T, indicating the efficacy of correction for non-linear field strength dependency. The measured 3T Dr in the brain sample is 157 Hz/ppm.Conclusion
We systematically analyzed the relaxometric constant in brain by measuring temperature- and field strength-dependent relaxometry and susceptibility, proposing field-strength correction to acquire more accurate brain chi-separation results at 7T.Acknowledgements
This work is supported by NIH NIBIB (P41EB031771), the Richman Family Precision Medicine Center of Excellence in Alzheimer's Disease including significant contributions from the Richman Family Foundation, the Rick Sharp Alzheimer’s Foundation, the Sharp Family Foundation and others. Kenichi Oishi is a consultant for “AnatomyWorks” and “Corporate-M.” Peter van Zijl has research support from and technology licensed to Philips Healthcare and has also been a paid speaker. This arrangement is being managed by the Johns Hopkins University in accordance with its conflict-of-interest policies.References
1. Shin HG, Lee J, Yun YH, et al. χ-separation: Magnetic susceptibility source separation toward iron and myelin mapping in the brain. NeuroImage. 2021;240:118371. doi:10.1016/j.neuroimage.2021.1183712. Emmerich J, Bachert P, Ladd ME, Straub S. On the separation of susceptibility sources in quantitative susceptibility mapping: Theory and phantom validation with an in vivo application to multiple sclerosis lesions of different age. J Magn Reson. 2021;330:107033. doi:10.1016/j.jmr.2021.1070333. Chen J, Gong NJ, Chaim KT, Otaduy MCG, Liu C. Decompose quantitative susceptibility mapping (QSM) to sub-voxel diamagnetic and paramagnetic components based on gradient-echo MRI data. Neuroimage. 2021;242:118477. doi:10.1016/j.neuroimage.2021.1184774. Kim W, Shin HG, Lee H, et al. χ-Separation Imaging for Diagnosis of Multiple Sclerosis versus Neuromyelitis Optica Spectrum Disorder. Radiology. 2022:220941. doi:10.1148/radiol.2209415. Yablonskiy DA, Haacke EM. Theory of NMR signal behavior in magnetically inhomogeneous tissues: The static dephasing regime. Magnet Reson Med. 1994;32(6):749 763. doi:10.1002/mrm.19103206106. Li Z, Feng R, Liu Q, et al. APART-QSM: An improved sub-voxel quantitative susceptibility mapping for susceptibility source separation using an iterative data fitting method. NeuroImage. 2023;274:120148. doi:10.1016/j.neuroimage.2023.1201487. Birkl C, Langkammer C, Krenn H, et al. Iron mapping using the temperature dependency of the magnetic susceptibility. Magnet Reson Med. 2015;73(3):1282-1288. doi:10.1002/mrm.252368. Birkl C, Carassiti D, Hussain F, et al. Assessment of ferritin content in multiple sclerosis brains using temperature-induced R* 2 changes: Assessment of Ferritin Content in Multiple Sclerosis Brains via TcR2*. Magnet Reson Med. 2017;79(3):1609-1615. doi:10.1002/mrm.267809. Liu T, Spincemaille P, Rochefort L de, Kressler B, Wang Y. Calculation of susceptibility through multiple orientation sampling (COSMOS): A method for conditioning the inverse problem from measured magnetic field map to susceptibility source image in MRI. Magnet Reson Med. 2009;61(1):196-204. doi:10.1002/mrm.2182810. Cini R, Torrini M. Temperature Dependence of the Magnetic Susceptibility of Water. J Chem Phys. 1968;49(6):2826-2830. doi:10.1063/1.167049111. Duyn JH, Schenck J. Contributions to magnetic susceptibility of brain tissue. Nmr Biomed. 2017;30(4):e3546. doi:10.1002/nbm.354612. Kan H, Uchida Y, Arai N, et al. Decreasing iron susceptibility with temperature in quantitative susceptibility mapping: A phantom study. Magn Reson Imaging. 2020;73:55-61. doi:10.1016/j.mri.2020.08.01213. Turner R, Jezzard P, Wen H, et al. Functional mapping of the human visual cortex at 4 and 1.5 tesla using deoxygenation contrast EPI. Magn Reson Med. 1993;29(2):277-279. doi:10.1002/mrm.191029022114. Abdul-Rahman HS, Gdeisat MA, Burton DR, Lalor MJ, Lilley F, Moore CJ. Fast and robust three-dimensional best path phase unwrapping algorithm. Appl Opt. 2007;46(26):6623-6635. doi:10.1364/ao.46.00662315. Wu B, Li W, Avram AV, Gho SM, Liu C. Fast and tissue-optimized mapping of magnetic susceptibility and T2* with multi-echo and multi-shot spirals. NeuroImage. 2012;59(1):297-305. doi:10.1016/j.neuroimage.2011.07.01916. Wu B, Li W, Guidon A, Liu C. Whole brain susceptibility mapping using compressed sensing. Magnet Reson Med. 2012;67(1):137 147. doi:10.1002/mrm.2300017. Billot B, Greve DN, Puonti O, et al. SynthSeg: Segmentation of brain MRI scans of any contrast and resolution without retraining. Méd Image Anal. 2023;86:102789. doi:10.1016/j.media.2023.10278918. Peters AM, Brookes MJ, Hoogenraad FG, et al. T2* measurements in human brain at 1.5, 3 and 7 T. Magn Reson Imaging. 2007;25(6):748-753. doi:10.1016/j.mri.2007.02.014Figures