2621
LoopNet: A New Baseline Network for QSM Dipole Inversion1School of Computer Science and Engineering, Central South University, Changsha, China, 2School of EECS, The University of Queensland, Brisbane, Australia
Synopsis
Keywords: Susceptibility/QSM, Quantitative Susceptibility mapping, LoopNet, Bidirectional U-net, QSM dipole inversion
Motivation: Most current deep learning (DL) QSM methods were developed based on U-net, whose performances might not be sufficiently good.
Goal(s): To proposed a new network baseline for deep learning QSM methods development.
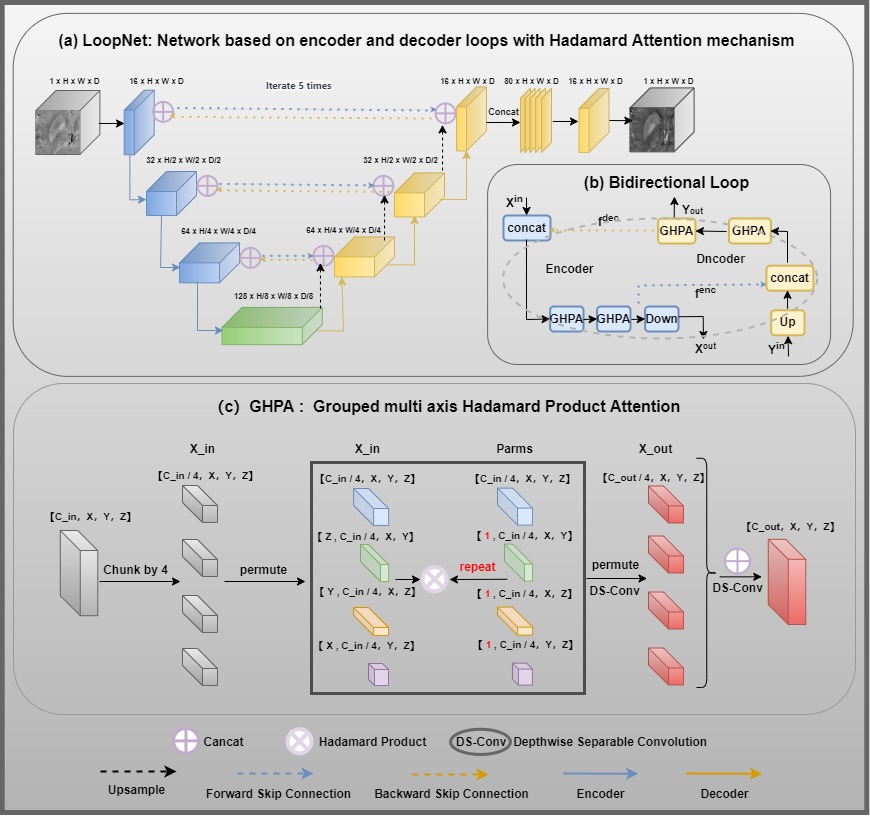
Approach: We developed a LoopNet, by applying the proposed bidirectional loop and a self-tailored GHPA attention module into a Unet backbone, making better use of the latent information in deep networks.
Results: Simulated and in vivo experiments showed that the propoed LoopNet led to improved results than U-net.
Impact: This work introduces a novel deep neural network backbone, allowing researchers to develop innovative QSM methods easily by upgrading their original U-net to LoopNet, thanks to the plug-and-play design.
Introduction
QSM is a valuable technique that can calculate tissue susceptibility distribution from MRI phases. However, the QSM dipole inversion is a mathematically ill-posed inverse problem. Many deep learning (DL) algorithms [1-3] have been developed based on the conventional U-net [4] backbone. In this work, we proposed a novel baseline network, named LoopNet, for DLQSM reconstruction from the local field data. The LoopNet has more efficient information (hidden features) usage dataflow compared with traditional U-net. The major contribution is the introduction of a “reverse” concatenation connection from the U-net’s expanding path to the extracting path as well as a tailored Grouped multi-axis Hadamard Product Attention (GHPA) module, which is a memory-efficient to capture long-range information, which may be beneficial for QSM reconstruction from local field data. We conducted both simulated and in vivo experiments to validate the performances of the proposed LoopNet.Method
LoopNet ArchitectureAs shown in Fig. 1(a), the proposed LoopNet was constructed based on a U-net backbone by adding a reverse concatenation connection from the expanding path of the U-net to the previous layers, thus forming a bidirectional loop (Fig. 1(b)). The GHPA is shown in Fig 1(c), which is designed to capture long-range information in the latent features. Different from conventional U-nets, LoopNet iterates the U-net body several times to make full use of the encoded latent maps, and the U-net extracting and expanding paths were shared for each iteration. The U-net backbone comprises 19 convolutional layers, 8GHPA modules, 18 batch normalization layers, 4 max-pooling, 4 unpooling layers, 4 forward concatenation layers, 4 reverse concatenation connections, and a final skip connection.
Training data preparation and network training
A total of 14400 cropped small patches (size: 483) were generated from 96 in vivo QSM subjects. The training inputs were the local field data simulated from the QSM label patches using the QSM forward model. All network parameters were initialized with random numbers drawn from a normal distribution with a mean of 0 and a standard deviation of 0.01. Subsequently, training for all networks was conducted for 100 epochs on two Nvidia Tesla A6000 GPUs using the Adam optimizer. The learning rate was set to 0.001, and mean-squared-error was employed as the loss function.
Validation on simulated and in vivo datasets
In this study, we compared our proposed LoopNet with several existing methods, including DL-based xQSM [1], QSMNet [2], LPCNN [3], and traditional iLSQR [5]. Simulated data generated based on a COSMOS label, and the in vivo data from two patients with intracranial hemorrhage acquired at 3T were adopted to investigate the performance of the proposed LoopNet.
Results
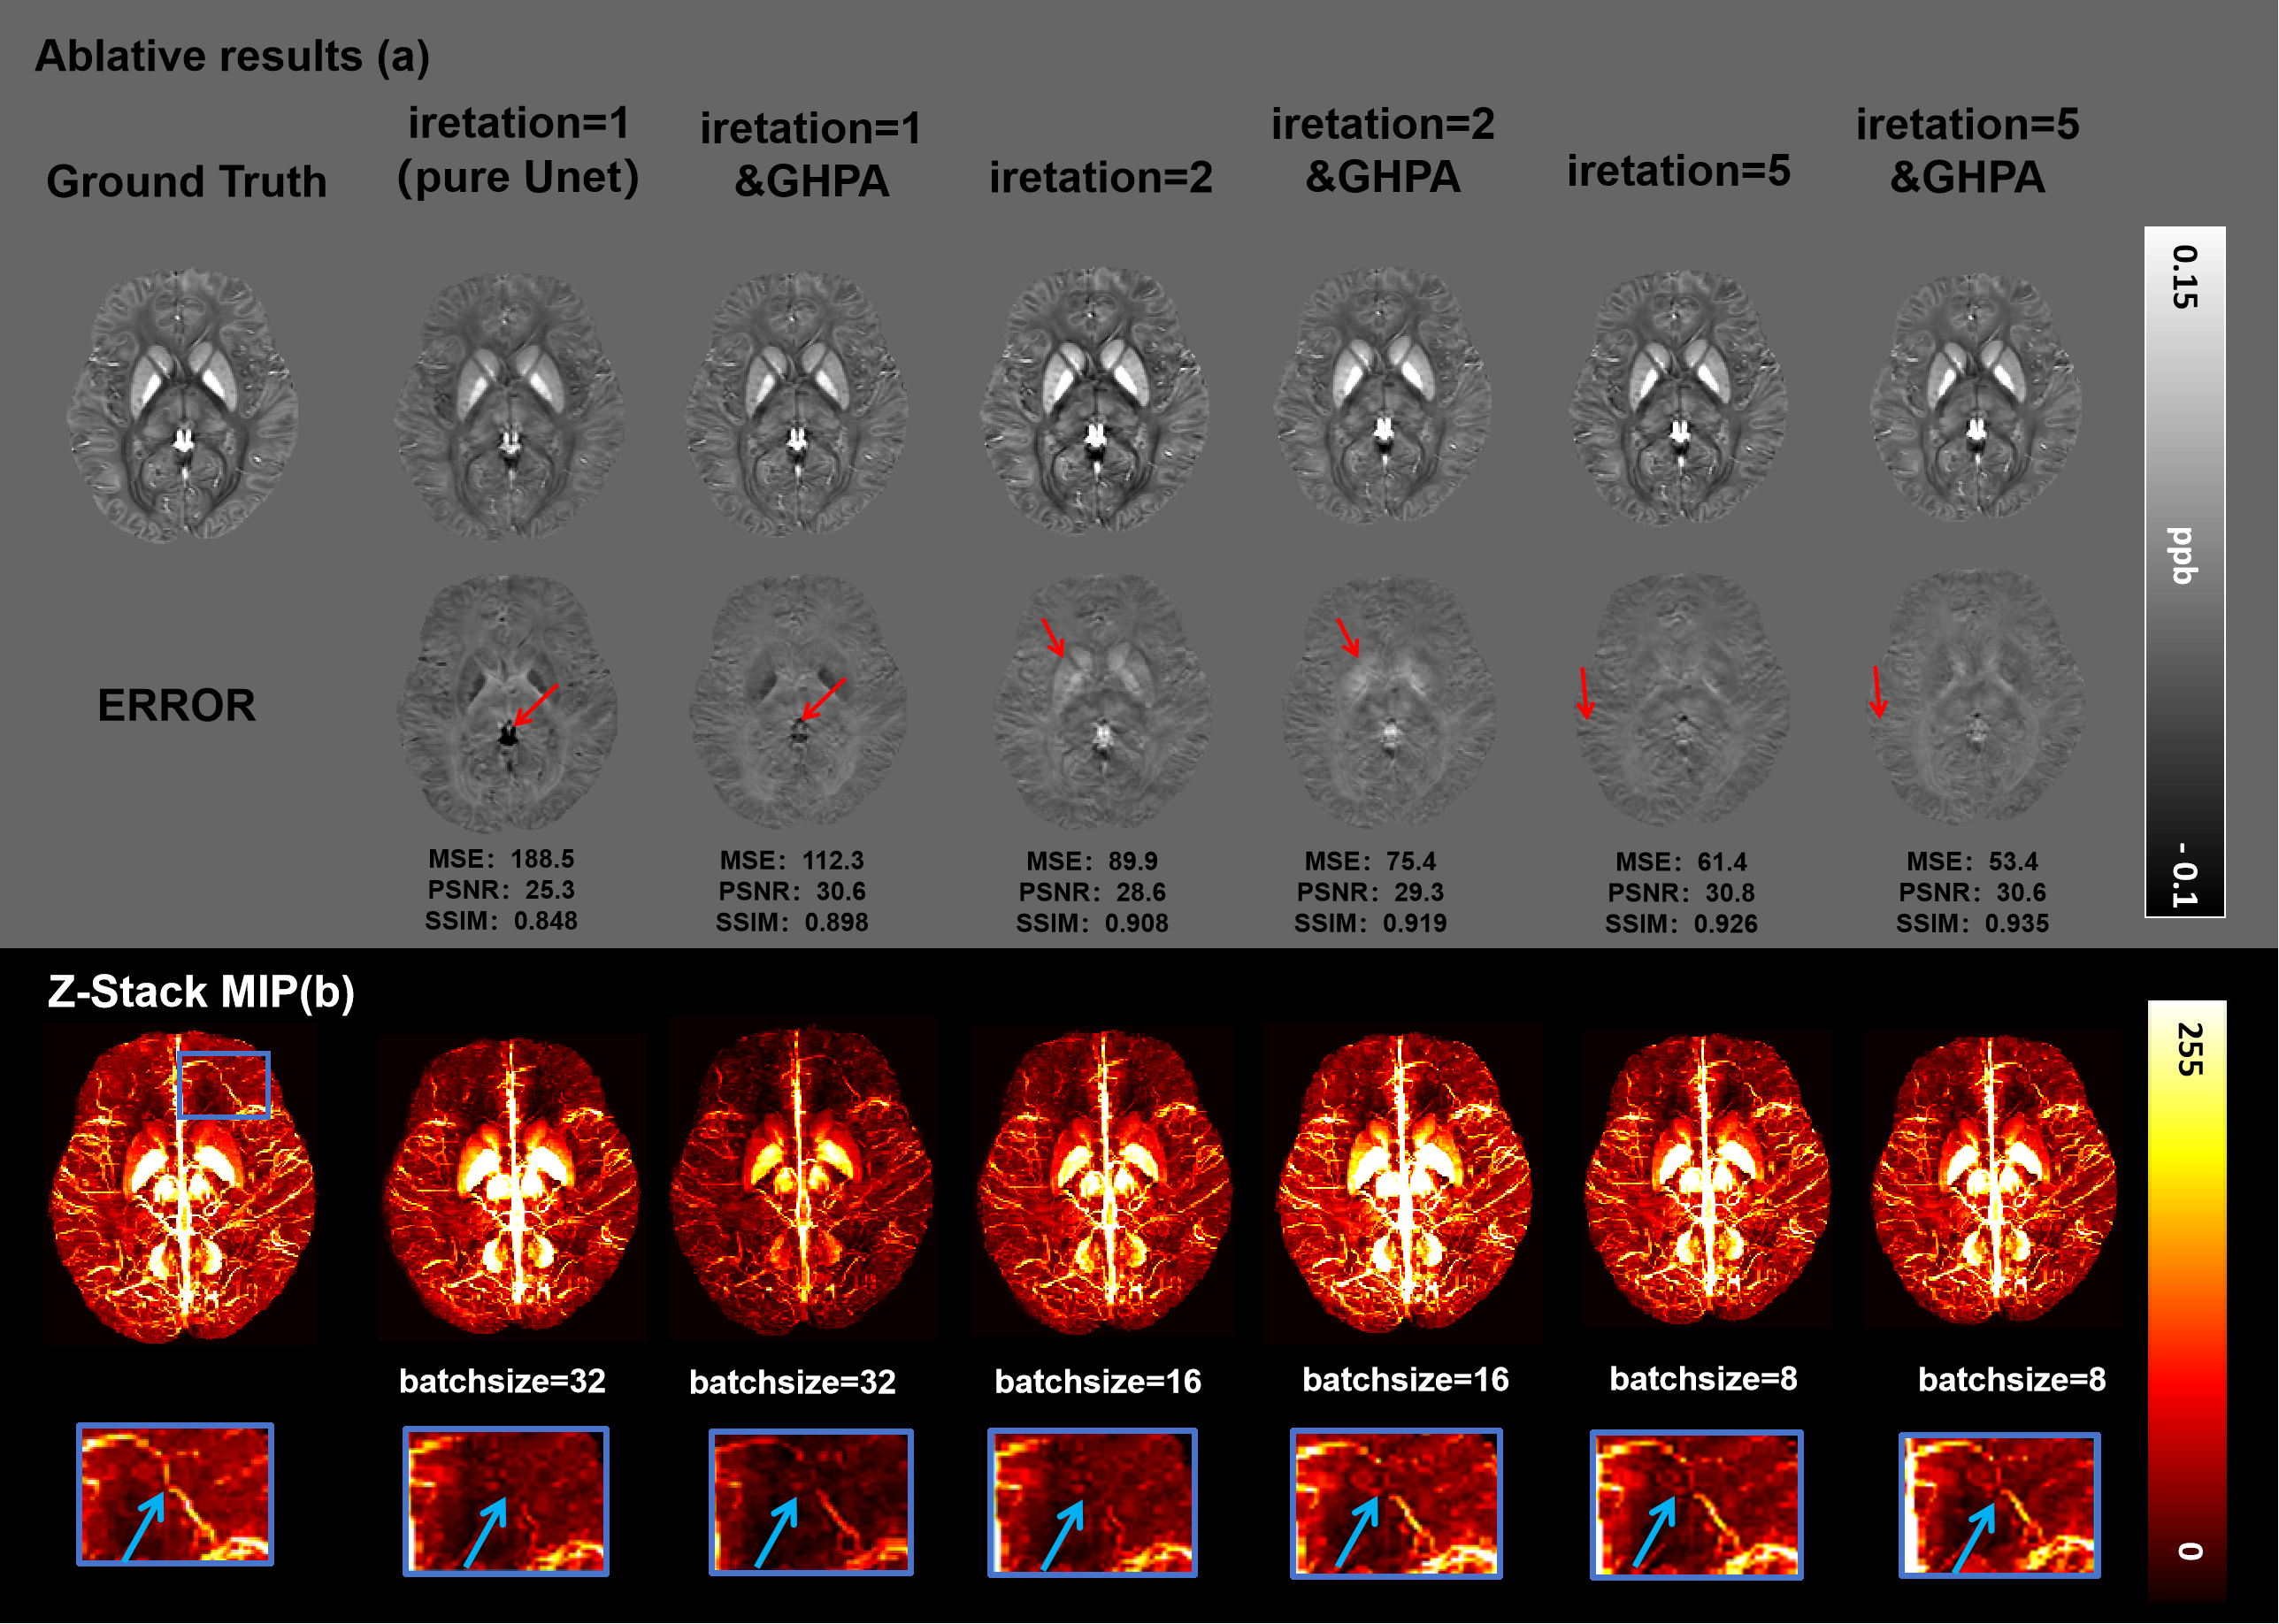
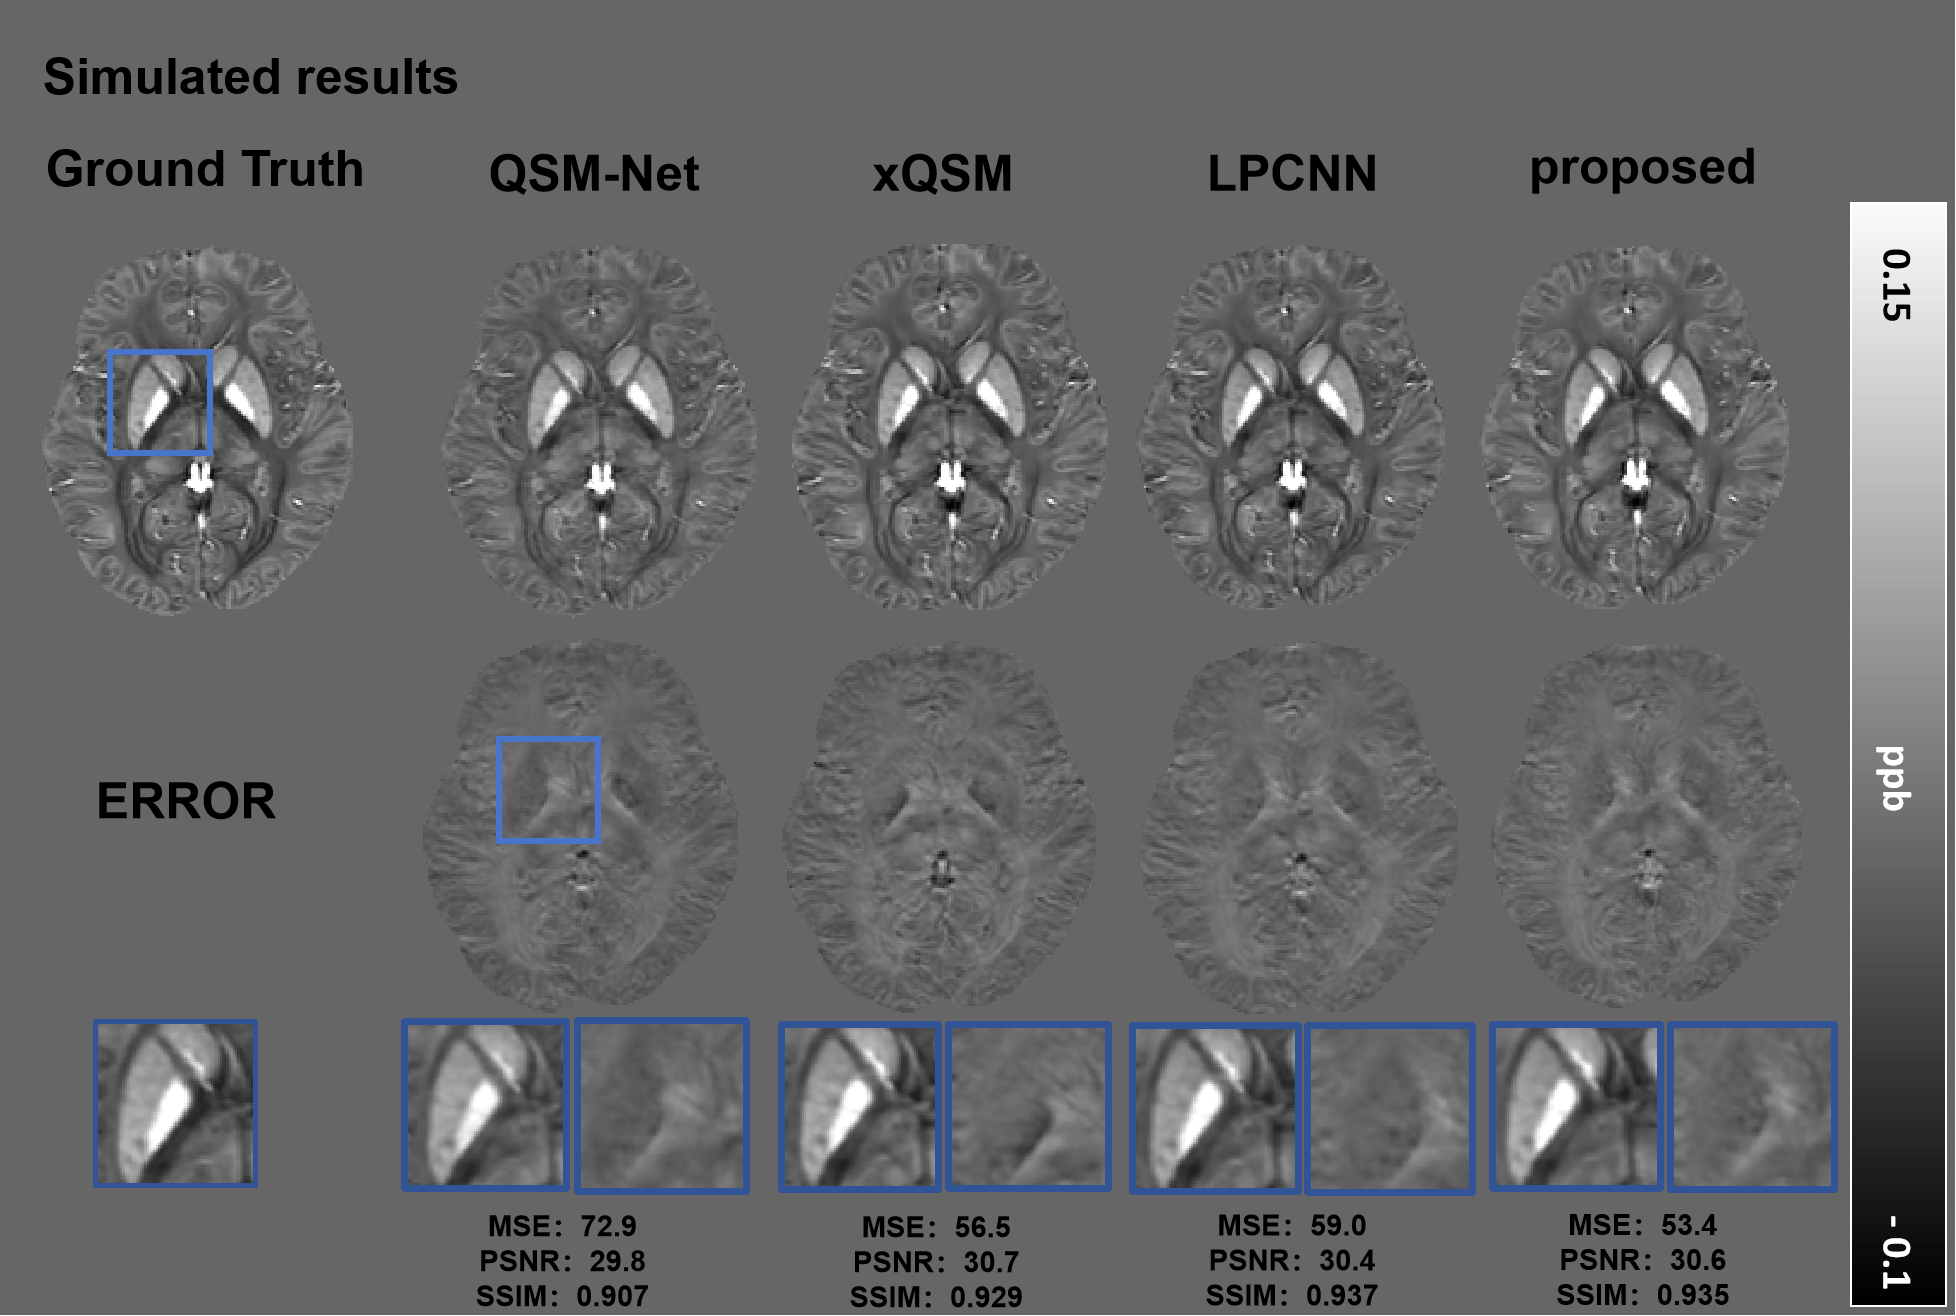
The effectiveness of the proposed bidirectional loop and the GHPA module was investigated using a simulated data, as shown in Fig. 2. As pointed out by the blue arrows, the proposed LoopNet successfully restored a small vein in the frontal white matter region, while the traditional U-net backbone failed to present it clearly. It is also found from the numerical metrics that the performances of the proposed LoopNet gradually increased with the iteration numbers.Figure 3 compares the proposed LoopNet with multiple U-net based QSM methods on a simulated local field map. The proposed method resulted in the best numerical metrics with the highest PSNR and SSIM, and the lowest MSE. Besides, the LoopNet also achieved the minimum reconstruction error compared with previous DLQSM methods, as shown in the zoomed-in images.
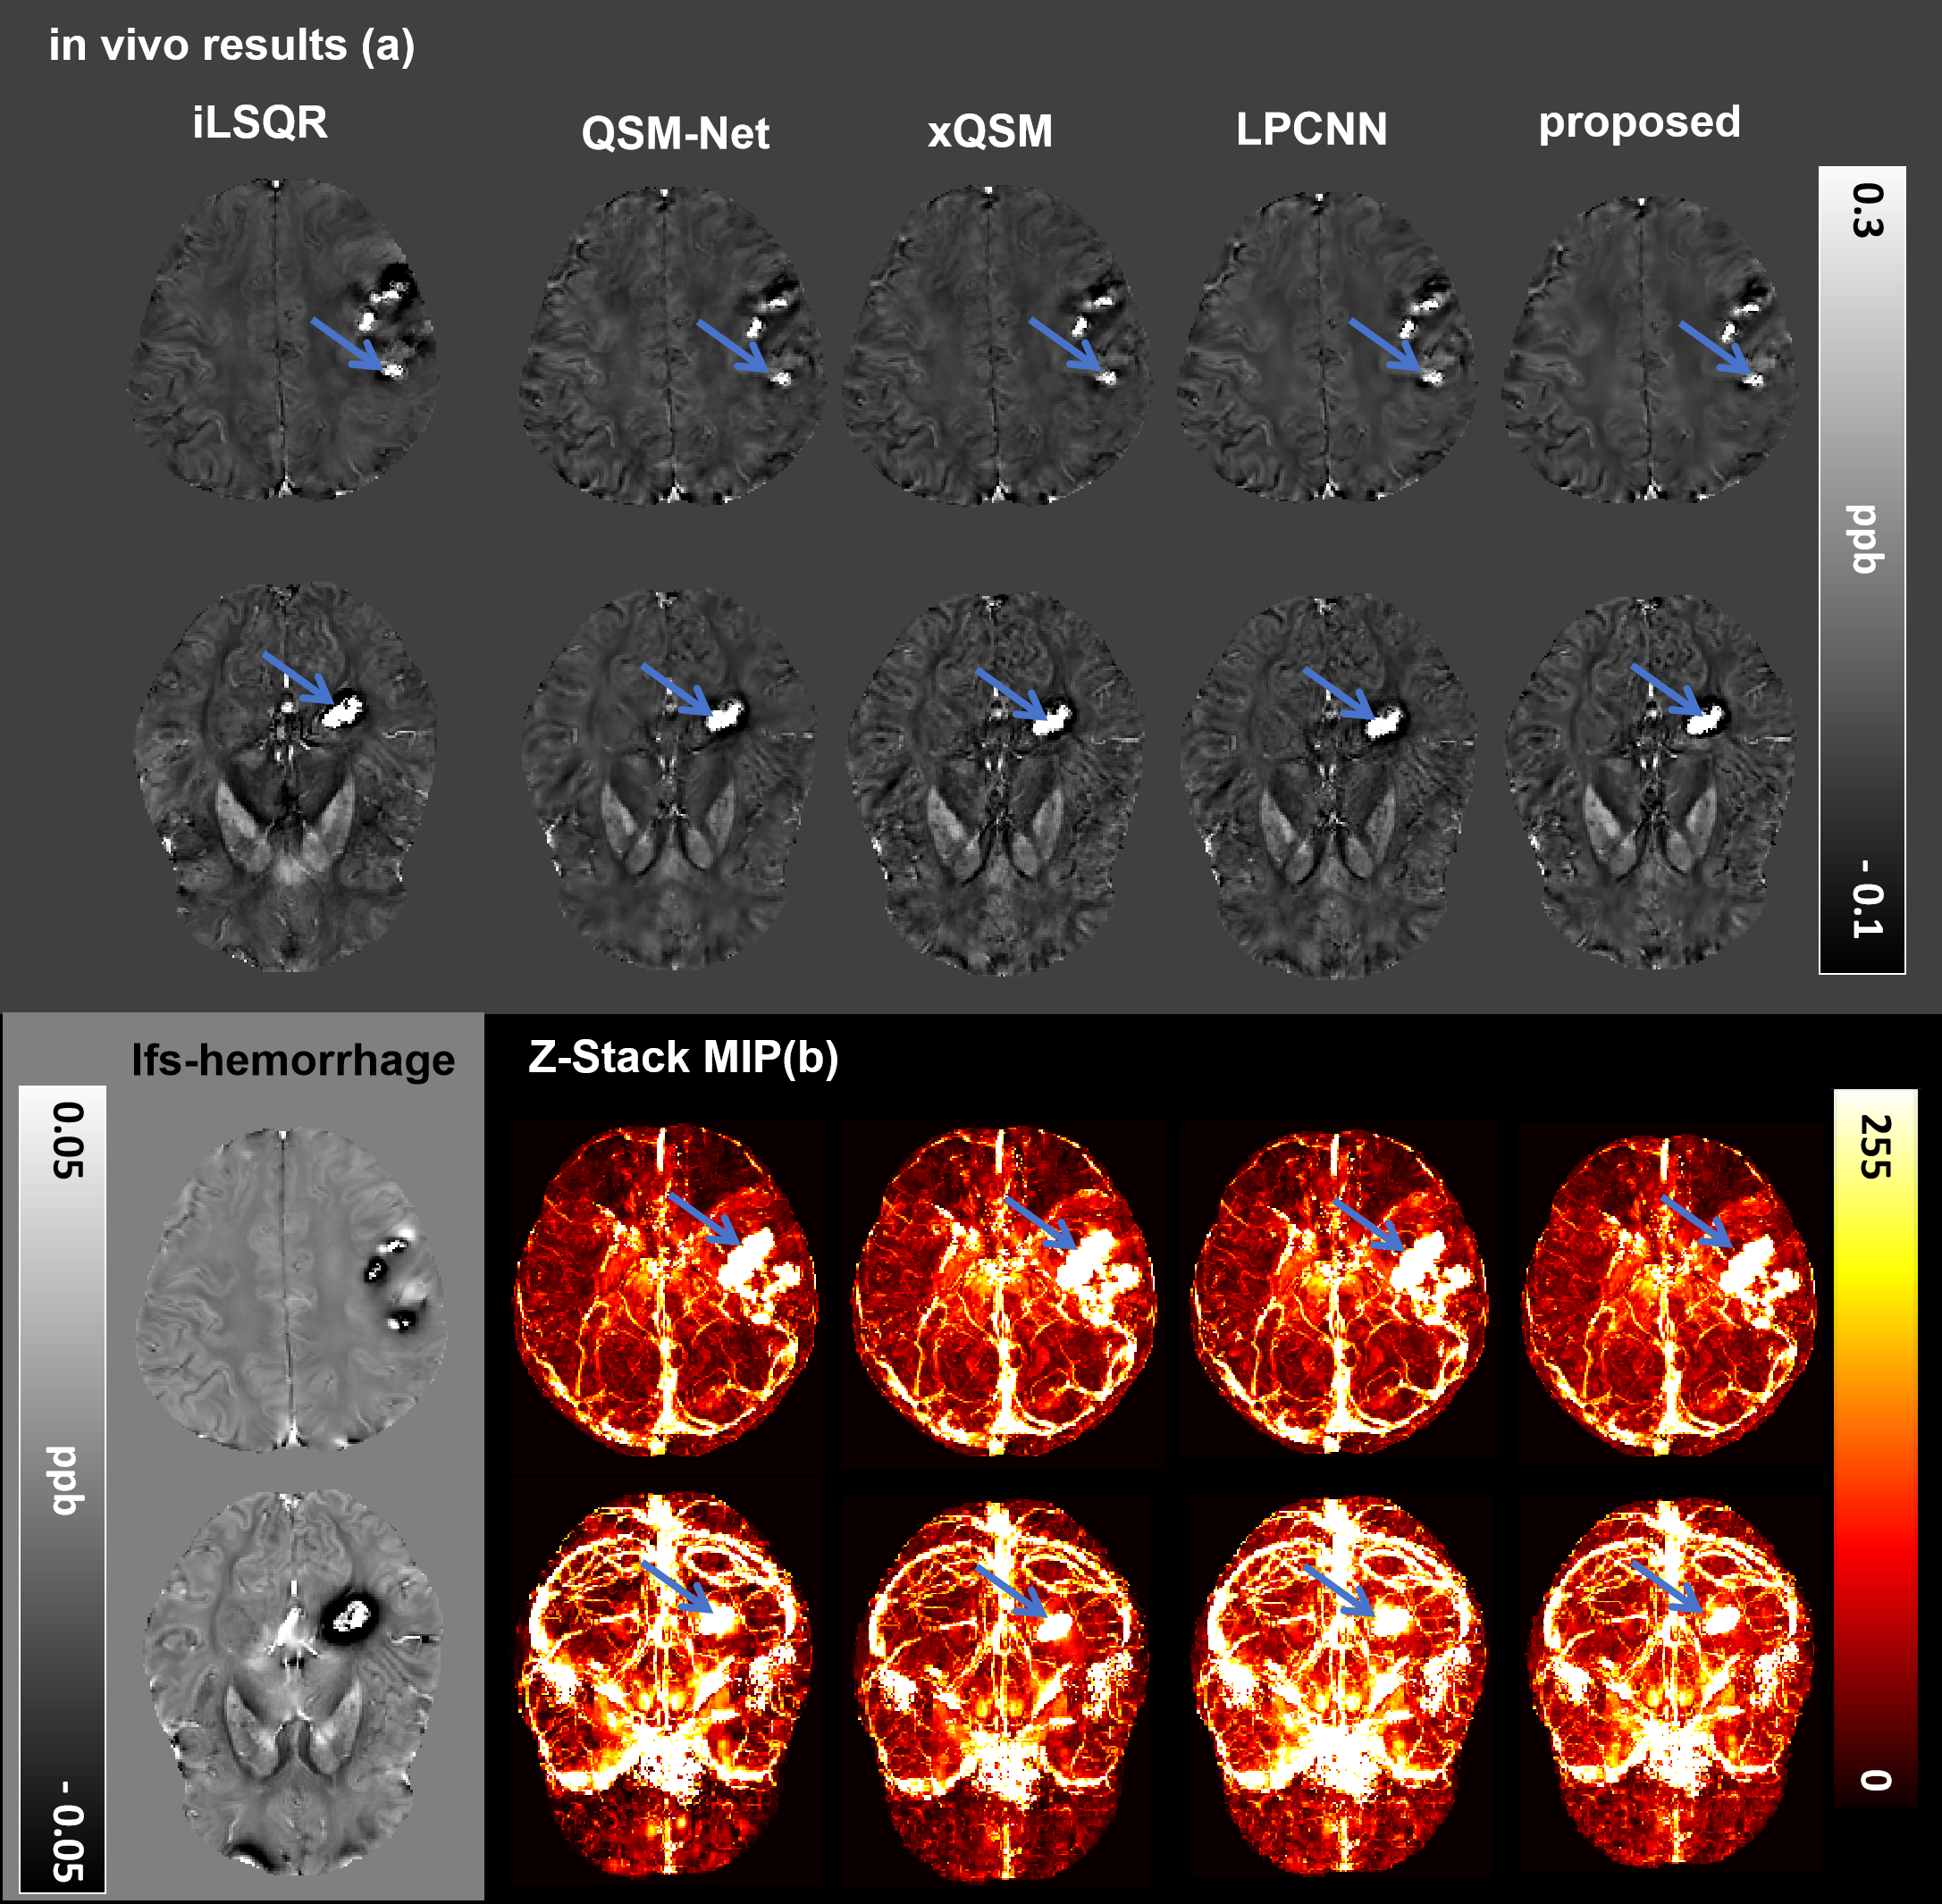
Figure 4 compares different QSM reconstruction methods using two in vivo brain data from two patients with intracranial hemorrhage. All DLQSM methods led to similar QSM results, while according to the mIP images, xQSM and the proposed LoopNet seemed to locate the hemorrhage lesion more precisely, as pointed out by the blue arrows, maybe because they both introduced advanced network architectures (octave convolution and iterative architecture) to make full use of the latent information in the U-net.
Discussion and Conclusion
This paper introduces a novel deep neural network backbone, namely LoopNet, for solving QSM dipole inversion problem. Comparative studies were carried out on both simulated and in vivo data, and the results showed that the proposed LoopNet led to better QSM images with improved numerical metrics.Acknowledgements
YG acknowledges support from the National Natural Science Foundation of China under Grant No. 62301616. HS acknowledges support from the Australian Research Council (DE210101297,DP230101628).References
1. Gao, Y., Zhu, X., Moffat, B.A., Glarin, R., Wilman, A.H., Pike, G.B., Crozier, S., Liu, F., Sun, H., 2021. xQSM: quantitative susceptibility mapping with octave convolutional and noise-regularized neural networks. NMR Biomed. 34 .
2. J. Yoon, E. Gong, I. Chatnuntawech, B. Bilgic, J. Lee, W. Jung, J. Ko, H. Jung, K. Setsompop, G. Zaharchuk, E.Y. Kim, J. Pauly, J. Lee. Quantitative susceptibility mapping using deep neural network: QSMnet. Neuroimage. 2018.
3. Lai, K., M. Aggarwal, P.van, Xu.L,J,Sulam.(2020) Learned Proximal Networks for Quantitative Susceptibility Mapping. eess.IV.2008.05024.
4. Ronneberger O, Fischer P, Brox T. U-net: Convolutional networks for biomedical image segmentation. International Conference on Medical image computing and computer-assisted intervention. Springer, Cham, 2015: 234-241.
5. Li, W., Wang, N., Yu, F., Han, H., Cao, W., Romero, R., … Liu, C. (2015). A method for estimating and removing streaking artifacts in quantitative susceptibility mapping. NeuroImage.
Figures