2620
Repeatability of susceptibility separation methods in brain at 3 T1Department of Radiology and Diagnostic Imaging, University of Alberta, Edmonton, AB, Canada
Synopsis
Keywords: Susceptibility/QSM, Quantitative Susceptibility mapping, Susceptibility separation, Repeatability, Reproducibility, 3T, scan-rescan
Motivation: Susceptibility separation methods aim to separate co-existing myelin and iron contributions. However, their repeatability has not been investigated.
Goal(s): Evaluating repeatability of existing separation methods in brain and comparing their performance.
Approach: Three methods (χ-Sep, χ-SepNet, and APART) were applied to 3T scan-rescan data of 21 healthy subjects, and the resultant dia- and paramagnetic maps were evaluated in white and deep gray matter regions.
Results: Reliability varied by method and region, with many regions showing moderate to good reliability. Average repeatability coefficients were 4 ppb and 8 ppb in white matter and iron-rich deep gray regions, respectively.
Impact: Susceptibility separation methods showed moderate to good reliability in most brain regions, and sub-voxel changes around 5 ppb might be error. Comparing values reported using different methods might not be straightforward, as the difference between measurements could exceed 15 ppb.
INTRODUCTION
New techniques have been proposed recently to separate coexisting positive (χ+) and negative (χ-) susceptibility sources, such as iron and myelin, by capitalizing on both MR phase shift and magnitude decay caused by susceptibility1-4. To facilitate reconstruction from limited measurements, different assumptions have been used to simplify the inverse problem, regarding the relaxometry coefficient (α)1,2,4, and the relationship between R2* and R2’ 1,3. However, the repeatability of these methods has not been investigated. Here, we evaluate the scan-rescan repeatability of three separation methods that use actual R2’ in their models.METHODS
Data Acquisition: 21 healthy subjects (aged 20 to 49 years) were imaged twice in different sessions at 3T using multi-echo gradient-echo (MEGE) for QSM and R2* with 0.9×0.9×1.7 mm3 resolution, 13º flip-angle, and TE1/∆TE/TR of 3.8/5.5/37 ms. R2 mapping data was acquired using dual-echo spin-echo (0.9×0.9×3.5 mm3 resolution, TE1/TE2/TR of 10/93/4000 ms), and Bloch–Siegert B1+ mapping (1.3×1.3×3.0 mm3 resolution).Map Reconstruction: R2 maps and R2* maps were obtained using dictionary-based Bloch fitting 5,6 and mono-exponential fitting, respectively. Phase images were unwrapped using best-path method 7, and background phase was eliminated using V-SHARP 8.
Susceptibility separation was then performed using three publicly available methods: morphology-enabled χ-Sep with α = 137 1, χ-SepNet 9, and APART with dynamic α 4. The first method can optionally use an initial estimate for total susceptibility, and thus was tested with and without providing initial QSM calculated by MEDI 10. The initial estimate however is mandatory for APART, and it was calculated using STAR 11 (suggested by authors), and also using MEDI.
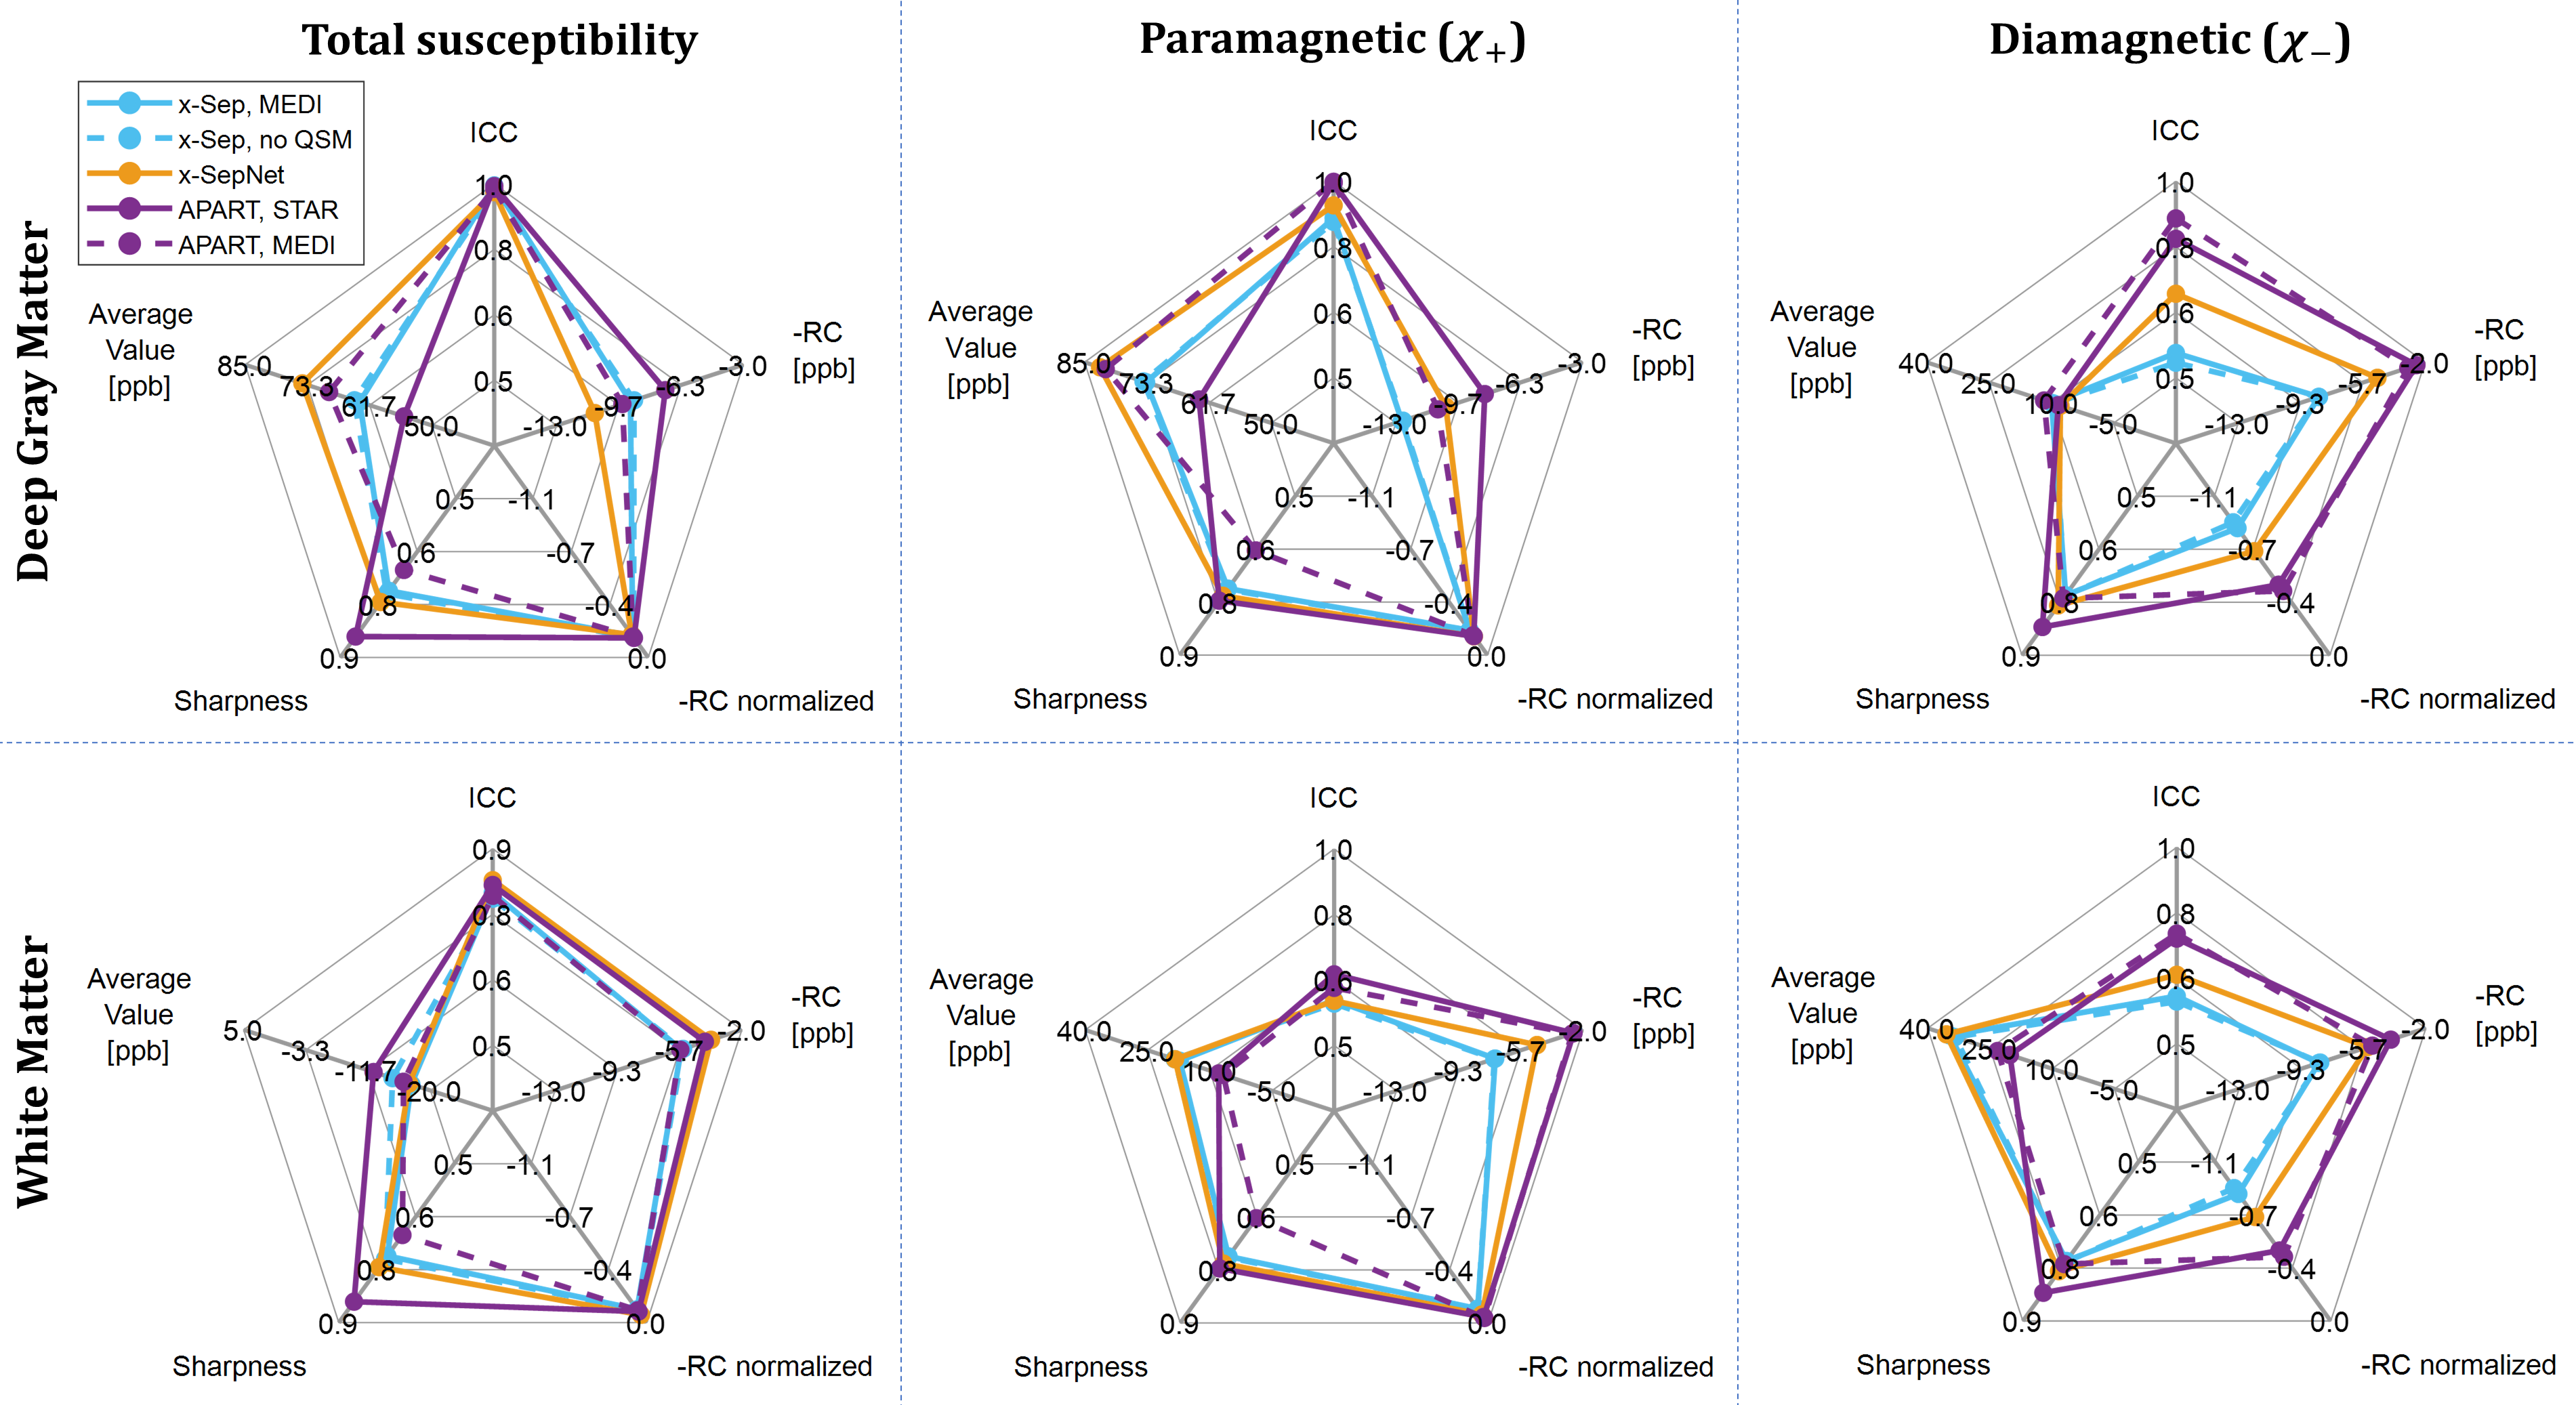
Registration and ROI Definition: T2w images were rigidly registered to MEGE using ANTs 12 to transform R2 maps into MEGE space prior to applying separation. Five measures were used for evaluation: the average value (AV), intraclass correlation coefficient (ICC), image sharpness, repeatability coefficient (RC), and RC normalized by the mean value in deep gray matter (DGM) region. ROI measurements were preformed on 7 DGM regions and 25 white matter (WM) regions based on JHU WM segmentations 13. Final total, dia- and paramagnetic maps were also nonlinearly registered to the FSL MNI152 template 14 to compute voxel-wise measures.
RESULTS
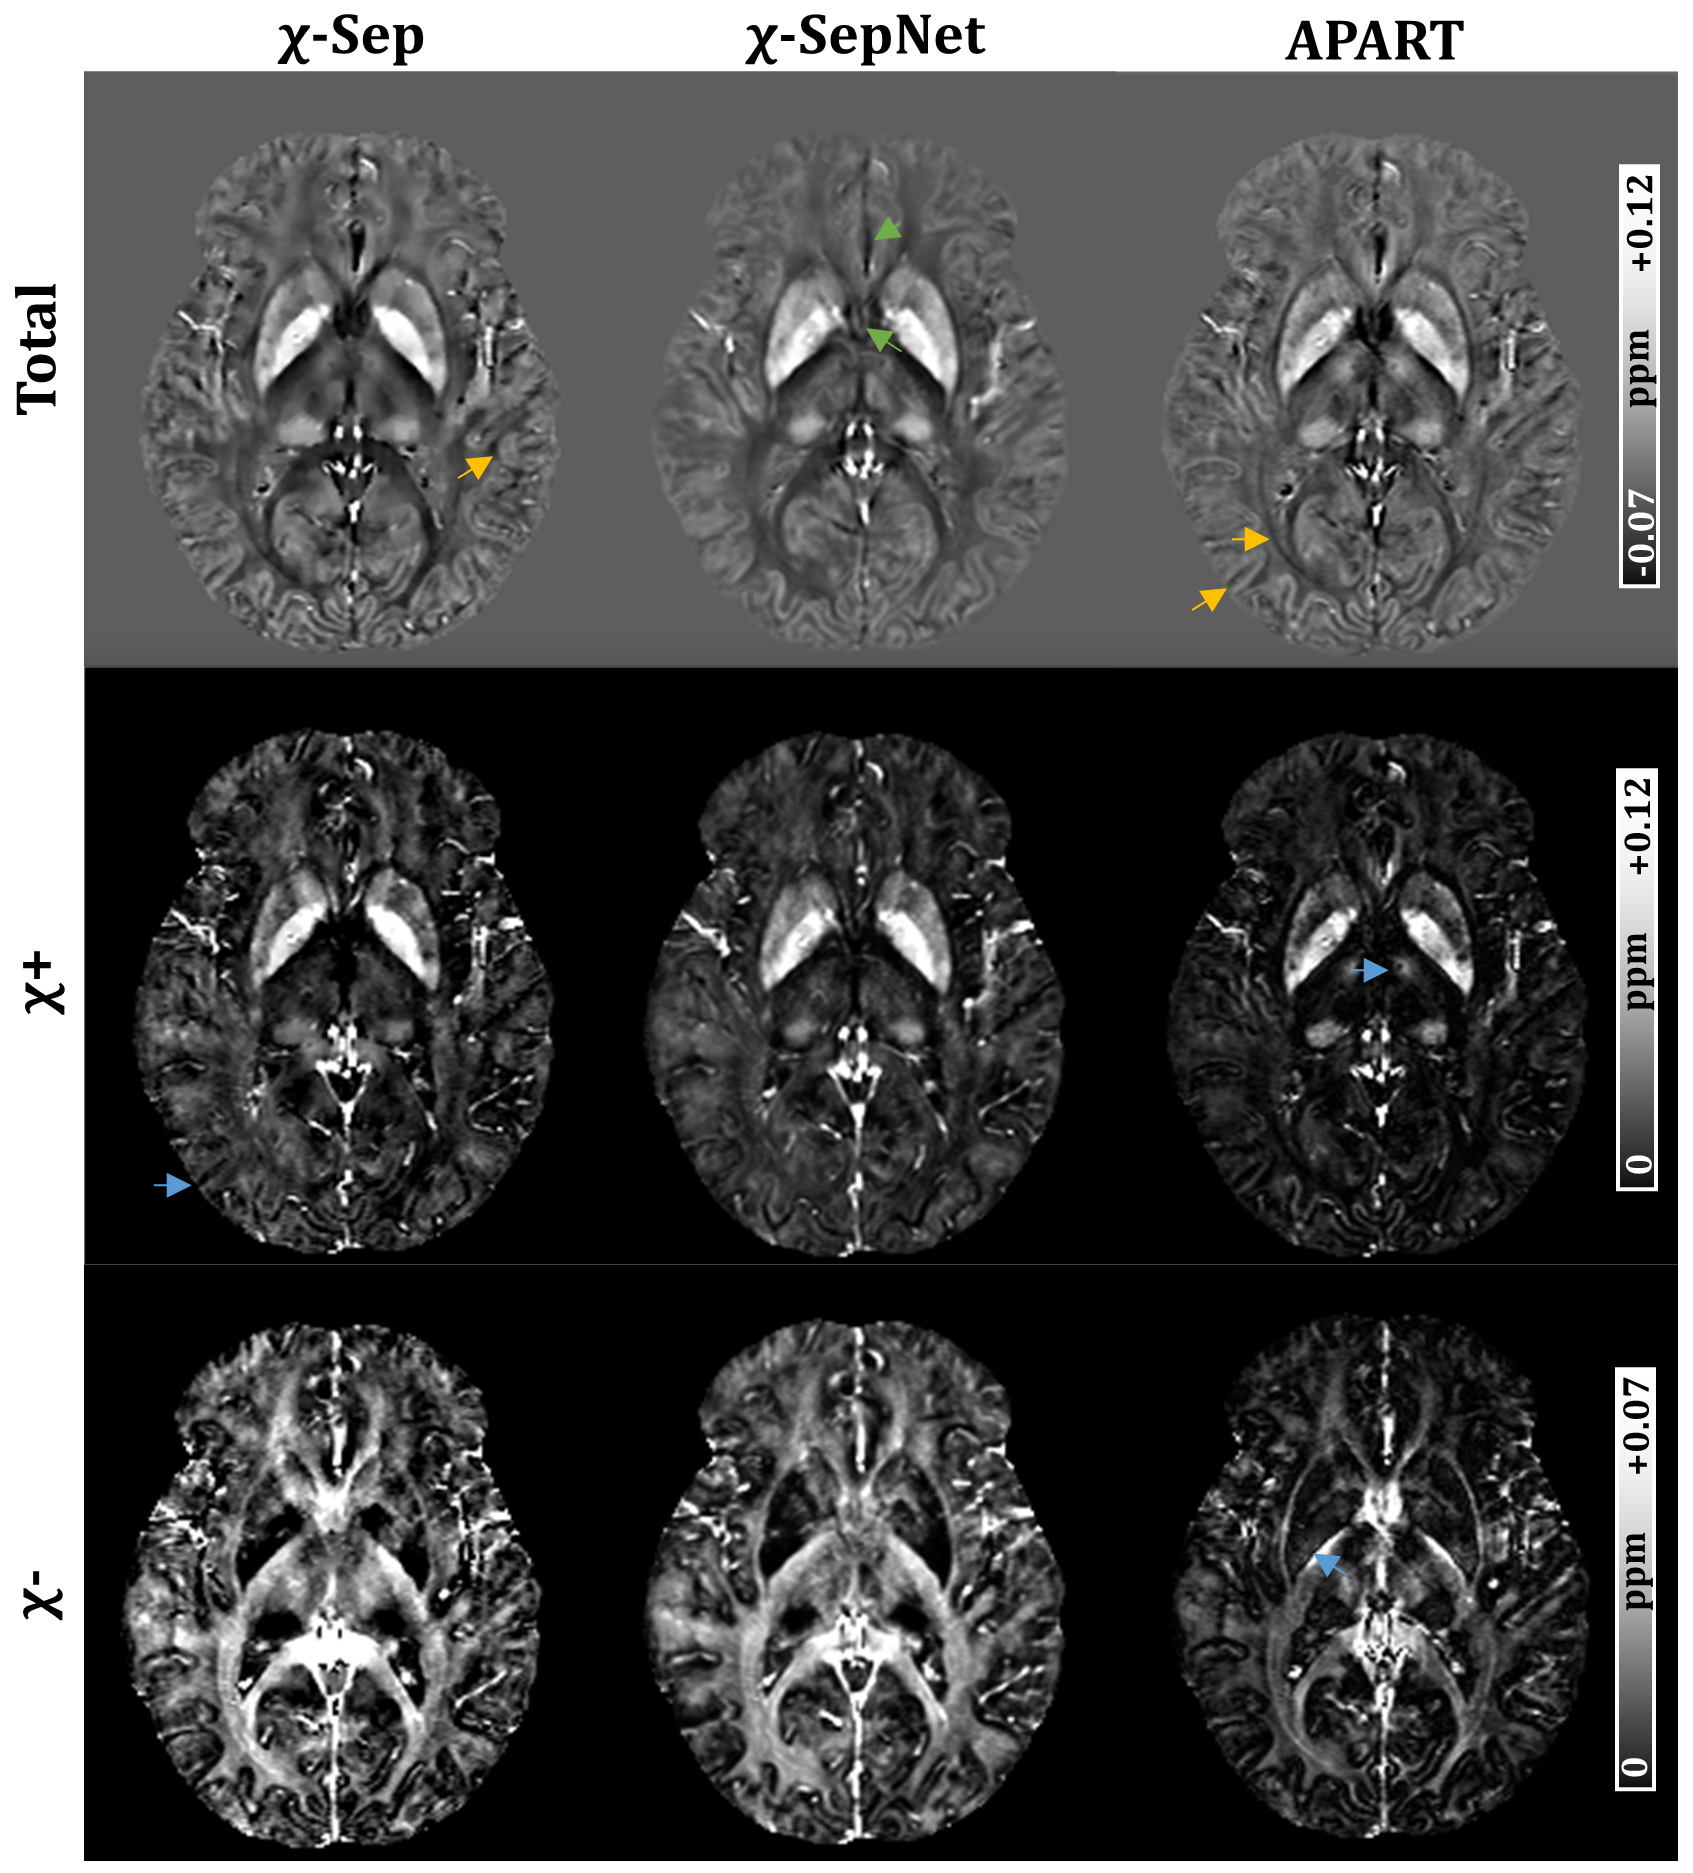
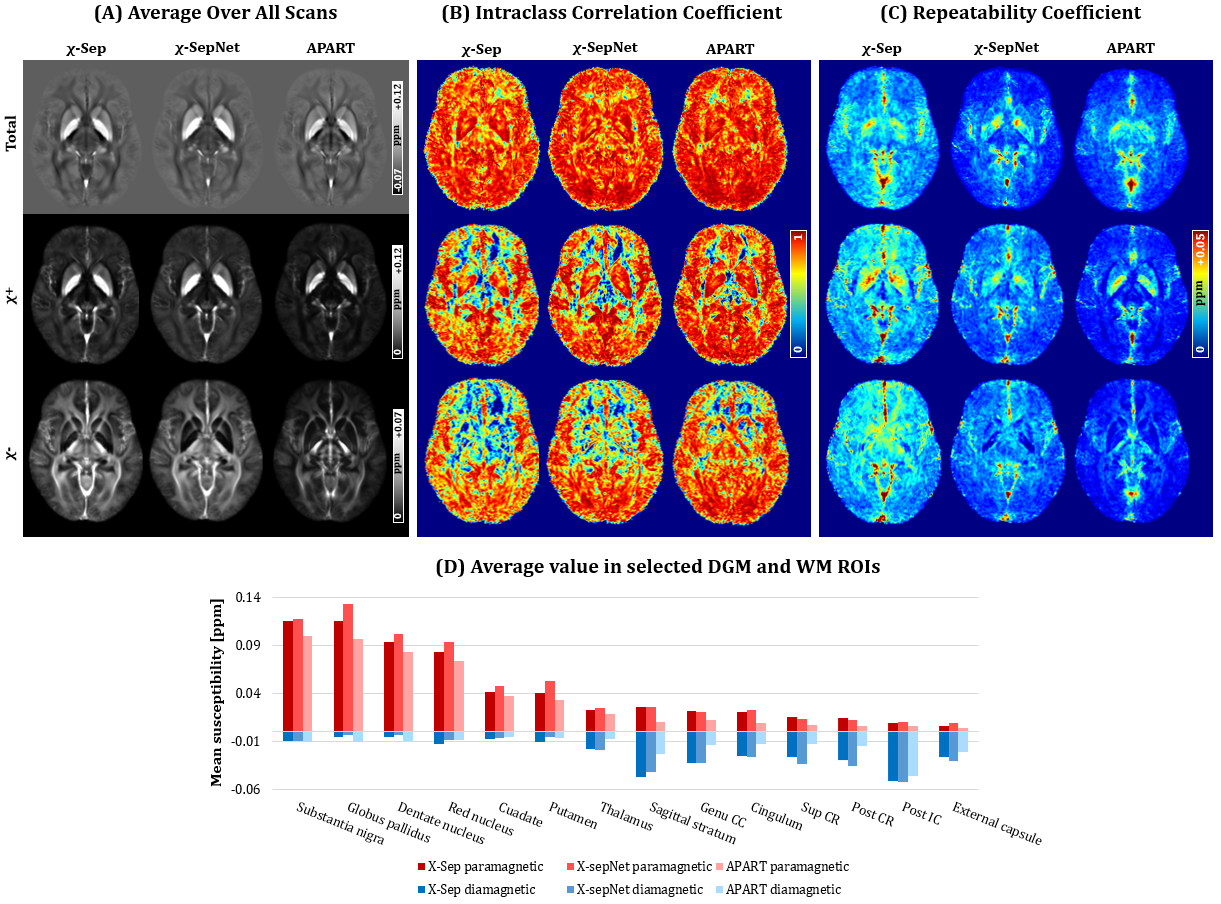
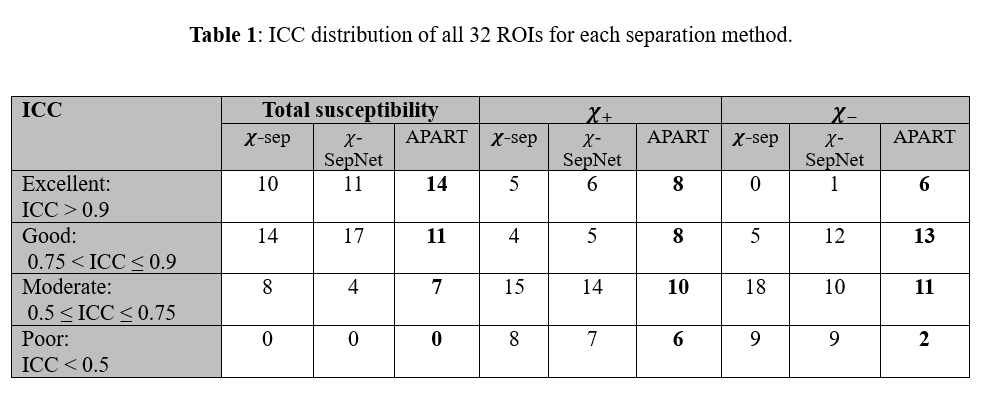
Both χ-Sep and χ-SepNet resulted in comparable measurements, although some local details were blurred in maps produced by χ-SepNet (Figure 1, orange arrows). However, χ-SepNet seems to better reconstruct regions of less reliable phase information (green arrows). Separated maps by APART contain more fine details (blue arrows) but have lower values compared to the other two methods.APART had the highest score in four measures but the lowest average value (Figures 2 and 3). χ-SepNet maps ranked second while preserving higher susceptibility values. Overall, slightly higher scan-rescan variation was observed in the separated maps and lower reliability (ICC), compared to conventional QSM. Lowest reliability was found mainly in regions close to the lower edge of the brain and in the frontal lobe. Using APART, 25% of ROIs on paramagnetic map showed excellent ICC and 56% had moderate to good ICC, compared to 19% and 75% on diamagnetic map, respectively (Table 1). Average RC in DGM/WM was 8.0/3.0 ppb in paramagnetic maps and 3.0/4.0 ppb in diamagnetic maps, and thus changes at these levels might fall within error range.
DISCUSSION
Reliability varied between methods and regions, with APART achieving higher ICC, particularly in diamagnetic measurements. APART solves the separation inverse model at each echo time and explicitly constrains total susceptibility and edge information to a given pre-computed QSM; both reducing variability in its outcomes and leading to better repeatability. However, the quality of the used reference QSM will affect the final separated maps, impacting contrast and local details. Another factor that could contribute to the better repeatability is that APART puts less weight on R2’ information, compared to phase or reference QSM, which could minimize additional variation from R2’ data. However, this method results in lower values, particularly in white matter, which could be attributed to the dynamic relaxometry mechanism that forces smaller values when α gets larger.The χ-SepNet was trained on labels created by a multi-orientation dataset,9 which could explain the improved performance over the original χ-Sep method. Blurriness observed in the χ-SepNet outcome seems to originate from spatial resolution mismatch between training and testing datasets.
CONCLUSIONS
Existing separation methods showed excellent repeatability in iron-rich regions and moderate to good repeatability in WM, but produced different ranges of contrast. Comparing values reported using different methods might not be straightforward, and small measurement changes in the range of 5 ppb might be error.Acknowledgements
This work was supported by the Natural Sciences and Engineering Research Council of Canada and the Canadian Institutes of Health Research.References
1. Shin HG, Lee J, Yun YH, Yoo SH, Jang J, Oh SH, Nam Y, Jung S, Kim S, Fukunaga M, Kim W. χ-separation: Magnetic susceptibility source separation toward iron and myelin mapping in the brain. Neuroimage. 2021;240:118371.
2. Chen J, Gong NJ, Chaim KT, Otaduy MC, Liu C. Decompose quantitative susceptibility mapping (QSM) to sub-voxel diamagnetic and paramagnetic components based on gradient-echo MRI data. Neuroimage. 2021;242:118477.
3. Dimov AV, Nguyen TD, Gillen KM, Marcille M, Spincemaille P, Pitt D, Gauthier SA, Wang Y. Susceptibility source separation from gradient echo data using magnitude decay modeling. Journal of Neuroimaging. 2022;32(5):852-859.
4. Li Z, Feng R, Liu Q, Feng J, Lao G, Zhang M, Li J, Zhang Y, Wei H. APART-QSM: an improved sub-voxel quantitative susceptibility mapping for susceptibility source separation using an iterative data fitting method. NeuroImage. 2023;274:120148.
5. McPhee KC, Wilman AH. T2 quantification from only proton density and T2-weighted MRI by modelling actual refocusing angles. Neuroimage. 2015;118:642-650.
6. Snyder J, Seres P, Stobbe RW, Grenier JG, Smyth P, Blevins G, Wilman AH. Inline dual‐echo T2 quantification in brain using a fast mapping reconstruction technique. NMR in Biomedicine. 2023;36(1):e4811.
7. Abdul-Rahman HS, Gdeisat MA, Burton DR, Lalor MJ, Lilley F, Moore CJ. Fast and robust three-dimensional best path phase unwrapping algorithm. Applied optics. 2007;46(26):6623-6635.
8. Li W, Wu B, Liu C. Quantitative susceptibility mapping of human brain reflects spatial variation in tissue composition. Neuroimage. 2011;55(4):1645–1656.
9. M. Kim, H. Shin, C. Oh, H. Jeong, S. Ji, H. An, J. Kim, J. Jang, B. Bilgic, and J. Lee, "Chi-sepnet: Susceptibility source separation using deep neural network", 30th Annual Meeting of International Society of Magnetic Resonance in Medicine, 2022; 2464.
10. Liu J, Liu T, de Rochefort L, Ledoux J, Khalidov I, Chen W, Tsiouris AJ, Wisnieff C, Spincemaille P, Prince MR, Wang Y. Morphology enabled dipole inversion for quantitative susceptibility mapping using structural consistency between the magnitude image and the susceptibility map. Neuroimage. 2012;59(3):2560-2568.
11. Wei H, Dibb R, Zhou Y, Sun Y, Xu J, Wang N, Liu C. Streaking artifact reduction for quantitative susceptibility mapping of sources with large dynamic range. NMR in Biomedicine. 2015 Oct;28(10):1294-1303.
12. Avants BB, Tustison NJ, Song G, Cook PA, Klein A, Gee JC. A reproducible evaluation of ANTs similarity metric performance in brain image registration. Neuroimage. 2011 Feb 1;54(3):2033-2044.
13. Wakana S, Caprihan A, Panzenboeck MM, Fallon JH, Perry M, Gollub RL, Hua K, Zhang J, Jiang H, Dubey P, Blitz A. Reproducibility of quantitative tractography methods applied to cerebral white matter. Neuroimage. 2007 Jul 1;36(3):630-644.
14. Jenkinson M, Beckmann CF, Behrens TE, Woolrich MW, Smith SM. FSL Neuroimage. 2012 Aug 15;62(2):782-790.
Figures